Market Overview
| Study Period | 2018 - 2031 |
|---|---|
| Forecast Data Period | 2026 - 2031 |
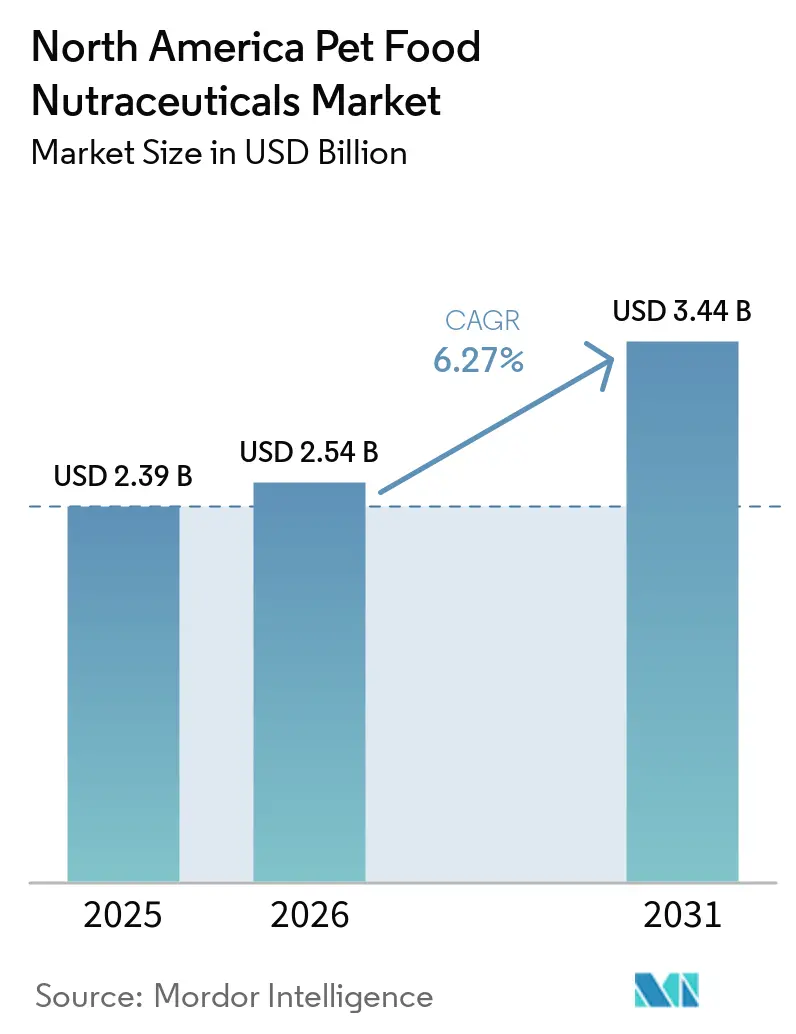
| Base Year Market Size (2025) | USD 2.39 Billion |
| Market Size (2026) | USD 2.54 Billion |
| Market Size (2031) | USD 3.44 Billion |
| Growth Rate (2026 - 2031) | 6.27% CAGR |
| Market Concentration | Medium |
Major Players *Disclaimer: Major Players sorted in no particular order Image © Mordor Intelligence. Reuse requires attribution under CC BY 4.0. | |
North America Pet Food Nutraceuticals Market Analysis by Mordor Intelligence
The North America pet food nutraceuticals market size was valued at USD 2.39 billion in 2025 and estimated to grow from USD 2.54 billion in 2026 to reach USD 3.44 billion by 2031, at a CAGR of 6.27% during the forecast period (2026-2031). Owners are increasingly opting for preventive health solutions, particularly for aging pets that require support for their joints, cognitive function, and digestive health. The market's expansion is underpinned by demographic forces that traditional pet food cannot address alone, particularly the aging companion animal population, which requires specialized joint, cognitive, and digestive support. Macro forces reshaping the industry include regulatory modernization efforts that create both opportunities and compliance burdens. The FDA's (Food and Drug Administration) Animal Food Ingredient Center, launched in 2024, represents a pivotal shift toward streamlined approval pathways for novel ingredients, yet the ongoing ambiguity between the FDA and AAFCO (Association of American Feed Control Officials) jurisdictions continues to inflate development costs for manufacturers. Modernized but still complex regulations create both streamlined ingredient approvals and lingering cost burdens, while biotechnology offers alternatives to fragile marine supply chains.
Key Report Takeaways
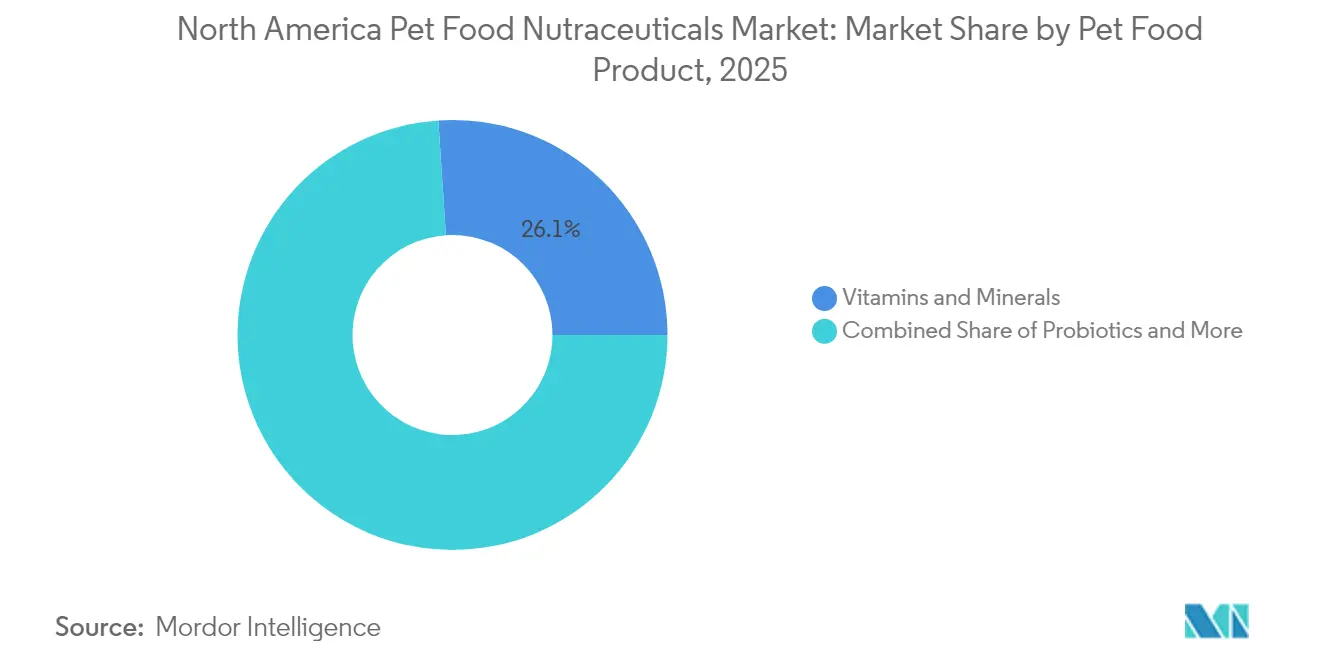
- By sub-product, vitamins and minerals led with a 26.05% revenue share in 2025, and the segment is projected to expand at a 6.72% CAGR through 2031.
- By pet type, dogs accounted for 60.95% of the North America pet food nutraceuticals market share in 2025, while the dog segment is projected to advance at a 6.55% CAGR through 2031.
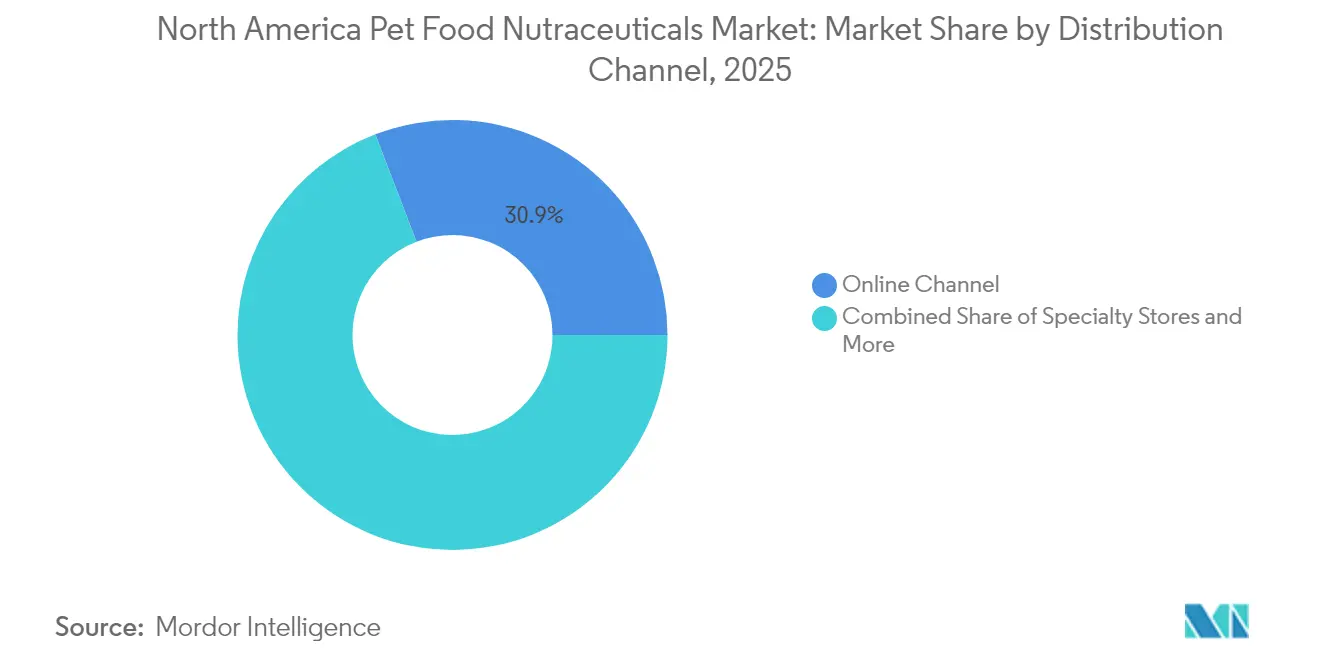
- By distribution channel, online platforms captured 30.85% of the North America pet food nutraceuticals market size in 2025 and are projected to grow at a 7.31% CAGR between 2026 and 2031.
- By geography, the United States dominated with an 87.35% share in 2025, whereas Mexico is forecast to expand at a 8.96% CAGR during the same period.
Note: Market size and forecast figures in this report are generated using Mordor Intelligence’s proprietary estimation framework, updated with the latest available data and insights as of 2026.
North America Pet Food Nutraceuticals Market Trends and Insights
Drivers Impact Analysis*
| Driver | (~) % Impact on CAGR Forecast | Geographic Relevance | Impact Timeline |
|---|---|---|---|
| Humanization of pets elevates spend on preventive supplements | +1.8% | North America, strongest in the United States urban markets | Medium term (2-4 years) |
| Aging companion-animal population drives joint and cognitive nutraceutical demand | +1.5% | US and Canada, emerging in Mexico | Long term (≥ 4 years) |
| Rapid e-commerce adoption enables direct-to-consumer distribution | +1.2% | North America, accelerated by subscription models | Short term (≤ 2 years) |
| Veterinary endorsements enhance product credibility and uptake | +0.9% | United States and Canada, with limited Mexico penetration | Medium term (2-4 years) |
| Subscription-based personalized nutrition models gain traction | +0.7% | United States primarily, expanding to Canada | Medium term (2-4 years) |
| Precision-fermented and post-biotic ingredients improve cost stability | +0.4% | North America's manufacturing hubs | Long term (≥ 4 years) |
| Source: Mordor Intelligence | |||


Humanization of Pets Elevates Spending on Preventive Supplements
Pet owners are increasingly treating their companions as family members, fundamentally reshaping their purchasing decisions toward premium preventive healthcare products. The American Pet Products Association projects total pet industry spending will reach USD 207 billion by 2030, with supplements capturing a disproportionate share of this growth as owners prioritize longevity and quality of life interventions [1]Source: American Pet Products Association Staff, “Pet Industry Market Size, Trends and Ownership Statistics,” APPA, americanpetproducts.org. This behavioral shift is most evident in urban markets, where high disposable income levels support the adoption of premium products. The trend is also spreading to suburban and rural areas through increased e-commerce accessibility. The humanization trend creates opportunities for brands that successfully communicate scientific backing and health outcomes, rather than relying solely on ingredient marketing.
Aging Companion-Animal Population Drives Joint and Cognitive Nutraceutical Demand
Demographic shifts in pet populations create a sustained demand for age-related health interventions, with senior pets (7 years and older) accounting for 20-40% of the companion animal population, depending on the species and geographic location. This aging cohort requires specialized nutrition support for joint mobility, cognitive function, and digestive health that traditional pet foods cannot adequately address. The trend is most pronounced in the United States and Canada, where established pet ownership patterns result in higher concentrations of senior animals. In contrast, Mexico's younger pet demographic suggests future growth potential as these animals age. Joint health supplements containing glucosamine, chondroitin, and omega-3 fatty acids represent the largest segment within the age-related nutrition market. The aging pet population also drives innovation in delivery formats, with soft chews and liquid supplements gaining traction among owners managing pets with reduced appetite or swallowing difficulties.
Rapid E-commerce Adoption Enables Direct-to-Consumer Distribution
Digital commerce has revolutionized pet supplement distribution, with online channels accounting for 40% of total pet food sales and capturing a 30.6% market share in supplement categories as of 2024. This shift enables brands to bypass traditional retail markups while building direct relationships with consumers through subscription models and personalized nutrition programs. E-commerce growth accelerates particularly in supplement categories where consumers value detailed product information, ingredient transparency, and customer reviews that physical retail cannot easily provide. Amazon's dominance in pet supplement sales creates both opportunities and challenges, with brands like Zesty Paws achieving market leadership through platform optimization while facing increased competition and margin pressure. The channel shift also enables data collection on pet health outcomes and purchasing patterns, informing product development and personalized nutrition recommendations that traditional retail relationships cannot support.
Veterinary Endorsements Enhance Product Credibility and Uptake
Professional veterinary recommendations have a significant influence on pet owners' purchasing decisions, particularly in health-focused supplement categories where efficacy claims require scientific validation. The National Animal Supplement Council (NASC) quality seal program provides a framework for veterinary endorsement, with certified products achieving higher adoption rates and premium pricing compared to non-certified alternatives. This dynamic creates competitive advantages for established brands with veterinary channel relationships, while presenting barriers for new entrants lacking clinical data or professional networks. The trend toward evidence-based veterinary medicine increases demand for supplements with published research and clinical trial data, creating opportunities for brands that prioritize scientific validation over marketing claims.
Restraints Impact Analysis*
| Restraint | (~) % Impact on CAGR Forecast | Geographic Relevance | Impact Timeline |
|---|---|---|---|
| FDA–AAFCO regulatory ambiguity raises compliance costs | -1.1% | The United States primarily, with spillover to Canada | Short term (≤ 2 years) |
| Price sensitivity amid inflation causes trade-down to basic diets | -0.9% | North America, most acute in price-sensitive segments | Short term (≤ 2 years) |
| Shrinking marine-omega-3 quotas tighten key input supply | -0.6% | North America, global supply chain impact | Medium term (2-4 years) |
| Pet-data privacy concerns curb uptake of DNA-driven formulations | -0.3% | United States and Canada, with limited Mexico impact | Medium term (2-4 years) |
| Source: Mordor Intelligence | |||
FDA-AAFCO Regulatory Ambiguity Raises Compliance Costs
Overlapping jurisdictions between the Food and Drug Administration and the Association of American Feed Control Officials create compliance uncertainties that inflate development costs and delay product launches for supplement manufacturers. The expiration of the FDA-AAFCO (Food and Drug Administration - Association of American Feed Control Officials) memorandum of understanding in 2024 left unclear boundaries regarding ingredient approval pathways, with some manufacturers facing dual regulatory requirements that extend approval timelines by 12-18 months [2]Source: FDA Staff, “Animal Food Ingredient Center,” U.S. Food and Drug Administration, fda.gov. This regulatory complexity particularly affects innovative ingredients, such as precision-fermented compounds and novel bioactives, which lack established approval precedents. Smaller companies face disproportionate impacts from regulatory uncertainty, as they often lack the resources to navigate complex approval processes or absorb extended development timelines. The FDA's new Animal Food Ingredient Center, launched in 2024, aims to streamline approvals, yet implementation remains inconsistent across ingredient categories.
Price Sensitivity Amid Inflation Causes Trade-Down to Basic Diets
Inflationary pressures affecting household budgets drive some pet owners to reduce spending on premium supplements in favor of basic nutrition options, particularly among price-sensitive consumer segments. Transportation costs, packaging materials, and raw ingredient prices increased 8-12% during 2024, forcing manufacturers to implement price increases that reduce affordability for middle-income households. This dynamic creates market segmentation where premium supplement adoption becomes concentrated among higher-income consumers while mass-market segments experience demand softening. Economic pressures also accelerate consumer research behavior, with price-conscious buyers increasingly comparing ingredient lists and cost-per-serving metrics rather than relying on brand loyalty or marketing claims.
*Our forecasts treat driver/restraint impacts as directional, not additive. The impact forecasts reflect baseline growth, mix effects, and variable interactions.
Segment Analysis
By Sub Product: Vitamins Drive Market Leadership
Vitamins and minerals hold the largest market share at 26.05% in 2025, while also leading growth at a 6.72% CAGR through 2031, reflecting sustained demand for foundational nutritional support across all pet demographics. This dual dominance stems from the category's broad applicability, spanning everything from puppy development to senior wellness, combined with relatively straightforward regulatory pathways that enable rapid product innovation.
The leadership position of this segment is primarily driven by the increasing endorsement of pet nutritional supplements by veterinarians to maintain overall pet health. The United States accounts for the largest share of the vitamins and minerals market, with pet owners demonstrating a growing awareness of preventive healthcare. Dogs are the primary consumers of vitamins and minerals in North America, with pet owners increasingly focusing on supplementing their pets' diets with essential nutrients for optimal health and wellness.


By Pets: Canine Dominance Reflects Owner Investment
Dogs capture 60.95% of the North America pet food nutraceuticals market share in 2025 and lead segment growth at 6.55% CAGR through 2031, driven by higher supplement adoption rates and larger average body weights that support premium pricing strategies. This dominance reflects both the larger dog population and higher owner investment levels in canine health compared to other companion animals. The segment's dominance is further strengthened by the availability of a diverse range of specialized nutraceutical products targeting specific health conditions in dogs, including joint health supplements, digestive aids, and immune system boosters.
The aging dog population, particularly, drives demand for joint health and cognitive support supplements, with senior dogs representing the highest per-pet spending segment across all supplement categories. Dogs are known to suffer from a wider range of health issues, such as joint problems, skin allergies, and digestive issues, which has led to increased demand for nutraceuticals in the region. Large breed dogs command premium pricing for joint health products due to higher ingredient dosage requirements and breed-specific health predispositions.
By Distribution Channel: Digital Commerce Reshapes Access
Online channels are likely to command a 30.85% market share in 2025 and lead growth at a 7.31% CAGR through 2031, fundamentally altering how consumers discover, research, and purchase pet supplements. This digital transformation enables brands to provide detailed product information, customer reviews, and educational content that traditional retail formats cannot match.
E-commerce growth is particularly pronounced in specialized supplement categories where consumers value ingredient transparency and professional recommendations that online platforms can deliver through detailed product descriptions and veterinary endorsements. Subscription models within online channels create recurring revenue streams while improving customer lifetime value compared to traditional retail purchases.
Geography Analysis
The United States maintains an overwhelming market dominance with an 87.35% share in 2025, reflecting mature pet ownership patterns, high disposable income levels, and established supplement adoption behaviors that have developed over decades of market evolution. American consumers demonstrate a high willingness to pay premium prices for specialized pet nutrition, supported by veterinary recommendation systems and regulatory frameworks that foster consumer confidence in product efficacy and safety.
Mexico emerges as the fastest-growing geography, with a 8.96% CAGR through 2031, driven by rapid urbanization, expanding middle-class income levels, and accelerating pet humanization trends that mirror patterns observed in mature markets decades ago. Mexican consumers are increasingly viewing pets as family members deserving of premium healthcare interventions. Supplement adoption remains concentrated in urban areas with higher income levels and better veterinary infrastructure.
Canada represents a stable, intermediate market with established supplement adoption patterns and regulatory frameworks that closely align with those of the United States, facilitating cross-border trade and product development strategies. Canadian consumers demonstrate similar premium pricing acceptance to US counterparts, yet the smaller market size limits investment in Canada-specific product development or marketing programs.
Competitive Landscape
The North America pet food nutraceuticals market exhibits moderate concentration, with the top players Mars, Incorporated, Vetoquinol, Nestle (Purina), Wellness Pet Company, Inc. (Clearlake Capital Group, L.P.), and ADM. Leading companies in the North America pet food nutraceuticals market are actively pursuing innovation through new product development, particularly in specialized formulations targeting specific health conditions in pets. Companies are expanding their manufacturing capabilities and distribution networks across the region to meet growing demand and improve market penetration. Strategic partnerships with veterinary clinics, research institutions, and e-commerce platforms have become crucial for maintaining a competitive advantage.
The North American pet nutrition and health product market exhibits a consolidated structure dominated by large multinational corporations with diverse pet care portfolios. These major players leverage their established brand recognition, extensive distribution networks, and significant research capabilities to maintain their market positions. The presence of global conglomerates is particularly strong in this space, as they can integrate pet food nutraceuticals into their broader pet care offerings and benefit from economies of scale in production and marketing.
Success in the North America pet food nutraceuticals market increasingly depends on developing differentiated products that address specific health concerns while maintaining strong scientific evidence to support efficacy claims. Companies need to invest in building relationships with veterinarians and pet specialty retailers while expanding their e-commerce presence to capture the growing online sales channel. Establishing robust supply chains for premium ingredients and maintaining consistent product quality are becoming crucial factors for sustained growth. The ability to adapt to changing regulatory requirements and maintain compliance with quality standards will be essential for long-term success.
North America Pet Food Nutraceuticals Industry Leaders
Mars, Incorporated
Vetoquinol
Nestle (Purina)
ADM
Wellness Pet Company, Inc. (Clearlake Capital Group, L.P.)
- *Disclaimer: Major Players sorted in no particular order

Recent Industry Developments
- February 2023: ADM opened its new probiotics and postbiotics production facility in Spain. The facility will supply these supplements to North America, EMEA, and Asia-Pacific.
- January 2023: Wellness Pet Company Inc., a subsidiary of Clearlake Capital Group LP, launched a fresh range of supplements designed for dogs, which prioritize providing daily health advantages to promote overall well-being. These products help meet the proactive approach of pet parents for long-term health and well-being.
- January 2023: Mars Incorporated partnered with the Broad Institute to create an open-access database of dog and cat genomes to advance preventive pet care. It is aimed at developing more effective precision medicines and diets that lead to scientific breakthroughs for the future of pet health.


North America Pet Food Nutraceuticals Market Report Scope
Milk Bioactives, Omega-3 Fatty Acids, Probiotics, Proteins and Peptides, Vitamins and Minerals are covered as segments by Sub Product. Cats, Dogs are covered as segments by Pets. Convenience Stores, Online Channel, Specialty Stores, Supermarkets/Hypermarkets are covered as segments by Distribution Channel. Canada, Mexico, United States are covered as segments by Country.Sub Product
| Milk Bioactives |
| Omega-3 Fatty Acids |
| Probiotics |
| Proteins and Peptides |
| Vitamins and Minerals |
| Other Nutraceuticals |
Pets
| Dogs |
| Cats |
| Other Pets |
Distribution Channel
| Convenience Stores |
| Online Channel |
| Specialty Stores |
| Supermarkets/Hypermarkets |
| Other Channels |
Geography
| United States |
| Canada |
| Mexico |
| Rest of North America |
| Sub Product | Milk Bioactives |
| Omega-3 Fatty Acids | |
| Probiotics | |
| Proteins and Peptides | |
| Vitamins and Minerals | |
| Other Nutraceuticals | |
| Pets | Dogs |
| Cats | |
| Other Pets | |
| Distribution Channel | Convenience Stores |
| Online Channel | |
| Specialty Stores | |
| Supermarkets/Hypermarkets | |
| Other Channels | |
| Geography | United States |
| Canada | |
| Mexico | |
| Rest of North America |


Market Definition
- FUNCTIONS - Pet foods are usually intended to provide complete and balanced nutrition to the pet but are primarily used as functional products. The scope includes the food and supplements consumed by pets including veterinary diets. Supplements/nutraceuticals that are directly supplied to pets are considered within the scope.
- RESELLERS - Companies engaged in reselling of pet food without value addition have been excluded from the market scope, in order to avoid double counting.
- END CONSUMERS - Pet owners are considered to be the end-consumers in the market studied.
- DISTRIBUTION CHANNELS - Supermarkets/hypermarkets, specialty stores, convenience stores, online channels and other channels are considered within the scope. The stores which are exclusively providing pet related basic and custom products are considered within the scope of specialty stores.
| Keyword | Definition |
|---|---|
| Pet Food | The scope of pet food includes the food that is eatable by pets including food, treats, veterinary diets, and nutraceuticals/supplements. |
| Food | Food is animal feed intended for consumption by pets. It is formulated to provide essential nutrients and meet the dietary needs of various types of pets, including dogs, cats, and other animals. These are generally segmented into dry and wet pet foods. |
| Dry Pet Food | Dry pet foods may be extruded/baked (kibbles) or flaked. They have a lower moisture content, typically around 12-20%. |
| Wet Pet Food | Wet pet food, also known as canned pet food or moist pet food, generally has a higher moisture content compared to dry pet food, often ranging from 70-80%. |
| Kibbles | Kibbles are dry, processed pet food in small, bite-sized pieces or pellets. They are specifically formulated to provide balanced nutrition for various domestic animals, such as dogs, cats, and other animals. |
| Treats | Pet Treats are special food items or rewards given to pets, to show affection, and encourage good behavior. They are especially used during training. Pet treats are made from various combinations of meat or meat-derived materials with other ingredients. |
| Dental Treats | Pet dental treats are specialized treats that are formulated to promote good oral hygiene in pets. |
| Crunchy Treats | It is a type of pet treat that has a firm and crispy texture which can be a good source of nutrition for pets. |
| Soft and chewy treats | Soft and Chewy pet treats are a type of pet food product that is formulated to be easy to chewy and digest. They are usually made from soft and pliable ingredients, such as meat, poultry, or vegetables, that have been blended and formed into bite-sized pieces or strips. |
| Freeze-dried & Jerky Treats | Freeze-dried and jerky treats are snacks given to pets, that are prepared through a special preservation process, without damaging the nutritional content, resulting in long-lasting, nutrient-rich treats. |
| Urinary Tract Disease Diets | These are commercial diets that are specifically formulated to promote urinary health and reduce the risk of urinary tract infections and other urinary problems. |
| Renal Diets | These are specialized pet foods formulated to support the health of pets with kidney disease or renal insufficiency. |
| Digestive Sensitivity Diets | Digestive-sensitive diets are specially formulated to meet the nutritional needs of pets with digestive issues such as food intolerances, allergies, and sensitivities. These diets are designed to be easily digestible and to reduce the symptoms of digestive problems in pets. |
| Oral Care Diets | Oral care diets for pets are specially formulated diets produced to promote oral health and hygiene in pets. |
| Grain-Free Pet Food | Pet food that does not contain common grains like wheat, corn, or soy. Grain-free diets are often preferred by pet owners seeking alternative options or if their pets have specific dietary sensitivities. |
| Premium Pet Food | High-quality pet food formulated with superior ingredients often offers additional nutritional benefits compared to standard pet food. |
| Natural Pet Food | Pet food made from natural ingredients, with minimal processing and without artificial preservatives. |
| Organic Pet Food | Pet food is produced using organic ingredients, free from synthetic pesticides, hormones, and genetically modified organisms (GMOs). |
| Extrusion | A manufacturing process used to produce dry pet food, where ingredients are cooked, mixed, and shaped under high pressure and temperature. |
| Other Pets | Other pets include birds, fish, rabbits, hamsters, ferrets, and reptiles. |
| Palatability | The taste, texture, and aroma of pet food influence its appeal and acceptance by pets. |
| Complete and Balanced Pet Food | Pet food that provides all essential nutrients in appropriate proportions to meet the nutritional needs of pets without additional supplementation. |
| Preservatives | These are the substances that are added to pet food to extend its shelf life and prevent spoilage. |
| Nutraceuticals | Food products that offer health benefits beyond basic nutrition, often contain bioactive compounds with potential therapeutic effects. |
| Probiotics | Live beneficial bacteria that promote a healthy balance of gut flora, supporting digestive health and immune function in pets. |
| Antioxidants | Compounds that help neutralize harmful free radicals in the body, promoting cellular health and supporting the immune system in pets. |
| Shelf-Life | The duration of which pet food remains safe and nutritionally viable for consumption after its production date. |
| Prescription diet | Specialized pet food formulated to address specific medical conditions under veterinary supervision. |
| Allergen | A substance that can cause allergic reactions in some pets, leading to food allergies or sensitivities. |
| Canned food | Wet pet food that is packed in cans and contains higher moisture content than dry food. |
| Limited ingredient diet (LID) | Pet food formulated with a reduced number of ingredients to minimize potential allergens. |
| Guaranteed Analysis | The minimum or maximum levels of certain nutrients present in pet food. |
| Weight management | Pet food designed to help pets maintain a healthy weight or support weight loss efforts. |
| Other Nutraceuticals | It includes prebiotics, antioxidants, digestive fiber, enzymes, essential oils and herbs. |
| Other Veterinary Diets | It includes weight management diets, skin and coat health, cardiac care, and joint care. |
| Other Treats | It includes rawhides, mineral blocks, lickables, and catnips. |
| Other Dry Foods | It includes cereal flakes, mixers, meal toppers, freeze-dried foods, and air-dried foods. |
| Other Animals | It includes birds, fish, reptiles, and small animals (rabbits, ferrets, hamsters). |
| Other Distribution Channels | It includes veterinary clinics, local unregulated stores, and feed and farm stores. |
| Proteins and Peptides | Proteins are large molecules composed of basic units called amino acids which help in the growth and development of pets. Peptides are the short string of 2 to 50 amino acids. |
| Omega-3 fatty acids | Omega-3 fatty acids are essential polyunsaturated fats that play a crucial role in the overall health and well-being of Pets |
| Vitamins | Vitamins are the essential organic compounds that are essential for vital physiological functioning. |
| Minerals | Minerals are naturally occurring inorganic substances that are essential for various physiological functions in pets. |
| CKD | Chronic Kidney Disease |
| DHA | Docosahexaenoic Acid |
| EPA | Eicosapentaenoic Acid |
| ALA | Alpha-linolenic Acid |
| BHA | Butylated Hydroxyanisol |
| BHT | Butylated Hydroxytoluene |
| FLUTD | Feline Lower Urinary Tract Disease |


Research Methodology
Mordor Intelligence follows a four-step methodology in all our reports.
- Step-1: IDENTIFY KEY VARIABLES: In order to build a robust forecasting methodology, the variables and factors identified in Step-1 are tested against available historical market numbers. Through an iterative process, the variables required for market forecast are set and the model is built on the basis of these variables.
- Step-2: Build a Market Model: Market-size estimations for the forecast years are in nominal terms. Inflation is not a part of the pricing, and the average selling price (ASP) is kept constant throughout the forecast period.
- Step-3: Validate and Finalize: In this important step, all market numbers, variables and analyst calls are validated through an extensive network of primary research experts from the market studied. The respondents are selected across levels and functions to generate a holistic picture of the market studied.
- Step-4: Research Outputs: Syndicated Reports, Custom Consulting Assignments, Databases & Subscription Platforms


