North America Pet Diet Market Size and Share
Market Overview
| Study Period | 2018 - 2031 |
|---|---|
| Forecast Data Period | 2026 - 2031 |
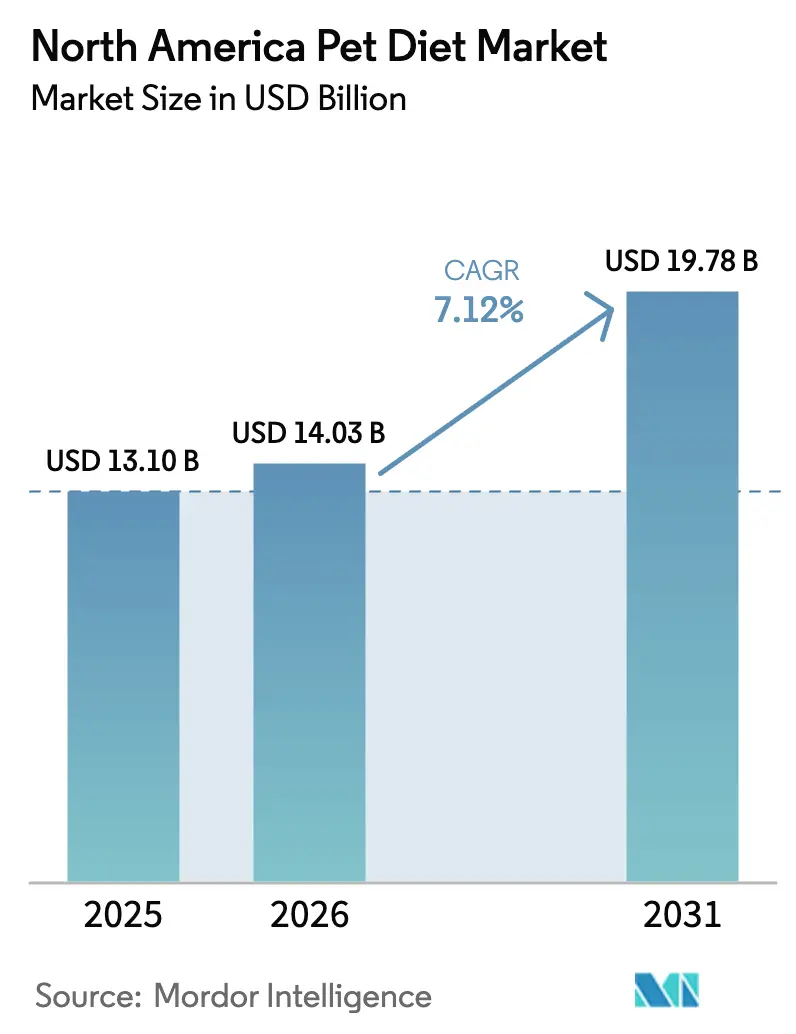
| Base Year Market Size (2025) | USD 13.10 Billion |
| Market Size (2026) | USD 14.03 Billion |
| Market Size (2031) | USD 19.78 Billion |
| Growth Rate (2026 - 2031) | 7.12% CAGR |
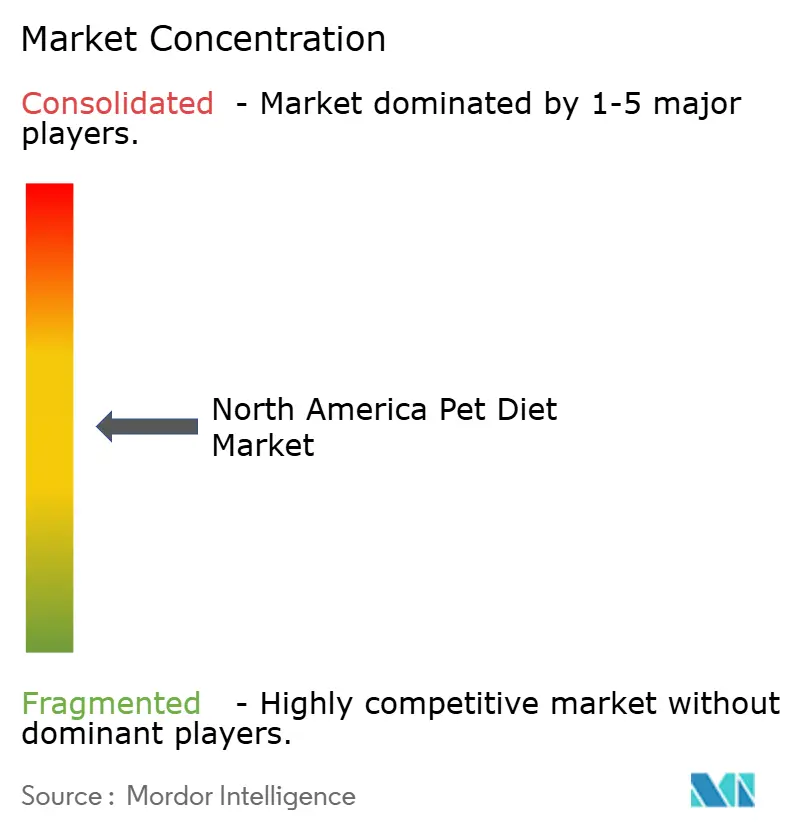
| Market Concentration | Medium |
Major Players *Disclaimer: Major Players sorted in no particular order Image © Mordor Intelligence. Reuse requires attribution under CC BY 4.0. | |
North America Pet Diet Market Analysis by Mordor Intelligence
The North America pet diet market size was valued at USD 13.10 billion in 2025 and estimated to grow from USD 14.03 billion in 2026 to reach USD 19.78 billion by 2031, at a CAGR of 7.12% during the forecast period (2026-2031). Demand rises because pet owners treat dogs and cats like family, chronic diseases are prevalent, and an increasing number of clinics stock therapeutic nutrition. Prescription and functional diets continue to gain popularity because shoppers are willing to pay for the health benefits they offer, even as prices rise. Growth also benefits from fast online buying, new AI-based personalization, and wider pet insurance reimbursement, which makes specialized diets more affordable. Market concentration remains moderate consolidated, creating opportunities for specialized entrants targeting underserved therapeutic categories or innovative delivery mechanisms. Competitive dynamics intensify as traditional pet food giants face pressure from direct-to-consumer brands that leverage AI-powered nutrition personalization and subscription models, thereby bypassing veterinary distribution channels.
Key Report Takeaways
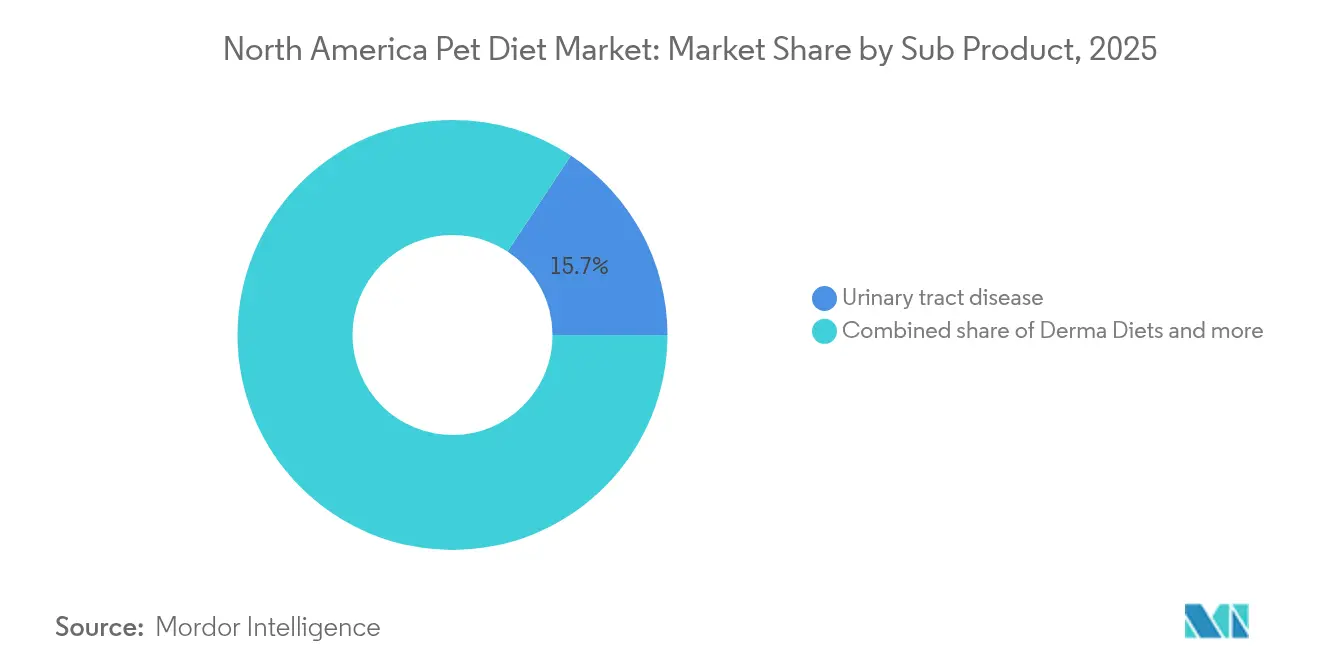
- By diet type, urinary tract formulations led with a 15.72% share of the North American pet diet market in 2025, while derma diets posted the fastest growth rate of 8.21% CAGR through 2031.
- By pet type, dogs accounted for 55.84% of 2025 revenue, and dogs are projected to expand at a 8.74% CAGR between 2026 and 2031.
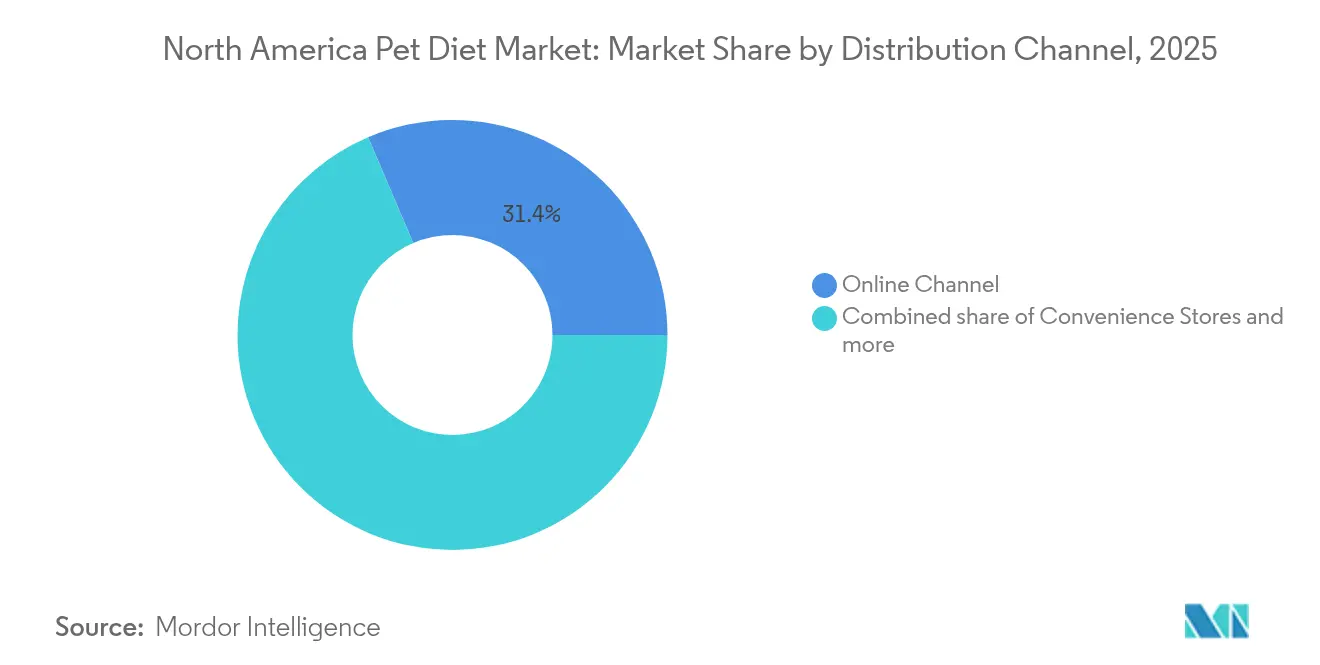
- By distribution channel, the online channel accounted for 31.42% of the revenue in 2025, while online platforms are projected to advance at a 10.78% CAGR through 2031.
- By geography, the United States dominated with 86.95% revenue in 2025, and the United States is set to grow at an 7.55% CAGR to 2031.
Note: Market size and forecast figures in this report are generated using Mordor Intelligence’s proprietary estimation framework, updated with the latest available data and insights as of 2026.
North America Pet Diet Market Trends and Insights
Drivers Impact Analysis*
| Driver | (~) % Impact on CAGR Forecast | Geographic Relevance | Impact Timeline |
|---|---|---|---|
| Pet humanization and premiumization surge | +2.1% | United States and Canada | Long term (≥ 4 years) |
| Rising veterinarian adoption of prescription diets | +1.8% | United States primary, Canada secondary | Medium term (2-4 years) |
| High incidence of chronic pet diseases (obesity, renal, urinary) | +1.5% | North America-wide | Long term (≥ 4 years) |
| Rapid e-commerce and subscription growth | +1.3% | United States and Canada | Short term (≤ 2 years) |
| AI-enabled microbiome-based personalized nutrition | +0.8% | United States primary | Medium term (2-4 years) |
| Pet-insurance reimbursement expansion to therapeutic diets | +0.5% | The United States concentrated | Long term (≥ 4 years) |
| Source: Mordor Intelligence | |||


Pet Humanization and Premiumization Surge
Pet owners are increasingly viewing companion animals as family members, driving their willingness to invest in premium therapeutic diets that mirror human health trends. This behavioral shift is evident in spending patterns, where 68% of pet owners prioritize nutritional quality over price considerations when addressing health conditions [1]Source: American Pet Products Association, “2024 Pet Ownership Statistics,” americanpetproducts.org . The humanization trend particularly benefits functional ingredients, such as probiotics, omega-3 fatty acids, and antioxidants, which pet owners recognize from their own supplement regimens. Veterinary nutritionists report increased client receptiveness to prescription diet recommendations when positioned as preventive healthcare rather than reactive treatment. The trend accelerates in urban markets where pet ownership often substitutes for traditional family structures, generating higher per-pet expenditure patterns that support market expansion.
Rising Veterinarian Adoption of Prescription Diets
Veterinary practices increasingly integrate therapeutic nutrition into treatment protocols, with prescription diet recommendations rising 23% annually across North American clinics. This adoption pattern reflects improvements in veterinary education and pharmaceutical company investments in clinical evidence supporting dietary interventions for chronic conditions. Veterinarians now view therapeutic diets as essential tools for managing diabetes, kidney disease, and gastrointestinal disorders, creating predictable revenue streams that complement traditional medical treatments. This professional endorsement effect drives market growth by legitimizing premium pricing and reducing consumer price sensitivity for medically necessary nutrition interventions.
High Incidence of Chronic Pet diseases
Chronic disease prevalence in companion animals continues rising, with obesity affecting 56% of dogs and 60% of cats in North America, while kidney disease impacts 1 in 3 cats over age 10. These epidemiological trends create a sustained demand for specialized therapeutic diets that address weight management, renal support, and urinary tract health. The obesity epidemic particularly drives market growth as overweight pets require long-term dietary management rather than temporary interventions. Kidney disease progression in aging pet populations generates predictable demand for phosphorus-restricted, high-quality protein formulations that slow disease advancement. Veterinary diagnostics improvements enable earlier disease detection, expanding the addressable market for preventive dietary interventions before clinical symptoms emerge.
Rapid E-commerce and Subscription Growth
Online pet food sales accounted for major percentage of the total market share in 2024, with subscription services experiencing a 25% annual growth rate as convenience and cost savings drive adoption. This channel expansion particularly benefits therapeutic diet categories, where repeat purchases create predictable revenue streams and opportunities for optimizing customer lifetime value. Subscription models reduce acquisition costs while improving inventory management for specialized formulations with limited shelf life. Direct-to-consumer brands leverage subscription data to personalize nutrition recommendations and adjust formulations based on pet health outcomes. The channel shift challenges traditional veterinary distribution exclusivity, as online platforms provide access to prescription-equivalent formulations without clinic visits.
Restraints Impact Analysis*
| Restraint | (~) % Impact on CAGR Forecast | Geographic Relevance | Impact Timeline |
|---|---|---|---|
| High price gap versus conventional pet food | -1.2% | United States and Canada | Short term (≤ 2 years) |
| Ingredient-cost volatility and supply risk | -0.9% | North America-wide | Medium term (2-4 years) |
| Regulatory reform delays | -0.7% | United States primary | Long term (≥ 4 years) |
| Accelerating private-label functional diet competition | -0.6% | United States and Canada | Medium term (2-4 years) |
| Source: Mordor Intelligence | |||
High Price Gap Versus Conventional Pet Food
Therapeutic diets command price premiums of 300-400% over conventional pet food, creating adoption barriers for price-sensitive consumers despite their health benefits [2]Source: Bureau of Labor Statistics, “Consumer Price Index 2024,” bls.gov. This pricing differential particularly impacts multi-pet households, where therapeutic diet costs can exceed USD 200 per month per animal. Economic pressures compel pet owners to choose between premium therapeutic formulations and budget alternatives that may not effectively address underlying health conditions. The price gap widens during inflationary periods as specialty ingredients and manufacturing costs rise faster than conventional pet food production expenses. Manufacturers face margin pressure when attempting to reduce pricing, as therapeutic diet formulations require expensive functional ingredients and specialized manufacturing processes that limit cost reduction opportunities.
Ingredient Cost Volatility and Supply Risk
Raw material costs for therapeutic diet ingredients experienced 18% inflation in 2024, with protein sources, functional additives, and specialized vitamins facing supply chain disruptions. This volatility particularly affects specialized ingredients, such as hydrolyzed proteins, novel carbohydrates, and pharmaceutical-grade supplements, which have limited supplier bases. Supply chain concentration creates vulnerability when single-source ingredients are affected by production disruptions or quality issues that require reformulation. The constraint intensifies as demand growth outpaces ingredient supply capacity, creating bottlenecks that could limit market expansion despite strong consumer demand for therapeutic nutrition solutions.
*Our forecasts treat driver/restraint impacts as directional, not additive. The impact forecasts reflect baseline growth, mix effects, and variable interactions.
Segment Analysis
By Diet Type: Urinary Health Drives Current Leadership
Urinary tract diets commanded a 15.72% market share in 2025, reflecting the high prevalence of feline lower urinary tract disease and canine urinary stone formation, which affects approximately 3% of cats annually. Weight management diets are experiencing significant growth potential as pet obesity rates continue to climb, while gastrointestinal formulations address the 10-15% of pets that experience chronic digestive issues. Renal support diets serve the critical need for kidney disease management in aging pet populations, particularly cats, where chronic kidney disease affects one-third of animals over 10 years old.
Dermacare diets represent the fastest-growing segment, with an 8.21% CAGR through 2031, driven by increasing environmental allergen exposure and food sensitivity diagnoses. Regulatory frameworks under FDA (Food and Drug Administration) and AAFCO (Association of American Feed Control Officials) guidance ensure the safety and efficacy standards of therapeutic diets, although label modernization delays create uncertainty for new product introductions. The segment's growth trajectory reflects pet owners' increasing willingness to invest in specialized nutrition when veterinary professionals recommend dietary intervention as primary or adjunctive therapy.


By Pet Type: Canine Dominance with Feline Specialization
Dogs captured 55.84% of the market share in 2025, benefiting from higher average body weights that translate to larger portion sizes and greater absolute spending per animal. Canine therapeutic diets excel particularly in weight management and joint health categories, where size-related health issues create a sustained demand for specialized nutrition. The dog segment also benefits from the owner's willingness to invest in premium products for larger, more visible companion animals that often serve as family centerpieces.
The dog segment is projected to grow at a 8.74% CAGR through 2031, further reinforcing its dominance as dog owners become increasingly aware of the importance of specialized nutrition for their pets' health and wellness. Dogs are particularly prone to conditions such as digestive sensitivity, urinary tract diseases, and joint issues, driving the demand for specialized veterinary diet solutions. Additionally, the growing trend of pet humanization and the willingness of dog owners to invest in premium and specialized nutrition solutions have contributed to the segment's market leadership.
By Distribution Channel: Digital Transformation Accelerates
Online channels maintained a 31.42% market share in 2025, leveraging supremacy can be attributed to several key factors, including the cost-effectiveness of direct-to-consumer sales without intermediaries, the convenience of home delivery, and the extensive variety of products available through e-commerce platforms. Major players, such as Amazon, Chewy, and Petco, have strengthened their online presence by offering a comprehensive selection of specialty pet food and functional pet food from various brands. The COVID-19 pandemic has accelerated the shift towards online purchasing, fundamentally changing consumer buying behavior.
Online channels demonstrate the strongest growth trajectory at 10.78% CAGR through 2031, fundamentally reshaping how therapeutic diets reach consumers beyond traditional veterinary gatekeepers. This channel shift reflects consumer preference for convenience and competitive pricing, while subscription models create predictable revenue streams for direct-to-consumer brands. This platforms provide detailed product information, customer reviews, and competitive pricing, making it easier for pet owners to make informed decisions about their pets' dietary needs.
Geography Analysis
The United States dominates the market with an 86.95% market share in 2025, with a CAGR of 7.55% through 2031, benefiting from advanced veterinary infrastructure, higher per-pet spending patterns, and established adoption of therapeutic diets among both professionals and consumers. The United States market leadership reflects mature veterinary education systems that emphasize nutritional intervention, while pet insurance penetration creates reimbursement opportunities that reduce cost barriers for therapeutic diet adoption. The market benefits from FDA regulatory frameworks that provide clear guidance for therapeutic diet manufacturers, recent enforcement policy changes create uncertainty regarding prescription requirements and distribution channel restrictions.
Canada exhibits significant growth, driven by regulatory harmonization with United States standards, which reduces market entry barriers for therapeutic diet manufacturers. Canadian Food Inspection Agency alignment with FDA labeling requirements enables cross-border product registration efficiencies, while currency exchange rates create pricing advantages for United States-manufactured therapeutic diets. Canada's smaller market size limits investment in country-specific product development, creating opportunities for manufacturers to adapt United States formulations to Canadian regulatory requirements and consumer preferences.
Mexico's pet veterinary diets market demonstrates strong potential, supported by the country's growing middle class and increasing pet ownership rates. The market is characterized by rising awareness about pet health and pet nutrition, particularly in urban areas where access to veterinary services is more prevalent. Mexican pet owners are increasingly recognizing the importance of specialized nutrition in managing various pet health conditions, leading to higher adoption of veterinary diets. The country's veterinary professionals play a crucial role in educating pet owners about the benefits of therapeutic nutrition, contributing to market growth.
Competitive Landscape
The North American pet diet market exhibits moderate consolidation, with multinational conglomerates holding dominant positions through their specialized pet care divisions. These major players, Mars, Incorporated, Nestle (Purina), Schell & Kampeter, Inc. (Diamond Pet Foods), Vetoquinol, and ADM, are leveraging their extensive research capabilities, established distribution networks, and strong brand recognition to maintain their market leadership. The market structure is characterized by a mix of global animal health companies and specialized pet food manufacturers, with the top players commanding significant market share through their comprehensive product portfolios and strategic presence across multiple distribution channels.
The market has witnessed several strategic acquisitions and partnerships aimed at expanding product offerings and geographical reach. Large companies are actively acquiring smaller, innovative players to enhance their technological capabilities and expand their product portfolios. This consolidation trend is particularly evident in the premium pet food segment of veterinary diets, where companies are seeking to strengthen their position in specialized nutrition solutions. The market also sees collaboration between manufacturers and veterinary service providers, creating integrated solutions for pet health management.
Success in the North American pet diet market increasingly depends on companies' ability to develop specialized nutrition solutions backed by scientific research and clinical evidence. Market players need to focus on building strong relationships with veterinarians and pet care professionals, as they significantly influence pet owners' purchasing decisions. Companies must also invest in digital capabilities and omnichannel distribution strategies to ensure product accessibility across various platforms. Additionally, manufacturers need to maintain high-quality standards and obtain necessary certifications while developing products that address emerging health concerns in pets.
North America Pet Diet Industry Leaders
Mars, Incorporated
Nestle (Purina)
Schell & Kampeter, Inc. (Diamond Pet Foods)
Vetoquinol
ADM
- *Disclaimer: Major Players sorted in no particular order

Recent Industry Developments
- March 2023: Colgate-Palmolive Company's pet care subsidiary Hill’s Pet Nutrition launched its new line of prescription diets to support pets diagnosed with cancer. This prescription line, Diet ONC Care, offers complete and balanced formulas in both dry and wet forms for cats and dogs.
- January 2023: Purina Pro Plan Veterinary Diets, a brand of Nestlé Purina PetCare, partnered with the American Veterinary Medical Foundation (AVMF) to help expand the AVMF Reaching Every Animal with Charitable Care (REACH) program. This program offers grants to veterinarians who provide immediate treatment for pets whose owners are experiencing financial hardship. This strategy helps increase the sales of veterinary diets.


North America Pet Diet Market Report Scope
Diabetes, Digestive Sensitivity, Oral Care Diets, Renal, Urinary tract disease are covered as segments by Sub Product. Cats, Dogs are covered as segments by Pets. Convenience Stores, Online Channel, Specialty Stores, Supermarkets/Hypermarkets are covered as segments by Distribution Channel. Canada, Mexico, United States are covered as segments by Country.| Urinary tract disease |
| Diabetes |
| Renal |
| Digestive Sensitivity |
| Oral Care Diets |
| Other Veterinary Diets |
| Derma Diets |
| Obesity Diets |
| Dogs |
| Cats |
| Other Pets |
| Convenience Stores |
| Online Channel |
| Specialty Stores |
| Supermarkets/Hypermarkets |
| Other Channels |
| United States |
| Canada |
| Mexico |
| Rest of North America |
| Sub Product | Urinary tract disease |
| Diabetes | |
| Renal | |
| Digestive Sensitivity | |
| Oral Care Diets | |
| Other Veterinary Diets | |
| Derma Diets | |
| Obesity Diets | |
| Pets | Dogs |
| Cats | |
| Other Pets | |
| Distribution Channel | Convenience Stores |
| Online Channel | |
| Specialty Stores | |
| Supermarkets/Hypermarkets | |
| Other Channels | |
| Geography | United States |
| Canada | |
| Mexico | |
| Rest of North America |


Market Definition
- FUNCTIONS - Pet foods are usually intended to provide complete and balanced nutrition to the pet but are primarily used as functional products. The scope includes the food and supplements consumed by pets including veterinary diets. Supplements/nutraceuticals that are directly supplied to pets are considered within the scope.
- RESELLERS - Companies engaged in reselling of pet food without value addition have been excluded from the market scope, in order to avoid double counting.
- END CONSUMERS - Pet owners are considered to be the end-consumers in the market studied.
- DISTRIBUTION CHANNELS - Supermarkets/hypermarkets, specialty stores, convenience stores, online channels and other channels are considered within the scope. The stores which are exclusively providing pet related basic and custom products are considered within the scope of specialty stores.
| Keyword | Definition |
|---|---|
| Pet Food | The scope of pet food includes the food that is eatable by pets including food, treats, veterinary diets, and nutraceuticals/supplements. |
| Food | Food is animal feed intended for consumption by pets. It is formulated to provide essential nutrients and meet the dietary needs of various types of pets, including dogs, cats, and other animals. These are generally segmented into dry and wet pet foods. |
| Dry Pet Food | Dry pet foods may be extruded/baked (kibbles) or flaked. They have a lower moisture content, typically around 12-20%. |
| Wet Pet Food | Wet pet food, also known as canned pet food or moist pet food, generally has a higher moisture content compared to dry pet food, often ranging from 70-80%. |
| Kibbles | Kibbles are dry, processed pet food in small, bite-sized pieces or pellets. They are specifically formulated to provide balanced nutrition for various domestic animals, such as dogs, cats, and other animals. |
| Treats | Pet Treats are special food items or rewards given to pets, to show affection, and encourage good behavior. They are especially used during training. Pet treats are made from various combinations of meat or meat-derived materials with other ingredients. |
| Dental Treats | Pet dental treats are specialized treats that are formulated to promote good oral hygiene in pets. |
| Crunchy Treats | It is a type of pet treat that has a firm and crispy texture which can be a good source of nutrition for pets. |
| Soft and chewy treats | Soft and Chewy pet treats are a type of pet food product that is formulated to be easy to chewy and digest. They are usually made from soft and pliable ingredients, such as meat, poultry, or vegetables, that have been blended and formed into bite-sized pieces or strips. |
| Freeze-dried & Jerky Treats | Freeze-dried and jerky treats are snacks given to pets, that are prepared through a special preservation process, without damaging the nutritional content, resulting in long-lasting, nutrient-rich treats. |
| Urinary Tract Disease Diets | These are commercial diets that are specifically formulated to promote urinary health and reduce the risk of urinary tract infections and other urinary problems. |
| Renal Diets | These are specialized pet foods formulated to support the health of pets with kidney disease or renal insufficiency. |
| Digestive Sensitivity Diets | Digestive-sensitive diets are specially formulated to meet the nutritional needs of pets with digestive issues such as food intolerances, allergies, and sensitivities. These diets are designed to be easily digestible and to reduce the symptoms of digestive problems in pets. |
| Oral Care Diets | Oral care diets for pets are specially formulated diets produced to promote oral health and hygiene in pets. |
| Grain-Free Pet Food | Pet food that does not contain common grains like wheat, corn, or soy. Grain-free diets are often preferred by pet owners seeking alternative options or if their pets have specific dietary sensitivities. |
| Premium Pet Food | High-quality pet food formulated with superior ingredients often offers additional nutritional benefits compared to standard pet food. |
| Natural Pet Food | Pet food made from natural ingredients, with minimal processing and without artificial preservatives. |
| Organic Pet Food | Pet food is produced using organic ingredients, free from synthetic pesticides, hormones, and genetically modified organisms (GMOs). |
| Extrusion | A manufacturing process used to produce dry pet food, where ingredients are cooked, mixed, and shaped under high pressure and temperature. |
| Other Pets | Other pets include birds, fish, rabbits, hamsters, ferrets, and reptiles. |
| Palatability | The taste, texture, and aroma of pet food influence its appeal and acceptance by pets. |
| Complete and Balanced Pet Food | Pet food that provides all essential nutrients in appropriate proportions to meet the nutritional needs of pets without additional supplementation. |
| Preservatives | These are the substances that are added to pet food to extend its shelf life and prevent spoilage. |
| Nutraceuticals | Food products that offer health benefits beyond basic nutrition, often contain bioactive compounds with potential therapeutic effects. |
| Probiotics | Live beneficial bacteria that promote a healthy balance of gut flora, supporting digestive health and immune function in pets. |
| Antioxidants | Compounds that help neutralize harmful free radicals in the body, promoting cellular health and supporting the immune system in pets. |
| Shelf-Life | The duration of which pet food remains safe and nutritionally viable for consumption after its production date. |
| Prescription diet | Specialized pet food formulated to address specific medical conditions under veterinary supervision. |
| Allergen | A substance that can cause allergic reactions in some pets, leading to food allergies or sensitivities. |
| Canned food | Wet pet food that is packed in cans and contains higher moisture content than dry food. |
| Limited ingredient diet (LID) | Pet food formulated with a reduced number of ingredients to minimize potential allergens. |
| Guaranteed Analysis | The minimum or maximum levels of certain nutrients present in pet food. |
| Weight management | Pet food designed to help pets maintain a healthy weight or support weight loss efforts. |
| Other Nutraceuticals | It includes prebiotics, antioxidants, digestive fiber, enzymes, essential oils and herbs. |
| Other Veterinary Diets | It includes weight management diets, skin and coat health, cardiac care, and joint care. |
| Other Treats | It includes rawhides, mineral blocks, lickables, and catnips. |
| Other Dry Foods | It includes cereal flakes, mixers, meal toppers, freeze-dried foods, and air-dried foods. |
| Other Animals | It includes birds, fish, reptiles, and small animals (rabbits, ferrets, hamsters). |
| Other Distribution Channels | It includes veterinary clinics, local unregulated stores, and feed and farm stores. |
| Proteins and Peptides | Proteins are large molecules composed of basic units called amino acids which help in the growth and development of pets. Peptides are the short string of 2 to 50 amino acids. |
| Omega-3 fatty acids | Omega-3 fatty acids are essential polyunsaturated fats that play a crucial role in the overall health and well-being of Pets |
| Vitamins | Vitamins are the essential organic compounds that are essential for vital physiological functioning. |
| Minerals | Minerals are naturally occurring inorganic substances that are essential for various physiological functions in pets. |
| CKD | Chronic Kidney Disease |
| DHA | Docosahexaenoic Acid |
| EPA | Eicosapentaenoic Acid |
| ALA | Alpha-linolenic Acid |
| BHA | Butylated Hydroxyanisol |
| BHT | Butylated Hydroxytoluene |
| FLUTD | Feline Lower Urinary Tract Disease |


Research Methodology
Mordor Intelligence follows a four-step methodology in all our reports.
- Step-1: IDENTIFY KEY VARIABLES: In order to build a robust forecasting methodology, the variables and factors identified in Step-1 are tested against available historical market numbers. Through an iterative process, the variables required for market forecast are set and the model is built on the basis of these variables.
- Step-2: Build a Market Model: Market-size estimations for the forecast years are in nominal terms. Inflation is not a part of the pricing, and the average selling price (ASP) is kept constant throughout the forecast period.
- Step-3: Validate and Finalize: In this important step, all market numbers, variables and analyst calls are validated through an extensive network of primary research experts from the market studied. The respondents are selected across levels and functions to generate a holistic picture of the market studied.
- Step-4: Research Outputs: Syndicated Reports, Custom Consulting Assignments, Databases & Subscription Platforms


