Market Overview
| Study Period | 2019 - 2031 |
|---|---|
| Forecast Data Period | 2026 - 2031 |
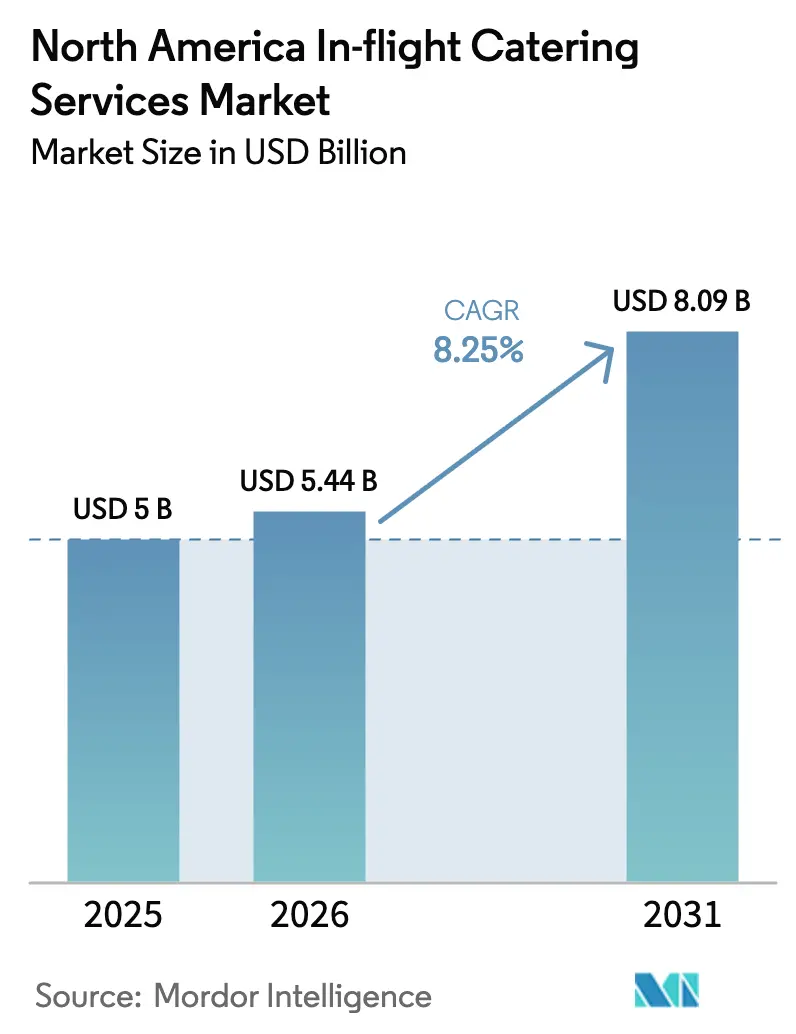
| Base Year Market Size (2025) | USD 5 Billion |
| Market Size (2026) | USD 5.44 Billion |
| Market Size (2031) | USD 8.09 Billion |
| Growth Rate (2026 - 2031) | 8.25% CAGR |
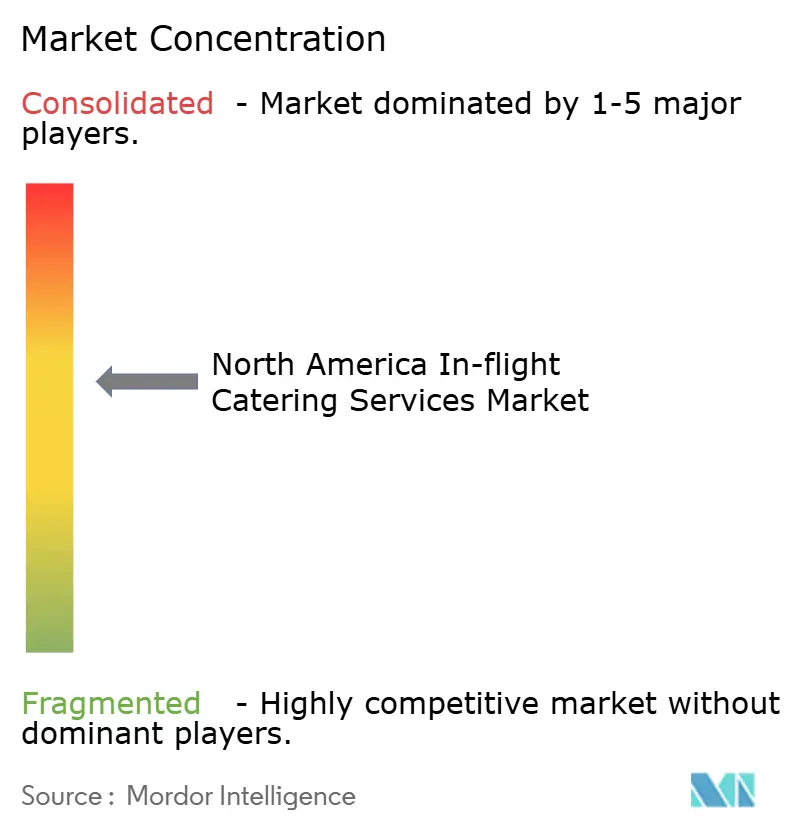
| Market Concentration | Medium |
Major Players *Disclaimer: Major Players sorted in no particular order Image © Mordor Intelligence. Reuse requires attribution under CC BY 4.0. | |
North America In-flight Catering Services Market Analysis by Mordor Intelligence
The North America in-flight catering services market size is expected to grow from USD 5.00 billion in 2025 to USD 5.44 billion in 2026 and is forecasted to reach USD 8.09 billion by 2031 at 8.25% CAGR over 2026-2031. Airlines are channeling that growth toward loyalty-driven upgrades, retail-on-board programs, and data-powered menu optimization that push revenue per passenger higher even as load factors fluctuate. Premium long-haul traffic is growing faster than overall seat capacity, prompting airlines to collaborate with chefs and introduce more elaborate, multi-course menus in their premium cabins. Although premium cabins command significantly higher fares than economy, improved catering serves as a supplementary differentiator within the broader fare premium. Low-cost and hybrid carriers are using pre-order systems to convert impulse food buys into predictable ancillary income. Major hubs are witnessing airlines and caterers testing AI-driven food analysis tools to better understand and mitigate cabin waste. Data from IATA reveals that each passenger on an average flight contributes to about 1.5 kilograms of cabin waste, with nearly 20% stemming from uneaten food and drinks. This underscores the opportunity for data-centric solutions. Meanwhile, new traceability mandates set for 2026 are complicating compliance, giving a competitive edge to larger, digitally savvy catering firms. Inflation in food, labor, and utilities remains a near-term margin headwind; however, integrated players are offsetting cost pressure through SKU standardization, vertical procurement, and sustainable packaging that reduces galley weight.
Key Report Takeaways
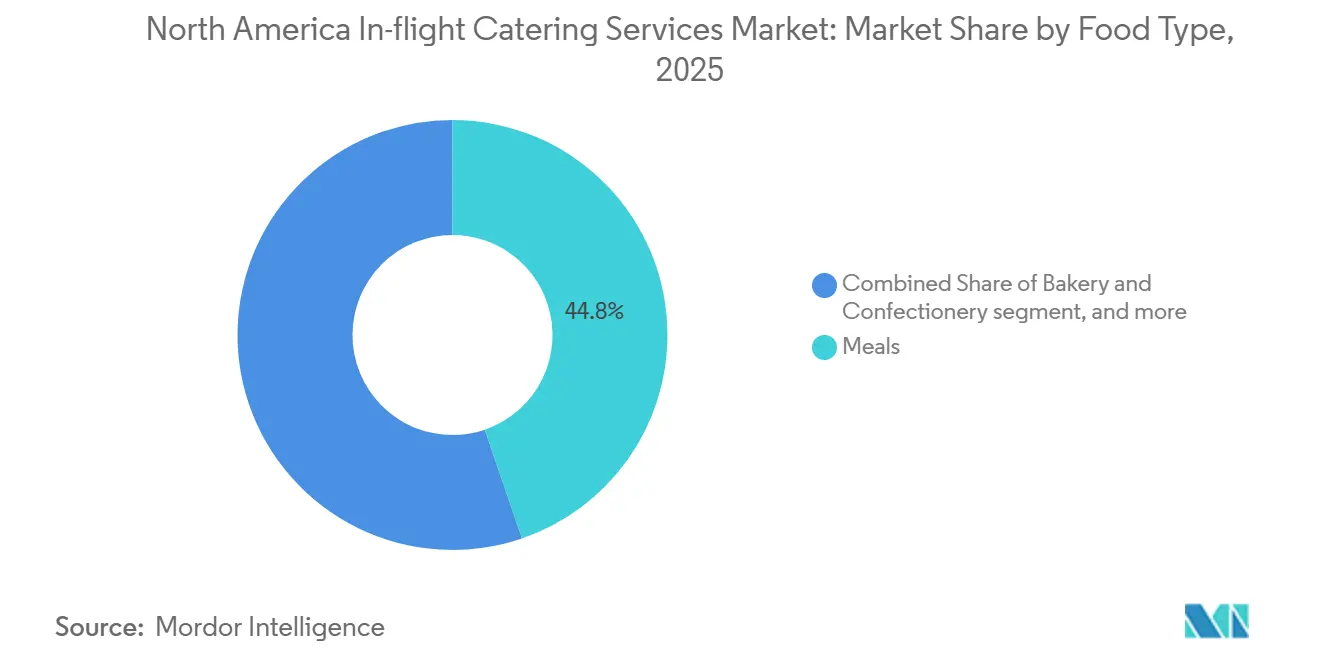
- By food type, meals accounted for 44.76% of the North America in-flight catering services market share in 2025; snacks and savouries are forecast to post the fastest 8.39% CAGR through 2031.
- By flight type, full-service carriers (FSCs) retained 61.89% of the revenue share in 2025, while low-cost carriers (LCCs) are projected to expand at a 9.02% CAGR to 2031.
- By aircraft seating class, economy service accounted for 56.98% of the North America in-flight catering services market size in 2025, and business-class catering is advancing at a 9.21% CAGR through 2031.
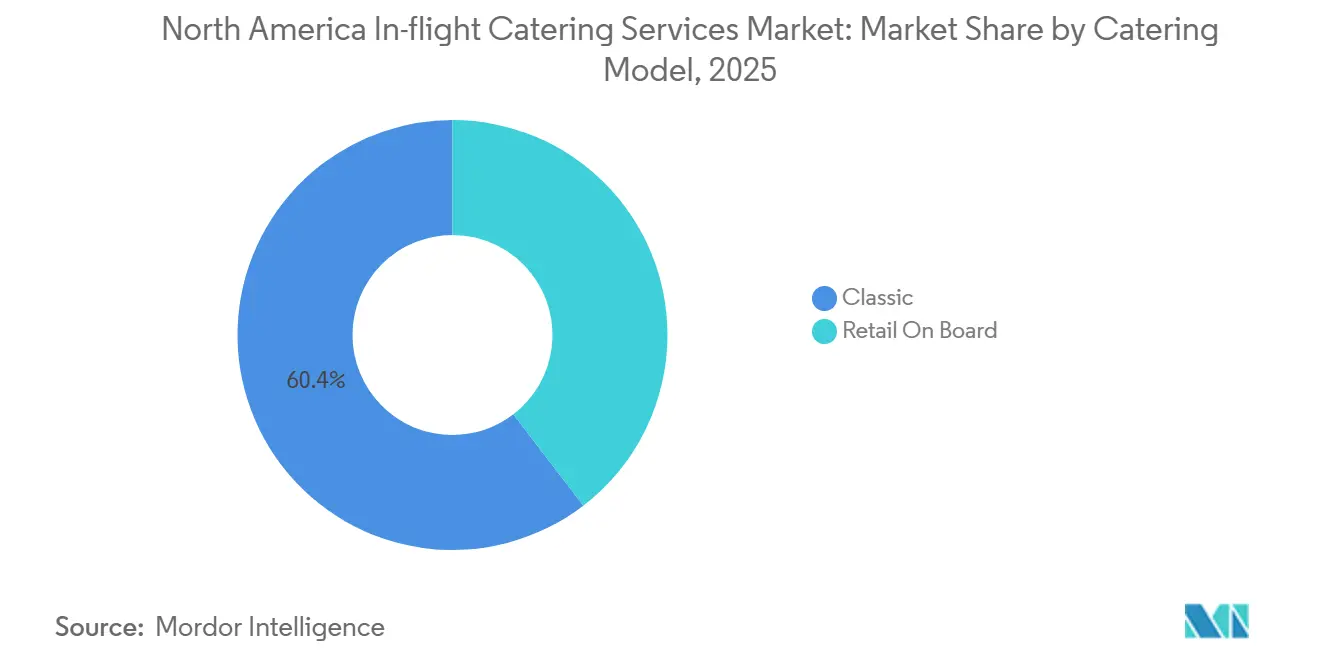
- By catering model, the classic complimentary service held a 60.41% share in 2025; retail buy-on-board is the fastest-growing format, with an 8.66% CAGR.
- By flight duration, short-haul routes contributed 57.45% of revenue in 2025, while long-haul demand is expanding at an 8.53% CAGR to 2031.
Note: Market size and forecast figures in this report are generated using Mordor Intelligence’s proprietary estimation framework, updated with the latest available data and insights as of January 2026.
Market Trends and Insights
Drivers Impact Analysis of North America In-flight Catering Services Market*
| Driver | (~) % Impact on CAGR Forecast | Geographic Relevance | Impact Timeline |
|---|---|---|---|
| Rebound in air-passenger traffic and long-haul capacity additions | +2.10% | United States hubs, Canada transpacific gateways, Mexico leisure corridors | Medium term (2-4 years) |
| Premiumization of onboard experience to differentiate airline brands | +1.80% | United States transcontinental and transatlantic routes, Canada premium-economy expansion, select Mexico City long-haul | Long term (≥ 4 years) |
| Expansion of LCCs and hybrids scaling buy-on-board and pre-order models | +1.60% | Southwest–Spirit–Frontier networks, WestJet–Flair, Volaris–VivaAerobus | Short term (≤ 2 years) |
| Digitalization through pre-order platforms, data-driven menu planning, and kitchen automation | +1.30% | Los Angeles, New York, Chicago, Toronto Pearson, Mexico City pilots | Medium term (2-4 years) |
| Adoption of sustainable, weight-saving packaging solutions | +1.20% | Major US and Canadian hubs seeking fuel-burn reduction | Medium term (2-4 years) |
| Fresh-frozen integrated networks enabling multi-cuisine, multi-channel service | +1.00% | Cross-border long-haul corridors and secondary airports | Long term (≥ 4 years) |
| Source: Mordor Intelligence | |||
Rebound in Air-Passenger Traffic and Long-Haul Capacity Additions
According to IATA's year-end report for 2024, international traffic surpassed the 2019 benchmark by just 0.5%. The combined total traffic (domestic and international) exceeded 2019 figures by 3.8%.[1]Federal Aviation Administration, “FAA Aerospace Forecast 2024-2044,” faa.gov Airlines are therefore pushing capacity toward transoceanic sectors where meal service is mandatory, and yields are higher than on short-haul flights. In the summer of 2025, North America boasted a seat capacity of 793 million. As Canadian gateways increased their flight frequencies and Mexican leisure routes expanded, demand for catering services became concentrated at airports with limited kitchen facilities. The FAA projects system revenue passenger miles will grow 2.8% annually through 2045, implying longer average stage lengths that favor caterers able to scale multi-course service economically. Suppliers lacking fresh-frozen networks or multi-cuisine certification risk displacement as long-haul corridors expand.
Premiumization of Onboard Experience to Differentiate Airline Brands
Delta formalized chef programs with José Andrés and Mashama Bailey in 2024, rotating seasonal menus in Delta One cabins, and Alaska Airlines introduced its Chef’s Table concept in May 2025.[2]Delta Air Lines, “Premium Dining Partnerships,” delta.com A 2024 survey of premium travelers found that 78% cite food quality as a key repeat-booking trigger, prompting carriers to invest in signature dishes, wine pairings, and regionally sourced ingredients. American Airlines operates a 214,000-square-foot facility in Dallas/Fort Worth that produces 15,000 meals daily, demonstrating how industrial kitchens can incorporate chef recipes at scale. Business-class meals now command rate premiums that translate catering spend into measurable customer lifetime value during economic cycles.
Expansion of LCCs and Hybrids Scaling Buy-on-Board and Pre-Order Models
Volaris carried 30 million passengers in 2024 and generated approximately 15% of ancillary revenue from onboard food, while VivaAerobus operates a 100% retail model and increased capacity by 33% year-over-year. United and Delta expanded meal pre-order windows to 5 days before departure, enabling dynamic galley loading that reduces waste and boosts sell-through. Because every item is a discrete transaction, LCCs gather granular purchase data that informs rapid SKU iteration, pressuring legacy complimentary service to adopt hybrid approaches on short routes.
Digitalization Through Pre-Order Platforms, Data-Driven Menu Planning, and Kitchen Automation
In 2024, gategroup rolled out AI pilots in Los Angeles, Toronto, and Chicago, achieving a 20% reduction in overproduction.[3]gategroup, “Sustainability and Innovation Initiatives,” gategroup.com KLM Catering Services slashed food waste by 60% using predictive planning. Meanwhile, Airbus introduced a prototype Food Scanner that monitors consumption and delivers real-time data to caterers. Although capital-intensive, high-volume hubs are adopting robotic plating and automated tray assembly, thereby enhancing labor productivity and ensuring consistent meal quality.
Restraints Impact Analysis of North America In-flight Catering Services Market*
| Restraint | (~) % Impact on CAGR Forecast | Geographic Relevance | Impact Timeline |
|---|---|---|---|
| High operating costs and inflation in food, labor, and utilities | -1.40% | US metro hubs, Canadian urban centers, Mexico City | Short term (≤ 2 years) |
| Stringent multi-jurisdiction food-safety, halal, and kosher rules | -0.90% | Cross-border operations and long-haul routes | Medium term (2-4 years) |
| Capital-intensive nature of kitchen automation rollouts | -0.80% | High-volume hubs that require USD 5–10 million facility upgrades | Medium term (2-4 years) |
| Contract-to-retail mix shift reducing traditional meal volumes | -0.70% | Legacy full-service networks in the United States and Canada | Short term (≤ 2 years) |
| Source: Mordor Intelligence | |||
High Operating Costs and Inflation in Food, Labor, and Utilities
Food-away-from-home inflation in the United States reached 4.1% in 2024, and labor costs increased by 4.5%, resulting in average food-service wages of USD 19.47 per hour.[4]U.S. Bureau of Labor Statistics, “Consumer Price Index – Food Away From Home,” bls.gov Canada faced 5.2% food inflation in October 2024 before easing to 4.3% a month later, with hospitality pay averaging CAD 20.85 (USD 15.40). Refrigeration and blast-chilling operations account for 15%–20% of total energy expenses, and commercial power rates increased by roughly 3% across North America in 2024. These pressures compress margins on economy-class contracts, triggering SKU rationalization and automated shift scheduling that risk service differentiation and staff retention.
Stringent Multi-Jurisdiction Food-Safety/Halal / Kosher Rules
The FDA’s FSMA 204 traceability mandate took effect in January 2026 for high-risk foods, imposing two-year audit-trail requirements. Canada’s Safe Food for Canadians Regulations mirror that framework, and Mexico’s NOM-251-SSA1-2009 governs handling practices. Halal and kosher lines incur an additional 15% in ingredient and certification costs, yet are essential on select routes. Compliance complexity favors large network caterers, who can amortize systems across thousands of daily meals, while smaller regional kitchens face either margin dilution or market exit.
*Our forecasts treat driver/restraint impacts as directional, not additive. The impact forecasts reflect baseline growth, mix effects, and variable interactions.
North America In-flight Catering Services Market Segment Analysis
By Food Type:
Snacks Gain as Short-Haul Frequencies MultiplyMeals accounted for 44.76% of revenue in 2025, but snacks and savouries are forecast to climb at an 8.39% CAGR to 2031 as carriers add sub-500-mile services best suited to pre-packaged items. More than half of US flights are under two hours, limiting the feasibility of heated meals and favoring snack boxes and grab-and-go sandwiches. United extended its pre-order window to offer 12–15 SKUs per route, while Delta rotates seasonal snack boxes priced at USD 10–12. Shelf-stable items also carry lighter traceability burdens, which speeds up the time-to-market. Although beverages remain a core revenue line, TSA's relaxations of the liquid-carrying rule are allowing larger personal drinks, which is dampening onboard sales growth. Bakery and confectionery products play a niche role in premium cabins, where warm cookies and plated desserts elevate the brand experience.
Regulatory clarity improves snack economics. FSMA 204 exempts many shelf-stable goods processed with validated kill steps, lowering audit overhead. Caterers with flexible lines can deliver mixed cases, including a protein box, a fruit cup, and a premium snack mix, without requiring duplicate inventory. Traditional meal-assembly plants designed for thousands of identical entrées must reinvest or risk obsolescence. As a result, snacks are becoming the testing ground for plant-based proteins, allergen-free ingredients, and compostable wrappers that satisfy airline sustainability mandates with minimal operational disruption.


By Flight Type:
LCC Momentum Challenges FSC Volume DominanceFSCs accounted for 61.89% of 2025 revenue, but low-cost operators are expected to expand by 9.02% annually through 2031, treating food as a profit center rather than an obligation. Volaris earns roughly 15% of its ancillary revenue from catering alone. VivaAerobus recorded a 33% capacity jump and sells every meal retail. WestJet’s tiered menus monetized flights once considered too short for service, selling snack boxes for USD 5 up to premium meals for USD 18. Charter and private-jet catering remain high-margin niches with spend often exceeding USD 50 per passenger.
LCCs win on data transparency. Each transaction feeds route-level analytics that inform SKU curation and waste reduction. FSCs are experimenting with hybrid models; American introduced buy-on-board on sub-900-mile flights in 2024. Loyalty programs, however, limit how far legacy brands can unbundle without alienating frequent flyers. The strategic balance seeks to protect premium tiers while monetizing economy cabins via optional upgrades.
By Aircraft Seating Class:
Business Cabins Drive Premiumization EconomicsThe economy class accounted for 56.98% of 2025 revenue, driven by passenger volume. However, business-class demand is expected to rise 9.21% annually through 2031, as airlines focus on improving food quality to justify fares that are three times those of economy class. Signature chef alliances are now standard on transatlantic and transpacific routes, and a 2024 survey found that 78% of premium flyers consider cuisine a key factor in their booking decisions. First class remains limited to flagship long-haul routes, where airlines spend over USD 100 per passenger on multi-course dining, but its halo effect elevates the wider brand image.
At the low end, airlines micro-specify calorie counts and portion costs, leaving caterers with razor-thin margins of 3% to 5%. FSMA 204 imposes equal traceability obligations across all cabins, yet its cost impact is disproportionately harsher on low-priced economy meals. This split is prompting caterers to invest in high-margin, premium production lines while automating economy-scale assembly to maintain viability.
By Catering Model:
Retail Formats Erode Complimentary DominanceThe classic complimentary service still accounts for 60.41% of 2025 revenue, anchored by long-haul sectors where meals remain non-negotiable. Retail buy-on-board, however, is the fastest-growing model at an 8.66% CAGR. United and Delta generate incremental revenue from advance orders priced at USD 10–15, integrating selections into mobile apps and loyalty profiles. Volaris and VivaAerobus demonstrate that gross margins can exceed 40% when every item is a sale, compared to 15%–20% on complementary contracts.
Retail models align airline and caterer incentives by shifting the focus from volume uplift to sell-through rates. Integration with New Distribution Capability channels enables carriers to bundle food with seats, baggage, and lounge access into a single offer. Complimentary service holds on long hauls because passengers expect at least two meal waves on 10-hour flights, yet menu “upgrade” options blur the line as carriers upsell chef-designed entrées at USD 20–30.
By Flight Duration:
Long-Haul Revenue Intensity Offsets Short-Haul VolumeShort-haul segments accounted for 57.45% of revenue in 2025, but long-haul demand is expected to grow at an annual rate of 8.53% through 2031. Boeing forecasts 2.8% yearly growth in regional revenue passenger miles to 2045, outpacing seat counts and reinforcing longer stage lengths. Multi-course meals, mid-flight snacks, and beverage service add 20%–30% to cost yet command price premiums that lift overall yields. Air Canada’s Asia expansion illustrates the upside: catering spend per transpacific passenger runs three to four times that of a domestic shuttle flight.
Regional jets on sub-two-hour legs lack oven capacity and storage volume, forcing reliance on shelf-stable snacks and sandwiches. TSA rule changes on liquids allow passengers to carry larger beverages, leading to lower in-flight drink purchases. Southwest, Spirit, and Frontier exploit the model by offering snacks only, monetizing food as an optional add-on rather than baked into the cost. Long-haul services, by contrast, require cold-chain integrity, allergen-free menus, and efficient waste management systems, which only large-scale caterers can provide.
Geography Analysis
United States In-flight Catering Services Market
The US generated 55.91% of regional revenue in 2025, driven by dense hub-and-spoke networks in Atlanta, Dallas/Fort Worth, Chicago, and Los Angeles. Passenger counts in 2024 exceeded 2019 levels by 8%, and international RPKs jumped 18.4%, but domestic growth slipped to 4.0% by late 2025. DO & CO opened a USD 50 million expansion at JFK in March 2024, targeting premium long-haul services, while gategroup deployed AI forecasting at LAX and ORD, cutting waste up to 20%. Inflation and FSMA 204 compliance weigh on margins, favoring integrated players that spread traceability costs across high volumes.
Canada In-flight Catering Services Market
Canada is the fastest-growing geography at an 8.81% CAGR through 2031. Air Canada reached 50 million passengers in 2024, driven by its Asia routes, which require multi-cuisine menus and rigorous cold-chain logistics. Toronto Pearson and Vancouver handle most of that surge, prompting gategroup AI pilots and joint-venture talks with SATS in 2024. Food-service inflation peaked at 5.2% in 2024, and rising hospitality wages prompted operators to consider automation. Canada’s SFCR mirrors US traceability rules, enabling compliance synergies for cross-border routes yet raising barriers for small kitchens that lack digital lot tracking.
Mexico In-flight Catering Services Market
Mexico shows smaller absolute revenue but outsized growth driven by ultra-low-cost carriers (ULCCs). Volaris flew 30 million passengers in 2024 and earns a significant share of its profits from food sales. VivaAerobus expanded capacity by 33% year over year on a fully retail model. Tourism recorded 42 million international visitors in 2024, with demand concentrated in Cancún and Los Cabos. Catering infrastructure is fragmented outside Mexico City; however, lighter compliance oversight under NOM-251-SSA1-2009 allows faster menu turnover. Flag carrier Aeromexico revamped its premium menus in 2024 to defend its share on long-haul flights, leveraging partnerships with local chefs.
Regulatory Landscape
In North America, in-flight catering operations are governed by overlapping food-safety and public-health regimes that apply to commissaries and any upstream suppliers feeding airport kitchens. In the United States, caterers fall under FDA requirements including 21 CFR Part 117 (preventive controls for human food) and the FDA Interstate Travel Program sanitation framework tied to 21 CFR Parts 1240 and 1250 for aircraft-related food and facilities, alongside state and local health oversight at airports.
Traceability became a sharper compliance and IT requirement with the FDA Food Safety Modernization Act (FSMA) Section 204 Food Traceability Final Rule taking effect in January 2026 for items on the Food Traceability List. The rule requires capture and retention of Key Data Elements for Critical Tracking Events (such as receiving, transformation, and shipping) and rapid retrieval on request. Canada uses a comparable approach through the Safe Food for Canadians Regulations, which supports some cross-border process alignment, while Mexico food handling practices are governed under NOM-251-SSA1-2009, creating a multi-jurisdiction operating environment for caterers serving international routes, special meals, and multi-station airline networks.
Value Chain Analysis
The value chain starts with ingredient sourcing (proteins, produce, bakery inputs, beverages, and specialty items for allergen-free, halal, and kosher menus), then moves into centralized purchasing and menu development with airlines and brand partners. Production is carried out in airport-adjacent commissaries and, in some models, satellite or off-airport kitchens that assemble meals, snack boxes, and buy-on-board SKUs, followed by blast-chill/cold-chain staging, order picking, and ramp delivery via high-lift catering trucks for final aircraft provisioning. Large network caterers such as gategroup, LSG Group, Flying Food Group, DO & CO, and dnata span multiple hubs and stations, while premium and private-aviation specialists (for example, Air Culinaire Worldwide) and regional providers (for example, Air Fayre) serve niche and bespoke demand.
Downstream, airline-facing interfaces include pre-order and retail-on-board integration, inventory visibility by flight, and waste and returns handling, where AI forecasting and digitized lot tracking sit between airline systems and catering ERP. Key cost and performance pinch points concentrate in labor availability, utilities for refrigeration and blast chilling, and compliance documentation for multi-jurisdiction operations. This dynamic drives SKU standardization, packaging weight reduction, and automation in tray assembly and pick/pack workflows at high-volume hubs.
Competitive Landscape
The North America in-flight catering services market is moderately concentrated; the top five players, gategroup, LSG Group, Flying Food Group, DO & CO Aktiengesellschaft, and dnata, control just over half of business-class volumes. Gategroup’s AI pilots at three major hubs reduced waste up to 20% and enabled dynamic menu rotation tied to real-time bookings. DO & CO invested USD 50 million to expand JFK capacity, targeting transatlantic and Middle East flights. SATS posted SGD 1.8 billion in revenue in Q2 FY2024/25 and is negotiating joint ventures for regional airports in Canada and Mexico. LSG Group’s Sky Chefs arm operates more than 30 North American kitchens and is introducing compostable packaging lines to reduce galley weight for its partner airlines.
Strategic themes cluster around vertical integration, digital enablement, and sustainability. Integrated suppliers own protein-processing and bakery assets, capturing margins across the value chain and buffering input inflation. Digital pre-order APIs, real-time inventory views, and automated tray assembly improve labor productivity and accuracy. Sustainability programs such as fresh-frozen networks, carbon-neutral production, and waste-to-energy conversions help win tenders with airlines seeking to meet ESG targets. Smaller regional caterers still hold niche pricing power where halal, kosher, or allergen-free certification is mandatory and incumbents lack the required lines.
North America In-flight Catering Services Industry Leaders
gategroup
LSG Group
Flying Food Group LLC
DO & CO Aktiengesellschaft
dnata
- *Disclaimer: Major Players sorted in no particular order
North America In-flight Catering Services Market Companies Covered in this Report
- gategroup
- LSG Group
- Flying Food Group LLC
- DO & CO Aktiengesellschaft
- dnata
- Newrest Group Services SAS
- SATS Ltd.
- Cathay Pacific Catering Services (H.K.) Limited
- KLM Catering Services
- Air Fayre
- Air Gourmet, Inc.
- Abby's Catering (Amber Green Corporation)
- Air Culinaire Worldwide
Read Analysis of North America In-flight Catering Services Companies

Market Opportunities and Future Outlook
Compliance-led digital traceability and airline-driven waste reduction programs are creating a whitespace for caterers that can unify lot-level data with demand signals (bookings, pre-orders, and load factors) across multi-station networks. With FSMA 204 in effect from January 2026 for high-risk foods, airlines and caterers have an immediate incentive to digitize Critical Tracking Events and integrate supplier data into provisioning workflows, favoring players that can produce audit-ready records without slowing dispatch at major hubs.
Technology-enabled waste reduction is also moving from pilots into live operations, supporting margin improvement while meeting airline sustainability targets. Airbus demonstrated camera- and AI-based Smart Catering on live A330 and A350 flights in April 2026 (including transatlantic and US gateway routes), and gategroup has already reported measurable overproduction reductions from AI pilots at major North American hubs. This intersects with the continuing shift toward retail and pre-order models on short-haul networks, where real-time offer management and app-linked menus help caterers and airlines synchronize SKU mix, reduce returns, and expand higher-margin snacks and premium upsell items without adding galley complexity.
Recent Industry Developments in North America In-flight Catering Services Market
- May 2026: Flying Food Group began providing catering for LOT Polish Airlines on its new four-times-weekly nonstop route between San Francisco and Warsaw. The win strengthens Flying Food Group's position in a high-compliance, long-haul lane where multi-course service and cold-chain reliability raise the bar for operational execution.
- November 2025: gategroup opened an upgraded gategourmet facility at Montreal-Trudeau International Airport (YUL) to serve Air Canada. The upgrade expands network capacity at a major Canadian gateway and supports menu complexity and traceability requirements on long-haul routes.
- November 2024: LSG Sky Chefs invested USD 60 million in a new fleet of 230 catering trucks to modernize North American operations. The scale of fleet renewal directly improves ramp logistics reliability, service-time performance, and equipment readiness across high-volume stations.


North America In-flight Catering Services Market Report Scope and Research Methodology
Market Definition and Coverage
For this study, the market is defined as revenue earned from preparing and supplying food and beverage items that are served to passengers on commercial flights in North America, including classic catering and retail on board programs.
Scope exclusions: We exclude airport lounges, terminal restaurants, and ground catering for rail, cruise, and general events.
Segments Covered in This Report
- By Food Type
- Meals
- Bakery and Confectionery
- Snacks and Savouries
- Beverages
- By Flight Type
- Full-Service Carriers (FSCs)
- Low-Cost Carriers (LCCs)
- Other Flight Types
- By Aircraft Seating Class
- Economy
- Business
- First
- By Catering Type
- Classic (Complimentary and Pre-ordered)
- Retail On Board (Buy-on-board)
- By Flight Duration
- Short-Haul
- Long-Haul
- By Geography
- United States
- Canada
- Mexico
Data Sources, Market Sizing, and Validation
Desk Research
Desk research was used to map the demand pool and align it to how airline catering is actually procured and delivered across North America. We reviewed public aviation activity and operating context from sources such as the US DOT Bureau of Transportation Statistics (passenger traffic), FAA publications, Statistics Canada, and Mexico government aviation statistics where available.
To connect traffic to service needs and cost drivers, we also referenced materials from IATA and ACI, along with US Bureau of Labor Statistics food inflation series that affect menu pricing discussions. Company filings, investor presentations, association websites, and reputed press were used to cross-check price movement, capacity shifts, and contract-related announcements. A paid subscription for company financials and a paid subscription for shipment-level import and export data were selectively used to support revenue sanity checks and a few assumption inputs. The sources mentioned above are illustrative and not exhaustive, and many other public and paid references were used for data collection, validation, and clarification.
Primary Interviews and Surveys
Primary work focused on interviews and short surveys with airline catering stakeholders, including airline procurement and onboard services teams, caterer operations leads, and airport unit managers who see volumes day to day. We covered the United States, Canada, and Mexico so pricing, cabin mix, and route patterns could be validated across different operating realities, before assumptions were finalized and any gaps from desk research were closed.
Distribution of primary research fieldwork respondents
| Company type | Respondent position | Region |
|---|---|---|
| Top tier: 25% | CXOs: 12% | |
| Mid tier: 61% | Functional/Unit leaders: 36% | |
| Smaller Players: 14% | Managers: 52% |
Market-Sizing & Forecasting
Sizing started with a top-down build where passenger traffic and flight activity in North America were translated into addressable meal and beverage occasions by route type and cabin mix, and then priced using observed catering rate ranges. Once that structure was in place, selective bottom-up approximations were used to keep totals realistic, such as sampled kitchen throughput checks, airline service-plan comparisons, and sanity checks using supplier revenue patterns where disclosures exist.
Key inputs that shaped the model included passenger enplanements, flight frequency by short-haul versus long-haul, economy versus premium seating share, adoption of retail on board programs, and catering price inflation tied to food and packaging. Because these indicators do not move in lockstep, scenario analysis was used to reflect how traffic recovery, menu upgrades, and cost pass-through could play out under different airline strategies. Where local data was thin (for example, smaller airports or irregular charter-like activity), we applied conservative proxy ratios anchored to comparable hub and spoke patterns, and then re-checked the output with interview feedback.
Data Validation & Update Cycle
All model outputs were triangulated against independent signals such as traffic trends, airline capacity changes, and reported contract wins, and then reviewed for year-over-year jumps that did not match the operating environment. When a variance looked high, the underlying driver was re-opened, and targeted follow-up calls were triggered to confirm whether the change was real or a modeling artifact.
Before sign-off, the work goes through a multi-step analyst review where assumptions, unit economics, and currency treatment are checked for internal consistency. The report is refreshed annually, with interim updates when material events occur, and a final pre-delivery pass is completed so clients receive the most current view available.
Mordor Intelligence's Flight Catering Services North America Market Sizing Compared With Other Published Estimates
Published market sizes for in-flight catering can look far apart even when they describe the same region, because the underlying build often relies on different demand triggers and service inclusions. Differences commonly come from whether retail on board is counted, how premium cabin share is treated, and what year and currency timing are used.
In this market, the biggest gaps tend to come from mixing airline catering with adjacent airport foodservice, applying aggressive price progression without checking airline cost pass-through behavior, or using a single traffic proxy that misses route length and cabin effects. The checks that keep the estimate anchored are practical ones, like matching passenger volumes to meal occasions, confirming classic versus buy-on-board penetration, and then validating rate bands with operators, which is where the spread seen in other published figures usually starts.
Benchmark comparison
| Source | Market Size | Gaps in Research Methodology |
|---|---|---|
| Mordor Intelligence | USD 5.00 B (2025) | |
| Industry Advisory A | USD 3.48 B (2024) | This estimate appears to use an earlier base year and a narrower monetized scope, which can undercount retail on board revenue and premium cabin uplift when converting traffic into catering spend. |
| Research Publisher B | USD 9.16 B (2024) | The higher value is consistent with a wider service definition, where some airport-adjacent food and broader flight categories may be included, and the source also shows base-year inconsistencies that can inflate totals. |
The table mainly shows that scope and the traffic-to-meal conversion logic drive most of the variance, not small calculation details. When classic catering and retail on board are counted only when they are tied to onboard service delivery, and when cabin mix and route length are priced with validated rate bands and re-checked during the annual refresh, the resulting value stays traceable to clear variables, which is the discipline used by Mordor Intelligence.


Key Questions Answered in the Report
How large is the North America in-flight catering services market today?
The North America in-flight catering services market size stands at USD 5.44 billion in 2026 and is forecasted to reach USD 8.09 billion by 2031.
What is driving future growth in airline food sales?
Premiumization on long hauls, LCC retail adoption, digital pre-order platforms, and AI waste reduction together support an expected 8.25% CAGR through 2031.
Which food type is growing fastest on board?
Snacks and savouries are projected to rise at 8.39% annually as sub-two-hour flights multiply and buy-on-board penetration deepens.
What impact do traceability regulations have on caterers?
FDA FSMA 204 and parallel Canadian rules require end-to-end digital lot tracking from 2026, adding compliance costs that favor large integrated kitchens with advanced IT.
Which airlines are innovating with chef partnerships?
Delta, Alaska Airlines, and American Airlines have all launched high-profile collaborations that refresh premium menus and boost repeat bookings.
How concentrated is the competitive landscape?
The top five suppliers hold just over half of premium-cabin volumes, giving the market a moderate concentration score of 6 on a 1-10 scale.
Page last updated on:


