Market Overview
| Study Period | 2018 - 2031 |
|---|---|
| Forecast Data Period | 2026 - 2031 |
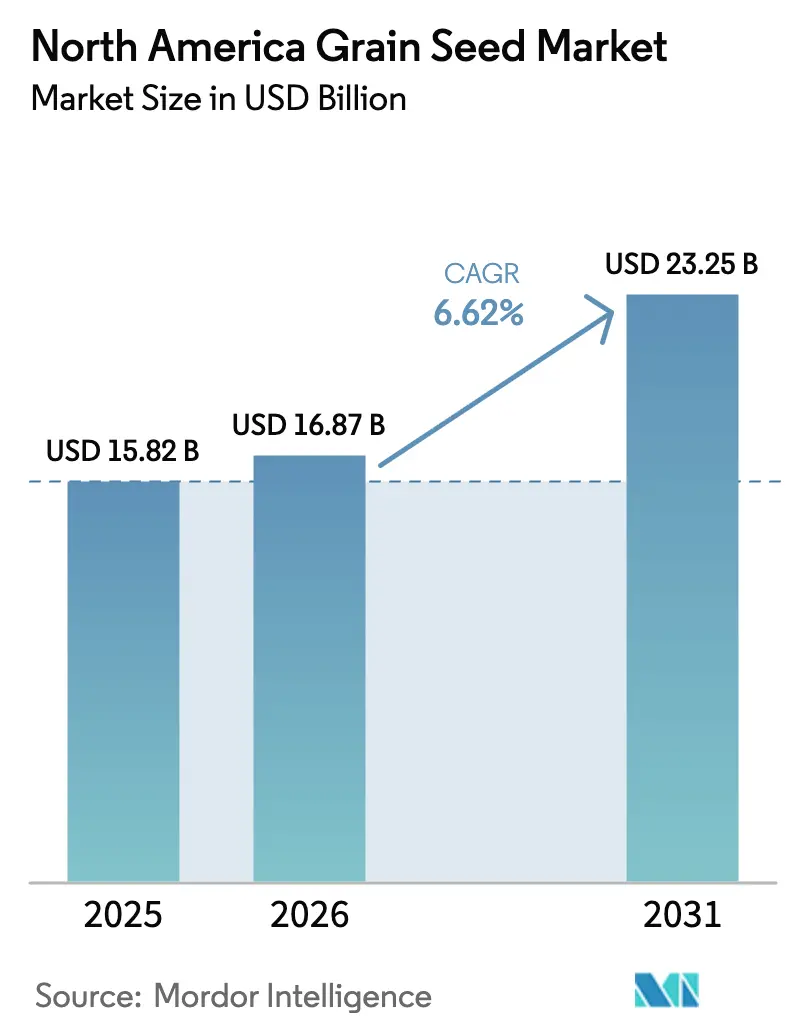
| Base Year Market Size (2025) | USD 15.82 Billion |
| Market Size (2026) | USD 16.87 Billion |
| Market Size (2031) | USD 23.25 Billion |
| Growth Rate (2026 - 2031) | 6.62% CAGR |
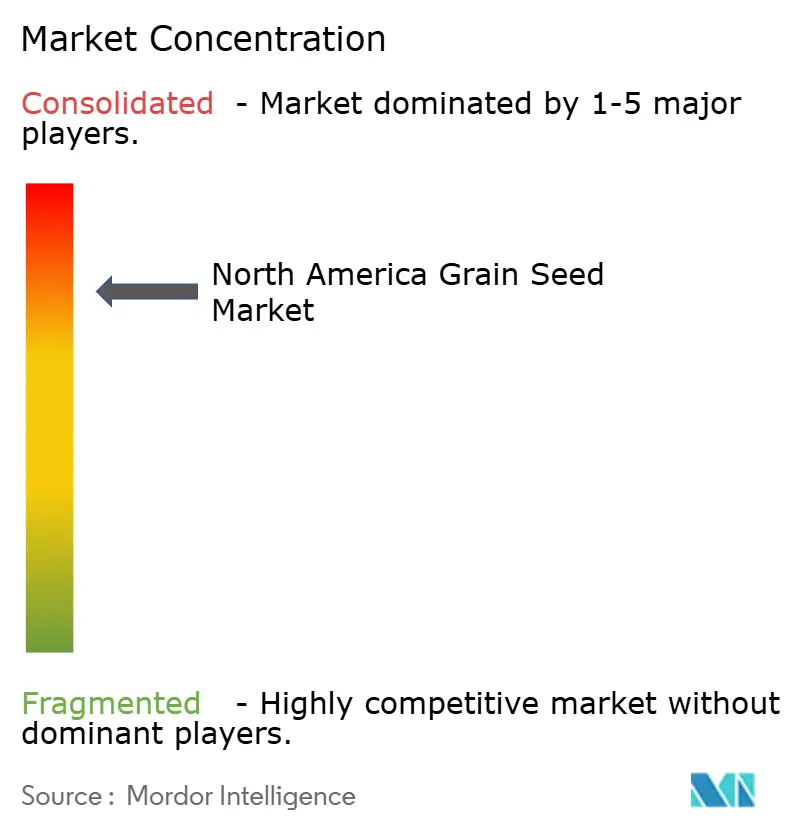
| Market Concentration | High |
Major Players *Disclaimer: Major Players sorted in no particular order Image © Mordor Intelligence. Reuse requires attribution under CC BY 4.0. | |
North America Grain Seed Market Analysis by Mordor Intelligence
The North America grain seed market size is expected to grow from USD 15.82 billion in 2025 to USD 16.87 billion in 2026 and is forecast to reach USD 23.25 billion by 2031 at 6.62% CAGR over 2026-2031. This sustained expansion rests on rapid biotechnology adoption, with gene-edited drought-tolerant lines and carbon-sequestering cereals gaining traction under federal climate-smart incentives. Seed companies bundle multiple herbicide-tolerant and insect-resistant traits to justify premium pricing that funds ongoing R&D. Competitive intensity remains moderate, yet disruptive gene-editing pipelines shorten breeding cycles and lower compliance costs, reshaping market entry economics. Regulatory harmonization between the United States and Canada accelerates cross-border variety launches, while Mexico’s restrictive GMO stance creates divergent product pathways.
Key Report Takeaways
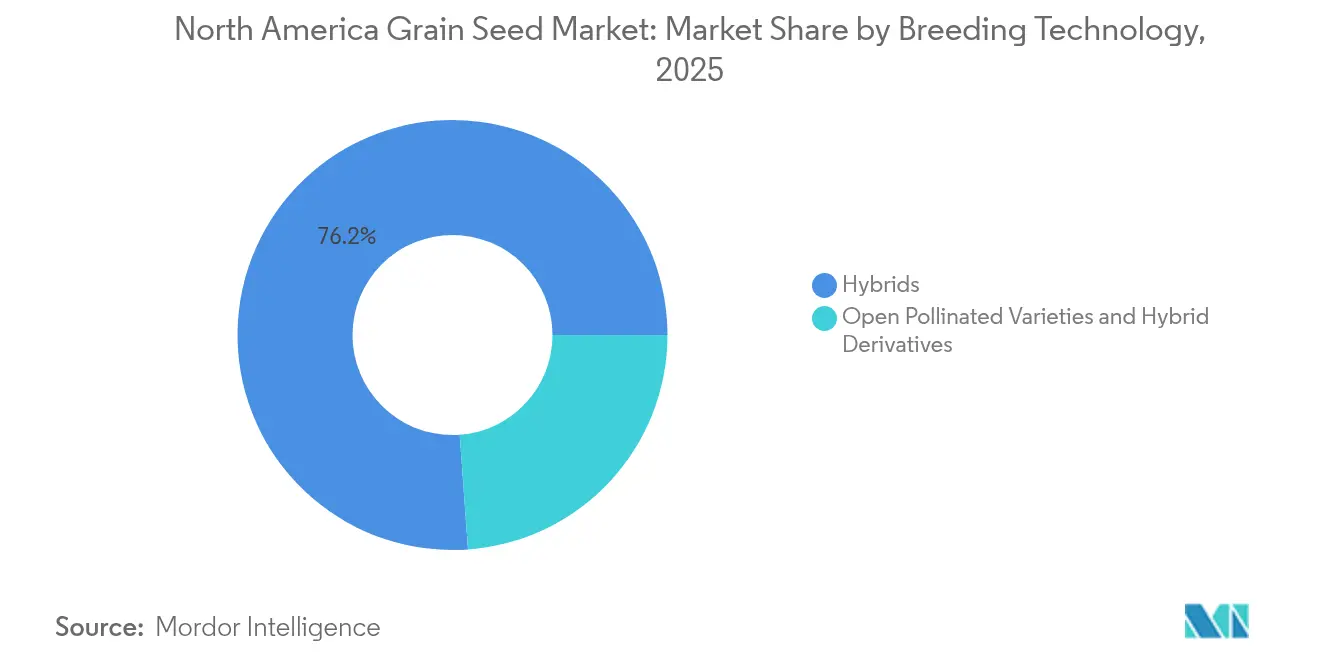
- By breeding technology, hybrids led with 76.15% of the North America grain seed market share in 2025 and are progressing at a 6.92% CAGR through 2031.
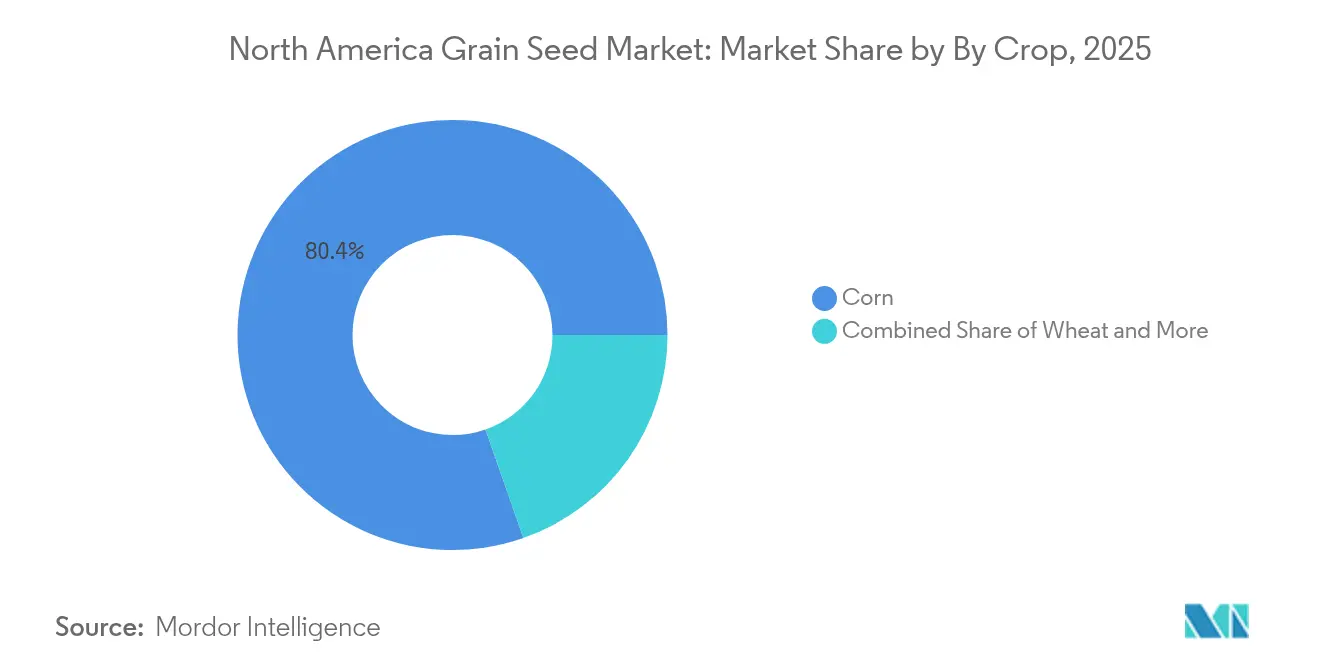
- By crop, corn accounted for 80.35% of the North America grain seed market size in 2025 and is expanding at a 6.95% CAGR to 2031.
- By geography, the United States held 84.75% of the North America grain seed market in 2025, and records the highest projected CAGR at 7.05% through 2031.
Note: Market size and forecast figures in this report are generated using Mordor Intelligence’s proprietary estimation framework, updated with the latest available data and insights as of 2026.
North America Grain Seed Market Trends and Insights
Drivers Impact Analysis*
| Driver | (~) % Impact on CAGR Forecast | Geographic Relevance | Impact Timeline |
|---|---|---|---|
| Expansion of transgenic herbicide-tolerant traits | +1.2% | The United States and Canada, with limited Mexico penetration | Medium term (2-4 years) |
| Rapid adoption of high-yielding hybrid corn seeds | +1.4% | The United States core, expanding to the Canadian Prairie provinces | Short term (≤ 2 years) |
| USDA Climate-Smart Commodities incentives | +0.9% | United States national, spillover to Canadian carbon programs | Long term (≥ 4 years) |
| Gene-edited drought-tolerant sorghum pipelines | +0.7% | United States Great Plains, Northern Mexico drought zones | Long term (≥ 4 years) |
| Regenerative farming demand for multi-trait cover-crop cereals | +0.6% | United States Midwest and Canadian Prairie provinces | Medium term (2-4 years) |
| Carbon-credit schemes favoring high-biomass grain varieties | +0.5% | The United States and Canada with established carbon markets | Long term (≥ 4 years) |
| Source: Mordor Intelligence | |||
Expansion of Transgenic Herbicide-Tolerant Traits
Dicamba-tolerant soybeans, cotton, and emerging 2,4-D-tolerant corn hybrids cover more than 60 million acres across the United States, mitigating USD 2.2 billion in annual weed-related yield losses[1]Source: EPA, “Registration of Dicamba for Use on Dicamba-Tolerant Cotton and Soybean,” EPA.gov. EPA application buffers influence adoption zones, yet stacked packages that combine weed control, insect protection, and yield traits maintain premium seed margins. Seed developers increasingly pair herbicide tolerance with digital agronomy tools that guide application timing, reinforcing farmer loyalty across crop rotations within the North America grain seed market.
Rapid Adoption of High-Yielding Hybrid Corn Seeds
Hybrid corn occupies 99% of planted U.S. acreage, with stacked-trait versions representing 85% of that total[2]Source: USDA Economic Research Service, “Corn and Other Feedgrains,” USDA.gov. The economic driver stems from corn's role as the foundation crop for livestock feed and ethanol production, where yield improvements translate directly into farmer profitability and supply chain cost reductions. Market dynamics favor companies with extensive testing networks and data analytics capabilities that can predict hybrid performance across diverse growing environments and management systems.
USDA Climate-Smart Commodities Incentives
Federal investment in climate-smart agriculture is catalyzing demand for seed varieties that enhance carbon sequestration and reduce greenhouse gas emissions. The USDA's USD 3.1 billion Climate-Smart Commodities Partnership Program funds 141 projects across the United States, with significant allocations supporting cover crop adoption, reduced tillage practices, and precision nutrient management systems that require specialized seed varieties. The regulatory influence extends through USDA Natural Resources Conservation Service cost-share programs that subsidize seed purchases for qualifying conservation practices, creating a direct market subsidy for climate-adapted varieties.
Gene-Edited Drought-Tolerant Sorghum Pipelines
Drought tolerance represents the next frontier in grain seed innovation, with gene-edited sorghum varieties leading commercial development timelines. The USDA's streamlined SECURE rule enables faster regulatory approval for gene-edited crops that enhance drought tolerance without introducing foreign DNA sequences, reducing development costs and time-to-market compared to traditional GMO approaches. The strategic opportunity extends beyond drought tolerance, as sorghum's potential for biofuel production and livestock feed creates multiple market outlets that support premium pricing for enhanced varieties.
Restraints Impact Analysis*
| Restraint | (~) % Impact on CAGR Forecast | Geographic Relevance | Impact Timeline |
|---|---|---|---|
| Stringent GMO import ban proposals in Mexico | -0.8% | Mexico's national, cross-border trade implications for the United States | Short term (≤ 2 years) |
| High volatility in commodity grain prices | -0.6% | North America regional, global commodity market linkages | Short term (≤ 2 years) |
| Grain-handler consolidation limiting varietal diversity | -0.4% | United States rural regions, Canadian Prairie provinces | Medium term (2-4 years) |
| Climate-insurance underwriting bias against novel traits | -0.3% | United States crop insurance regions, with limited Canadian impact | Medium term (2-4 years) |
| Source: Mordor Intelligence | |||
Stringent GMO Import Ban Proposals in Mexico
Mexico’s pending constitutional ban on genetically modified corn imports jeopardizes USD 5.2 billion annual trade flows and forces seed suppliers to maintain parallel non-GMO lines. The USMCA trade dispute resolution process remains ongoing, but interim compliance requirements are already influencing seed company investment decisions and farmer planting intentions in border regions. Market implications extend beyond Mexico, as other South American countries monitor the policy's implementation for potential adoption of similar restrictions.
High Volatility in Commodity Grain Prices
Corn futures swung in 2024, prompting growers to downshift from premium stacks to baseline hybrids during low-price windows. When commodity prices decline, farmers typically reduce seed expenditures by switching from premium-priced stacked-trait varieties to lower-cost conventional hybrids, directly impacting seed company revenue growth. This price sensitivity is particularly acute for specialty traits like drought tolerance and enhanced nutritional profiles that command significant premiums but may not deliver immediate yield benefits. Risk management strategies include seed company financing programs and forward contracting arrangements, but these approaches add complexity to farmer decision-making processes and may limit market penetration for innovative varieties.
*Our forecasts treat driver/restraint impacts as directional, not additive. The impact forecasts reflect baseline growth, mix effects, and variable interactions.
Segment Analysis
By Breeding Technology: Hybrids Drive Innovation Leadership
Hybrid seeds generated 76.15% of 2025 revenue, and that share is poised to expand as stacked-gene packages deliver consistent on-farm returns. This segment alone represents a good share of the North America grain seed market and is on track for a 6.92% CAGR through 2031. Transgenic hybrids dominate the United States and Canadian row-crop landscapes, while non-transgenic hybrids serve organic and export-restricted channels. Intellectual property protection ensures annual purchase cycles, which stabilize cash flow for innovation pipelines.
Open-pollinated varieties and hybrid derivatives represent the remaining market share, primarily serving organic farmers, developing market segments, and regions with GMO regulatory restrictions. Recent innovations in genomic selection are improving the performance gap between hybrids and open-pollinated varieties, particularly for traits like disease resistance and stress tolerance that don't require complex gene stacking. The regulatory environment under USDA oversight continues to favor hybrid development through plant variety protection certificates and utility patents that extend market exclusivity periods for innovative breeding technologies.


By Crop: Corn Maintains Dominance Through Trait Innovation
Advanced trait development positions corn to sustain its 80.35% market share in 2025 while achieving 6.95% CAGR growth through 2031, outpacing other grain crops in both market size and innovation velocity. Stacked-gene corn varieties now incorporate up to eight different traits, including multiple herbicide tolerances, insect resistance mechanisms, and yield-enhancing genetic modifications that justify premium pricing structures. Rice represents the second-largest segment, benefiting from specialty varieties developed for direct-seeded production systems and herbicide-tolerant traits that reduce labor costs in mechanized operations.
Other grains and cereals, including specialty crops like quinoa and ancient grains, serve niche markets with premium pricing but limited scalability due to narrow adaptation ranges and specialized agronomic requirements. Market dynamics favor crops with established infrastructure for seed production, processing, and distribution, creating barriers to entry for alternative grain species despite growing consumer interest in dietary diversification.
Geography Analysis
The United States dominates the North American grain seed market with an 84.75% market share in 2025, leveraging advanced biotechnology regulations and farmer adoption of premium seed technologies to achieve a 7.05% CAGR growth through 2031. The Corn Belt states of Iowa, Illinois, Indiana, and Nebraska represent the highest-value market segments, where farmers routinely invest in premium hybrid seeds with stacked traits for herbicide tolerance, insect resistance, and yield enhancement. The USDA's SECURE rule implementation in 2024 positions the United States as the global leader in gene-edited crop commercialization, with streamlined regulatory pathways reducing development timelines and compliance costs for innovative varieties
Canada ranks second, propelled by Health Canada’s synchronized reviews and strong hybrid canola demand. Prairie growers invest in cold-tolerant cereals that extend rotation diversity. Mexico’s regulatory pivot away from GM corn introduces complexity but opens an opportunity for non-GMO hybrids tailored to local culinary preferences, retaining a position inside the broader North America grain seed market.
Mexico’s uncertain stance on GMO corn forces suppliers to split portfolios. Parallel development of non-GMO hybrids safeguards local supply but raises unit costs. Central American and Caribbean nations represent emerging demand for stress-tolerant seeds that accommodate hotter, drier climates, though limited capital impedes large-scale uptake across the North America grain seed market.
Competitive Landscape
The North America grain seed market exhibits high consolidation with the top five companies controlling a major share of the market, yet competitive dynamics remain intense due to patent expirations, gene-editing innovations, and regional specialization strategies. Established players like Bayer AG, Corteva Inc., Land O’Lakes Inc., BASF SE, and Syngenta Group leverage extensive patent portfolios and integrated distribution networks to maintain market position, while emerging biotechnology firms exploit regulatory advantages from the USDA's SECURE rule to develop gene-edited varieties with faster approval timelines and reduced compliance costs.
Technology deployment strategies center on data analytics platforms that integrate genomic selection, precision agriculture, and predictive modeling to accelerate variety development and optimize trait combinations for specific growing environments. Patent filings reveal an increasing focus on gene-editing applications for drought tolerance, nutrient use efficiency, and enhanced nutritional profiles, with companies filing 40% more biotechnology patents in 2024 compared to 2023[3]Source: United States Patent and Trademark Office, “Technology Assessment and Forecast Reports,” USPTO.gov. Precision phenotyping and predictive analytics trim testing cycles and boost hit rates for regionally adapted hybrids.
Acquisition trends focus on local germplasm and farmer-direct channels, as evidenced by Syngenta’s purchase of Beck’s Hybrids. Joint ventures like KWS and Limagrain’s sorghum program illustrate collaborative responses to climate-driven trait demand. Moderate market concentration gives incumbents scale yet leaves space for niche innovators inside the North America grain seed market.
North America Grain Seed Industry Leaders
BASF SE
Bayer AG
Land O’Lakes Inc.
Syngenta Group
Corteva Inc
- *Disclaimer: Major Players sorted in no particular order

Recent Industry Developments
- September 2025: KWS SAAT SE established a USD 300 million joint venture with Groupe Limagrain to develop gene-edited sorghum varieties for North American markets, combining KWS's drought tolerance expertise with Limagrain's breeding technologies.
- June 2025: Beck's Hybrids, a family-owned seed company, announced that it was acquiring a corn seed production facility in Phillips, Nebraska. The acquisition strengthens its position in premium hybrid corn markets and adds direct-to-farmer distribution capabilities.
- June 2025: S&W Seed Co. launched new alfalfa varieties with enhanced protein content and improved digestibility for livestock feed applications, targeting premium dairy and seed markets in California and the Southwest.


North America Grain Seed Market Report Scope
Hybrids, Open Pollinated Varieties & Hybrid Derivatives are covered as segments by Breeding Technology. Corn, Rice, Sorghum, Wheat are covered as segments by Crop. Canada, Mexico, United States are covered as segments by Country.Breeding Technology
| Hybrids | Non-Transgenic Hybrids | |
| Transgenic Hybrids | Herbicide Tolerant Hybrids | |
| Insect Resistant Hybrids | ||
| Other Traits | ||
| Open Pollinated Varieties & Hybrid Derivatives | ||
Crop
| Corn |
| Rice |
| Sorghum |
| Wheat |
| Other Grains & Cereals |
Geography
| Canada |
| Mexico |
| United States |
| Rest of North America |
| Breeding Technology | Hybrids | Non-Transgenic Hybrids | |
| Transgenic Hybrids | Herbicide Tolerant Hybrids | ||
| Insect Resistant Hybrids | |||
| Other Traits | |||
| Open Pollinated Varieties & Hybrid Derivatives | |||
| Crop | Corn | ||
| Rice | |||
| Sorghum | |||
| Wheat | |||
| Other Grains & Cereals | |||
| Geography | Canada | ||
| Mexico | |||
| United States | |||
| Rest of North America | |||


Market Definition
- Commercial Seed - For the purpose of this study, only commercial seeds have been included as part of the scope. Farm-saved Seeds, which are not commercially labeled are excluded from scope, even though a minor percentage of farm-saved seeds are exchanged commercially among farmers. The scope also excludes vegetatively reproduced crops and plant parts, which may be commercially sold in the market.
- Crop Acreage - While calculating the acreage under different crops, the Gross Cropped Area has been considered. Also known as Area Harvested, according to the Food & Agricultural Organization (FAO), this includes the total area cultivated under a particular crop across seasons.
- Seed Replacement Rate - Seed Replacement Rate is the percentage of area sown out of the total area of crop planted in the season by using certified/quality seeds other than the farm-saved seed.
- Protected Cultivation - The report defines protected cultivation as the process of growing crops in a controlled environment. This includes greenhouses, glasshouses, hydroponics, aeroponics, or any other cultivation system that protects the crop against any abiotic stress. However, cultivation in an open field using plastic mulch is excluded from this definition and is included under open field.
| Keyword | Definition |
|---|---|
| Row Crops | These are usually the field crops which include the different crop categories like grains & cereals, oilseeds, fiber crops like cotton, pulses, and forage crops. |
| Solanaceae | These are the family of flowering plants which includes tomato, chili, eggplants, and other crops. |
| Cucurbits | It represents a gourd family consisting of about 965 species in around 95 genera. The major crops considered for this study include Cucumber & Gherkin, Pumpkin and squash, and other crops. |
| Brassicas | It is a genus of plants in the cabbage and mustard family. It includes crops such as carrots, cabbage, cauliflower & broccoli. |
| Roots & Bulbs | The roots and bulbs segment includes onion, garlic, potato, and other crops. |
| Unclassified Vegetables | This segment in the report includes the crops which don’t belong to any of the above-mentioned categories. These include crops such as okra, asparagus, lettuce, peas, spinach, and others. |
| Hybrid Seed | It is the first generation of the seed produced by controlling cross-pollination and by combining two or more varieties, or species. |
| Transgenic Seed | It is a seed that is genetically modified to contain certain desirable input and/or output traits. |
| Non-Transgenic Seed | The seed produced through cross-pollination without any genetic modification. |
| Open-Pollinated Varieties & Hybrid Derivatives | Open-pollinated varieties produce seeds true to type as they cross-pollinate only with other plants of the same variety. |
| Other Solanaceae | The crops considered under other Solanaceae include bell peppers and other different peppers based on the locality of the respective countries. |
| Other Brassicaceae | The crops considered under other brassicas include radishes, turnips, Brussels sprouts, and kale. |
| Other Roots & Bulbs | The crops considered under other roots & bulbs include Sweet Potatoes and cassava. |
| Other Cucurbits | The crops considered under other cucurbits include gourds (bottle gourd, bitter gourd, ridge gourd, Snake gourd, and others). |
| Other Grains & Cereals | The crops considered under other grains & cereals include Barley, Buck Wheat, Canary Seed, Triticale, Oats, Millets, and Rye. |
| Other Fibre Crops | The crops considered under other fibers include Hemp, Jute, Agave fibers, Flax, Kenaf, Ramie, Abaca, Sisal, and Kapok. |
| Other Oilseeds | The crops considered under other oilseeds include Ground nut, Hempseed, Mustard seed, Castor seeds, safflower seeds, Sesame seeds, and Linseeds. |
| Other Forage Crops | The crops considered under other forages include Napier grass, Oat grass, White clover, Ryegrass, and Timothy. Other forage crops were considered based on the locality of the respective countries. |
| Pulses | Pigeon peas, Lentils, Broad and horse beans, Vetches, Chickpeas, Cowpeas, Lupins, and Bambara beans are the crops considered under pulses. |
| Other Unclassified Vegetables | The crops considered under other unclassified vegetables include Artichokes, Cassava Leaves, Leeks, Chicory, and String beans. |


Research Methodology
Mordor Intelligence follows a four-step methodology in all our reports.
- Step-1: IDENTIFY KEY VARIABLES: In order to build a robust forecasting methodology, the variables and factors identified in Step-1 are tested against available historical market numbers. Through an iterative process, the variables required for market forecast are set and the model is built on the basis of these variables.
- Step-2: Build a Market Model: Market-size estimations for the forecast years are in nominal terms. Inflation is not a part of the pricing, and the average selling price (ASP) is kept constant throughout the forecast period.
- Step-3: Validate and Finalize: In this important step, all market numbers, variables and analyst calls are validated through an extensive network of primary research experts from the market studied. The respondents are selected across levels and functions to generate a holistic picture of the market studied.
- Step-4: Research Outputs: Syndicated Reports, Custom Consulting Assignments, Databases, and Subscription Platforms


