Market Overview
| Study Period | 2018 - 2031 |
|---|---|
| Forecast Data Period | 2026 - 2031 |
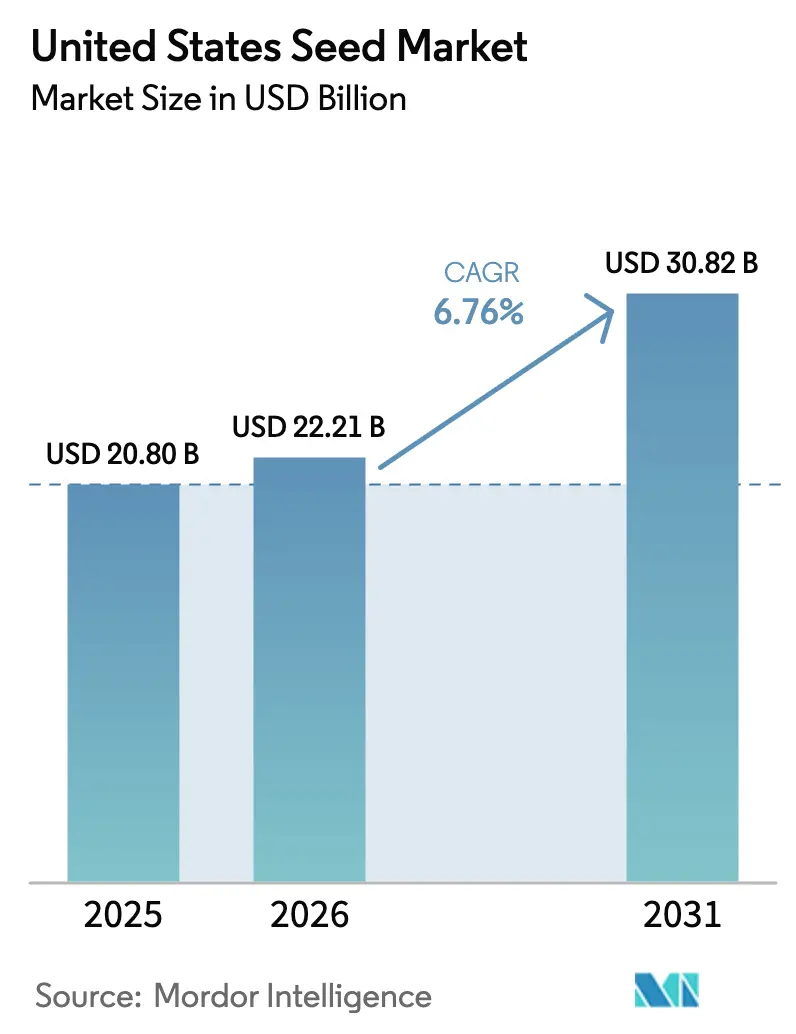
| Base Year Market Size (2025) | USD 20.8 Billion |
| Market Size (2026) | USD 22.21 Billion |
| Market Size (2031) | USD 30.82 Billion |
| Growth Rate (2026 - 2031) | 6.76% CAGR |
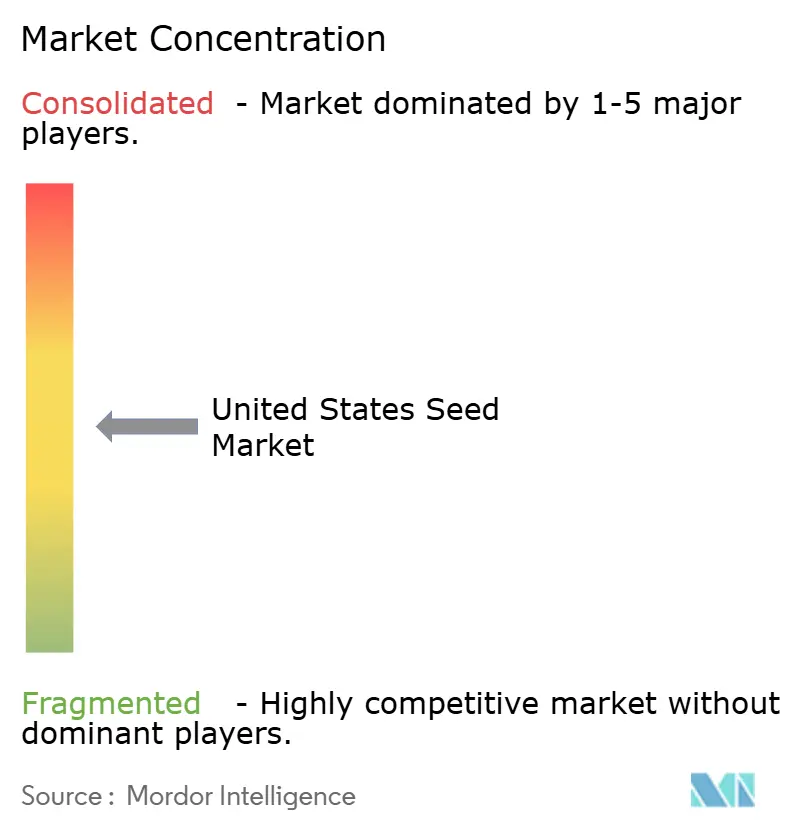
| Market Concentration | Medium |
Major Players *Disclaimer: Major Players sorted in no particular order Image © Mordor Intelligence. Reuse requires attribution under CC BY 4.0. | |
United States Seed Market Analysis by Mordor Intelligence
The United States seed market size is expected to grow from USD 20.8 billion in 2025 to USD 22.21 billion in 2026 and is forecast to reach USD 30.82 billion by 2031 at 6.76% CAGR over 2026-2031. Technology breakthroughs in gene editing, wider precision-agriculture adoption, and a supportive federal policy framework are lifting demand across major crop segments. Faster trait launches through the Food and Drug Administration (FDA) and Animal and Plant Health Inspection Service (APHIS) coordination are shortening commercialization cycles, while tax credits that expand biofuel feedstock capacity are enlarging planted acreage.[1]Source: Food and Drug Administration, “How GMO Crops Impact Our World,” FDA.gov Hybrids dominate breeding technology preferences thanks to stacked-trait packages that help farmers manage weed pressure and climate variability. Open field plantings command the bulk of seed use, yet protected cultivation seeds are showing a strong niche growth as indoor vegetable farming scales. Competitive intensity remains moderate with the top five companies holding a 57% revenue share, leaving space for regional specialists and digital-agriculture disrupters.[2]Source: Federal Trade Commission, “FTC Launches Inquiry into Agricultural Industry Consolidation,” ftc.gov
Key Report Takeaways
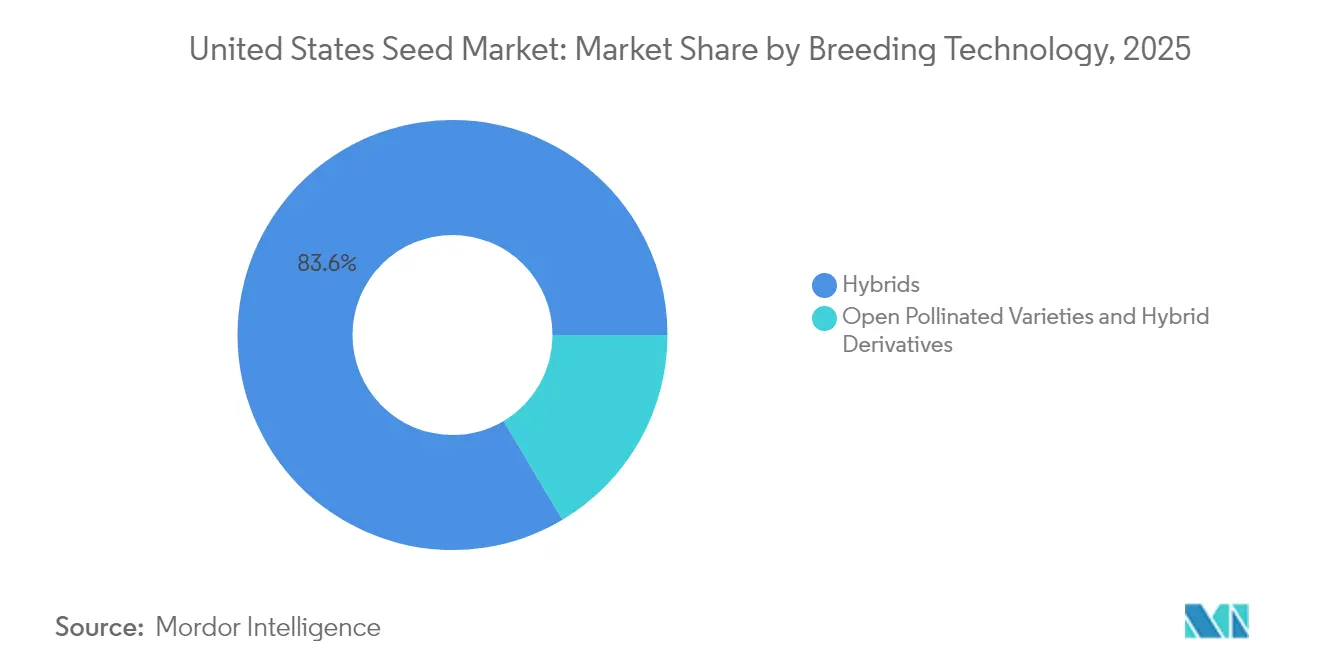
- By breeding technology, hybrids led with an 83.55% United States seed market share in 2025, and are projected to expand at a 6.82% CAGR through 2031.
- By cultivation mechanism, open field plantings accounted for 92.90% of the United States seed market size in 2025, and this category is forecast to grow at an 8.21% CAGR between 2026 and 2031.
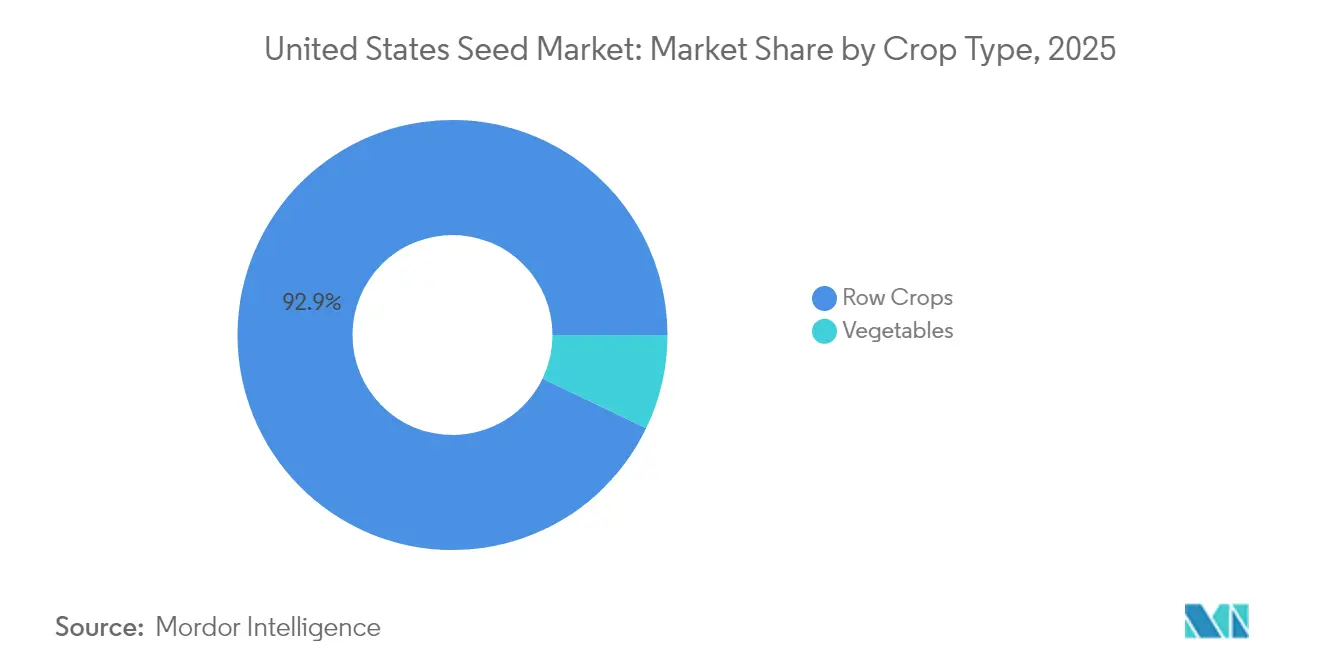
- By crop type, row crops captured 92.85% of the United States seed market share in 2025, while vegetables are set to advance at a 10.26% CAGR to 2031.
- The top five players accounted for 57.00% of the United States seed market share in 2025.
Note: Market size and forecast figures in this report are generated using Mordor Intelligence’s proprietary estimation framework, updated with the latest available data and insights as of 2026.
United States Seed Market Trends and Insights
Drivers Impact Analysis*
| Driver | (~) % Impact on CAGR Forecast | Geographic Relevance | Impact Timeline |
|---|---|---|---|
| Adoption of herbicide-tolerant soybean and corn hybrids | +1.2% | Midwest Corn Belt and Great Plains | Medium term (2-4 years) |
| Growing demand for drought-resistant traits in Southern Plains | +0.9% | Texas, Oklahoma, Kansas, and Nebraska | Short term (≤ 2 years) |
| Precision-agriculture seed prescriptions boosting replacement cycles | +1.5% | Iowa, Illinois, Indiana, and Minnesota | Medium term (2-4 years) |
| Surge in domestic biofuel feedstock programs | +1.1% | Corn Belt states and renewable-fuel corridors | Long term (≥ 4 years) |
| Carbon-credit programs rewarding cover-crop seed sales | +0.8% | Iowa, Illinois, and Ohio with national roll-out | Medium term (2-4 years) |
| Gene-editing (CRISPR) approvals accelerating trait launches | +1.4% | Nationwide | Long term (≥ 4 years) |
| Source: Mordor Intelligence | |||
Adoption of Herbicide-Tolerant Soybean and Corn Hybrids
Herbicide-tolerant traits commanded 94% soybean and 89% corn adoption in 2024, driven by stacked systems that address glyphosate resistance.[3]Source: National Agricultural Statistics Service, “Chemical Use Surveys,” NASS.USDA.gov New dicamba formulations cleared by the Environmental Protection Agency (EPA) in 2024 reduced volatility concerns, enabling a 23% annual jump in dicamba-tolerant seed sales. Seed firms now bundle trait licenses with digital scouting tools that flag resistance hot spots and reinforce customer loyalty. Competitive focus is shifting toward three-way tolerance packages designed to slow resistance evolution over the next decade.
Growing demand for drought-resistant traits in Southern Plains
Back-to-back drought years lifted demand for drought-tolerant corn and sorghum, which captured 31% of regional acreage in 2024, up from 18% in 2022. Yield advantages of 8-12% under limited irrigation raise revenue even after premium seed prices. USDA Climate Hubs financed field demos that let growers compare water use in side-by-side strips, accelerating adoption. Regional millers now pay bonuses for stable protein in drought years, giving farmers an extra economic nudge. Seed companies respond by stacking native drought alleles with herbicide tolerance to widen the fit across soil types.
Precision-Agriculture Seed Prescriptions Boosting Replacement Cycles
Variable-rate prescriptions boosted seed rates 12-15% per acre relative to uniform planting in 2024, driving higher replacement frequency. Climate FieldView and Granular merge soil layers, weather forecasts, and yield maps to flag underperforming hybrids at the sub-field level. Growers who access these analytics swap varieties 18 months sooner than peers who rely on county trial data. Frequent switching encourages premium pricing for high-potential genetics yet keeps pressure on developers to prove year-over-year gains. The trend also increases demand for digitally enabled small-lot seed packaging that fits zone-specific prescriptions.
Surge in Domestic Biofuel Feedstock Programs
Section 45Z of the Internal Revenue Code starts in 2025 and links tax credits to lifecycle carbon scores, lifting demand for high-starch corn and high-oil soybean hybrids valued at USD 2.3 billion in annual seed sales. Renewable diesel and sustainable aviation fuel projects under construction in Iowa and the Gulf Coast require steady feedstock expansion through 2030. Many plants contract forward acres, guaranteeing premiums that offset higher seed costs. Developers now promote hybrids with traits that enhance crush yields or fermentation efficiency, tying genetics directly to processor margins. State blending mandates in California and Minnesota reinforce the volume outlook and reduce demand risk.
Restraints Impact Analysis*
| Restraint | (~) % Impact on CAGR Forecast | Geographic Relevance | Impact Timeline |
|---|---|---|---|
| Consolidation-driven seed price inflation | −0.7% | National commodity regions | Short term (≤ 2 years) |
| Patent-expiry litigation on blockbuster traits | −0.5% | Major soybean and corn areas | Medium term (2-4 years) |
| Tight on-farm liquidity after 2023 commodity price dip | −0.9% | Grain-dependent Midwest and Plains | Short term (≤ 2 years) |
| Regulatory uncertainty over gene-edited crops at state level | −0.4% | California and Vermont | Long term (≥ 4 years) |
| Source: Mordor Intelligence | |||
Patent-Expiry Litigation on Blockbuster Traits
First-generation glyphosate-tolerant soybeans and insect-resistant corn traits begin to lose patent protection in 2025, creating scope for generic entry. Innovators have filed infringement suits and data-package claims that may delay copycat launches by two or more seasons. Legal uncertainty discourages wholesalers from committing early volume to off-patent lines. Farmers face confusion over stewardship rules, which could slow switching even when cheaper traits reach the market. Extended litigation keeps seed costs elevated longer than pure patent timelines suggest.
Regulatory Uncertainty over Gene-Edited Crops at State Level
While APHIS provides a clear federal path, several states, led by California and Vermont, debate labeling or outright sales restrictions on gene-edited seeds. Varied rules generate compliance complexity and raise distribution costs for multi-state dealers. Some processors fear supply-chain fragmentation and request segregation of edited and non-edited grain, adding identity-preservation expenses. Seed firms may postpone launches until a harmonized approach emerges, especially for minor crops where state volume matters. Ongoing uncertainty shaves near-term growth potential for the newest breeding platforms.
*Our forecasts treat driver/restraint impacts as directional, not additive. The impact forecasts reflect baseline growth, mix effects, and variable interactions.
Segment Analysis
By Breeding Technology: Hybrids Drive Innovation Adoption
Hybrids held an 83.55% United States seed market share in 2025 and are forecast to post a 6.82% CAGR to 2031, reflecting farmer confidence in yield stability. Transgenic hybrids incorporating stacked herbicide tolerance and insect resistance command price premiums that underpin segment value growth. Non-transgenic hybrids remain important for organic and export-sensitive channels, although they trail commercial hybrids by 15-20% in yield. Rapid gene-editing under the SECURE rule accelerates trait introgression, contributing to the segment’s growth trajectory.
Growth momentum contrasts with the 4.2% CAGR seen between 2019 and 2024 because growers now prioritize genetics that combine yield, stress tolerance, and herbicide flexibility. The United States seed market size attributable to hybrids is projected to reach USD 25.74 billion by 2031, supported by continued investment in molecular breeding platforms.


By Cultivation Mechanism: Open Field Expansion Outpaces Protected System
Protected cultivation commands 7.10% market share in 2025, reflecting the dominance of field-based agriculture in the United States, yet open field cultivation is experiencing the fastest growth at 8.21% CAGR, driven by precision agriculture adoption and climate-adapted variety development. This apparent contradiction reflects measurement methodology differences, where protected cultivation includes controlled environment agriculture for high-value crops like vegetables and specialty seeds, while open field growth represents expansion in traditional row crop acreage and intensity of seed use per acre.
The shift toward open field intensification reflects economic pressures that favor scalable production systems over capital-intensive protected cultivation, particularly as precision agriculture technologies enable field-based optimization previously available only in controlled environments. Climate change adaptation strategies are driving demand for field-tested genetics that perform under variable weather conditions, supporting the development of resilient varieties suited to open field production challenges.
By Crop Type: Row Crops Dominate While Specialty Segments Accelerate
Row crops delivered 92.85% of the United States seed market revenue in 2025 and will expand at a 6.88% CAGR through 2031. Corn and soybean seeds draw demand from biofuel mandates and animal-feed requirements, with stacked traits boosting per-unit prices. High-oleic soybean varieties also earn premiums of USD 0.50-0.75 per bushel. Fiber crops such as cotton rely on pest-resistant genetics to safeguard yields in the Southeast.
Vegetable seeds account for a smaller share but are gaining ground at double-digit rates as consumer demand for fresh and local produce climbs. Pulses are emerging in response to plant-protein popularity, encouraging breeders to optimize food-grade traits. Specialty crop growth supports diversification and reduces reliance on commodity price cycles.
Geography Analysis
The Midwest Corn Belt represents the largest portion of the United States seed market revenue, anchored by dense corn and soybean rotations that rely on high-value hybrids. The Great Plains states form a significant segment, with drought-tolerant genetics serving as a strategic priority due to variable rainfall. California contributes substantially to the market worth, underscoring the high per-acre seed spending for vegetables and orchard crops that support the state's robust farm economy.
The Southeast demonstrates strong regional growth potential through the forecast period as heat-tolerant cotton and vegetable varieties attract investment. Cover-crop programs linked to carbon markets are adding incremental seed demand across Indiana, Iowa, and Illinois. The Pacific Northwest accounts for a smaller share of revenue, focusing on export-quality wheat and specialty potatoes, with breeders emphasizing traits that satisfy foreign quality specifications.
Emerging policy differences also influence geography: California's Proposition 12 and Vermont's gene-edited labeling laws impose unique compliance requirements, nudging seed companies to develop region-specific portfolios. USDA funding under the Climate-Smart Commodities initiative injects additional momentum by subsidizing sustainable practice adoption that depends on specialized seed varieties.
Competitive Landscape
The United States seed market records a moderate concentration level. Corteva Agriscience leverages its Pioneer dealer network to sustain the largest share, while Bayer AG taps Climate FieldView to integrate digital insights into seed selection. Syngenta Group’s 2025 acquisition of Beck’s Hybrids broadens the Midwestern reach and supplies a direct-to-farmer model attractive to growers who value local testing.
BASF SE launched its first CRISPR-edited soybean variety in 2025 after APHIS confirmed non-regulated status, reflecting how gene-editing accelerates commercialization. KWS SAAT SE and Co. KGaA’s Nebraska breeding center focuses on drought-adapted corn, highlighting regional specialization. Technology platforms that combine genetics with agronomic data strengthen customer lock-in and create recurring revenue across input categories.
Patent expiries beginning in 2025 trigger generics competition for Roundup Ready traits, giving smaller firms access to established modes of action. The Federal Trade Commission’s scrutiny of mergers is steering majors toward research partnerships rather than megadeals, opening ecosystem roles for analytics firms and trait-discovery startups.
United States Seed Industry Leaders
BASF SE
Bayer AG
Corteva Agriscience
Land O’Lakes Inc.
Syngenta Group
- *Disclaimer: Major Players sorted in no particular order

Recent Industry Developments
- October 2025: Corteva announced plans to separate into two independent public companies, with one company specializing in crop protection and the other in seeds and traits. This separation aims to improve operational efficiency and increase value across its U.S. and global agricultural operations.
- February 2025: Namdhari Seeds acquired 100% of Axia's U.S.-based open-field vegetable seed business, expanding its global operations. The acquisition includes breeding rights and enhances Namdhari's presence in key export markets, including Mexico and the United States.


United States Seed Market Report Scope
Hybrids, Open Pollinated Varieties & Hybrid Derivatives are covered as segments by Breeding Technology. Open Field, Protected Cultivation are covered as segments by Cultivation Mechanism. Row Crops, Vegetables are covered as segments by Crop Type.Breeding Technology
| Hybrids | Non-Transgenic Hybrids | |
| Transgenic Hybrids | Herbicide Tolerant Hybrids | |
| Insect Resistant Hybrids | ||
| Other Traits | ||
| Open Pollinated Varieties and Hybrid Derivatives | ||
Cultivation Mechanism
| Open Field |
| Protected Cultivation |
Crop Type
| Row Crops | Fiber Crops | Cotton |
| Other Fiber Crops | ||
| Forage Crops | Alfalfa | |
| Forage Corn | ||
| Forage Sorghum | ||
| Other Forage Crops | ||
| Grains and Cereals | Corn | |
| Rice | ||
| Sorghum | ||
| Wheat | ||
| Other Grains and Cereals | ||
| Oilseeds | Canola, Rapeseed, and Mustard | |
| Soybean | ||
| Sunflower | ||
| Other Oilseeds | ||
| Pulses | ||
| Vegetables | Brassicas | Cabbage |
| Cauliflower and Broccoli | ||
| Other Brassicas | ||
| Cucurbits | Cucumber and Gherkin | |
| Pumpkin and Squash | ||
| Other Cucurbits | ||
| Roots and Bulbs | Garlic | |
| Onion | ||
| Potato | ||
| Other Roots and Bulbs | ||
| Solanaceae | Chilli | |
| Eggplant | ||
| Tomato | ||
| Other Solanaceae | ||
| Unclassified Vegetables | Asparagus | |
| Lettuce | ||
| Okra | ||
| Peas | ||
| Spinach | ||
| Other Unclassified Vegetables | ||
| Breeding Technology | Hybrids | Non-Transgenic Hybrids | |
| Transgenic Hybrids | Herbicide Tolerant Hybrids | ||
| Insect Resistant Hybrids | |||
| Other Traits | |||
| Open Pollinated Varieties and Hybrid Derivatives | |||
| Cultivation Mechanism | Open Field | ||
| Protected Cultivation | |||
| Crop Type | Row Crops | Fiber Crops | Cotton |
| Other Fiber Crops | |||
| Forage Crops | Alfalfa | ||
| Forage Corn | |||
| Forage Sorghum | |||
| Other Forage Crops | |||
| Grains and Cereals | Corn | ||
| Rice | |||
| Sorghum | |||
| Wheat | |||
| Other Grains and Cereals | |||
| Oilseeds | Canola, Rapeseed, and Mustard | ||
| Soybean | |||
| Sunflower | |||
| Other Oilseeds | |||
| Pulses | |||
| Vegetables | Brassicas | Cabbage | |
| Cauliflower and Broccoli | |||
| Other Brassicas | |||
| Cucurbits | Cucumber and Gherkin | ||
| Pumpkin and Squash | |||
| Other Cucurbits | |||
| Roots and Bulbs | Garlic | ||
| Onion | |||
| Potato | |||
| Other Roots and Bulbs | |||
| Solanaceae | Chilli | ||
| Eggplant | |||
| Tomato | |||
| Other Solanaceae | |||
| Unclassified Vegetables | Asparagus | ||
| Lettuce | |||
| Okra | |||
| Peas | |||
| Spinach | |||
| Other Unclassified Vegetables | |||


Market Definition
- Commercial Seed - For the purpose of this study, only commercial seeds have been included as part of the scope. Farm-saved Seeds, which are not commercially labeled are excluded from scope, even though a minor percentage of farm-saved seeds are exchanged commercially among farmers. The scope also excludes vegetatively reproduced crops and plant parts, which may be commercially sold in the market.
- Crop Acreage - While calculating the acreage under different crops, the Gross Cropped Area has been considered. Also known as Area Harvested, according to the Food & Agricultural Organization (FAO), this includes the total area cultivated under a particular crop across seasons.
- Seed Replacement Rate - Seed Replacement Rate is the percentage of area sown out of the total area of crop planted in the season by using certified/quality seeds other than the farm-saved seed.
- Protected Cultivation - The report defines protected cultivation as the process of growing crops in a controlled environment. This includes greenhouses, glasshouses, hydroponics, aeroponics, or any other cultivation system that protects the crop against any abiotic stress. However, cultivation in an open field using plastic mulch is excluded from this definition and is included under open field.
| Keyword | Definition |
|---|---|
| Row Crops | These are usually the field crops which include the different crop categories like grains & cereals, oilseeds, fiber crops like cotton, pulses, and forage crops. |
| Solanaceae | These are the family of flowering plants which includes tomato, chili, eggplants, and other crops. |
| Cucurbits | It represents a gourd family consisting of about 965 species in around 95 genera. The major crops considered for this study include Cucumber & Gherkin, Pumpkin and squash, and other crops. |
| Brassicas | It is a genus of plants in the cabbage and mustard family. It includes crops such as carrots, cabbage, cauliflower & broccoli. |
| Roots & Bulbs | The roots and bulbs segment includes onion, garlic, potato, and other crops. |
| Unclassified Vegetables | This segment in the report includes the crops which don’t belong to any of the above-mentioned categories. These include crops such as okra, asparagus, lettuce, peas, spinach, and others. |
| Hybrid Seed | It is the first generation of the seed produced by controlling cross-pollination and by combining two or more varieties, or species. |
| Transgenic Seed | It is a seed that is genetically modified to contain certain desirable input and/or output traits. |
| Non-Transgenic Seed | The seed produced through cross-pollination without any genetic modification. |
| Open-Pollinated Varieties & Hybrid Derivatives | Open-pollinated varieties produce seeds true to type as they cross-pollinate only with other plants of the same variety. |
| Other Solanaceae | The crops considered under other Solanaceae include bell peppers and other different peppers based on the locality of the respective countries. |
| Other Brassicaceae | The crops considered under other brassicas include radishes, turnips, Brussels sprouts, and kale. |
| Other Roots & Bulbs | The crops considered under other roots & bulbs include Sweet Potatoes and cassava. |
| Other Cucurbits | The crops considered under other cucurbits include gourds (bottle gourd, bitter gourd, ridge gourd, Snake gourd, and others). |
| Other Grains & Cereals | The crops considered under other grains & cereals include Barley, Buck Wheat, Canary Seed, Triticale, Oats, Millets, and Rye. |
| Other Fibre Crops | The crops considered under other fibers include Hemp, Jute, Agave fibers, Flax, Kenaf, Ramie, Abaca, Sisal, and Kapok. |
| Other Oilseeds | The crops considered under other oilseeds include Ground nut, Hempseed, Mustard seed, Castor seeds, safflower seeds, Sesame seeds, and Linseeds. |
| Other Forage Crops | The crops considered under other forages include Napier grass, Oat grass, White clover, Ryegrass, and Timothy. Other forage crops were considered based on the locality of the respective countries. |
| Pulses | Pigeon peas, Lentils, Broad and horse beans, Vetches, Chickpeas, Cowpeas, Lupins, and Bambara beans are the crops considered under pulses. |
| Other Unclassified Vegetables | The crops considered under other unclassified vegetables include Artichokes, Cassava Leaves, Leeks, Chicory, and String beans. |


Research Methodology
Mordor Intelligence follows a four-step methodology in all our reports.
- Step-1: IDENTIFY KEY VARIABLES: In order to build a robust forecasting methodology, the variables and factors identified in Step-1 are tested against available historical market numbers. Through an iterative process, the variables required for market forecast are set and the model is built on the basis of these variables.
- Step-2: Build a Market Model: Market-size estimations for the forecast years are in nominal terms. Inflation is not a part of the pricing, and the average selling price (ASP) is kept constant throughout the forecast period.
- Step-3: Validate and Finalize: In this important step, all market numbers, variables and analyst calls are validated through an extensive network of primary research experts from the market studied. The respondents are selected across levels and functions to generate a holistic picture of the market studied.
- Step-4: Research Outputs: Syndicated Reports, Custom Consulting Assignments, Databases, and Subscription Platforms


