Market Overview
| Study Period | 2018 - 2031 |
|---|---|
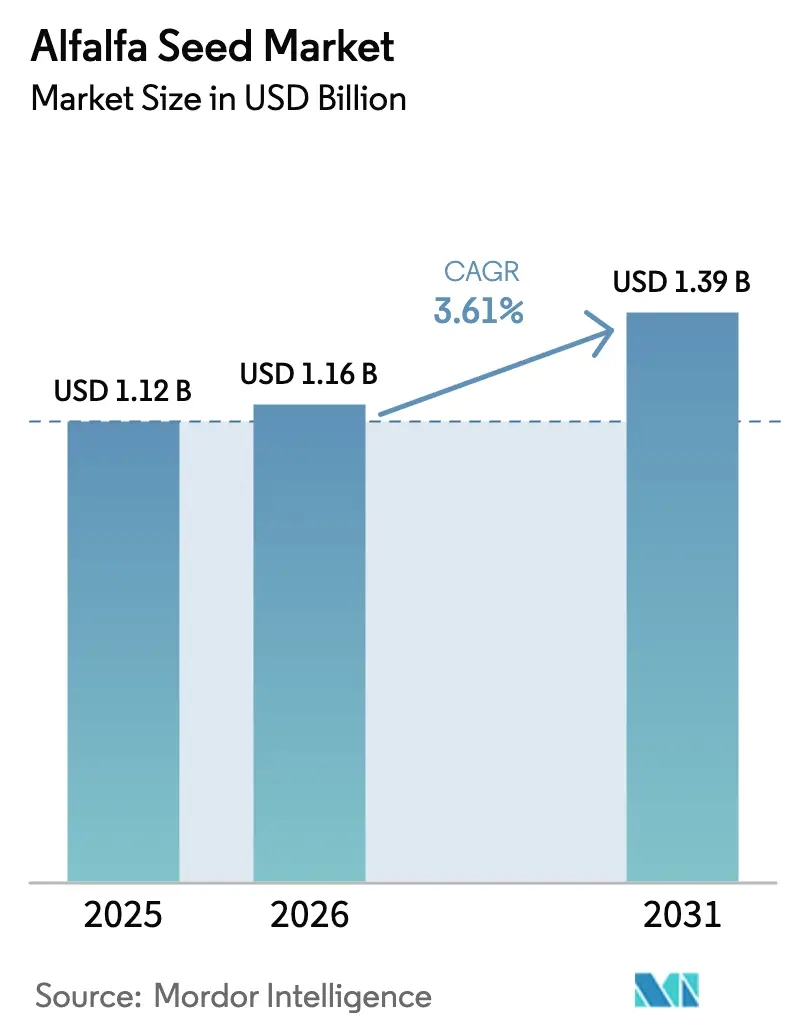
| Market Size (2026) | USD 1.16 Billion |
| Market Size (2031) | USD 1.39 Billion |
| Growth Rate (2026 - 2031) | 3.61% CAGR |
| Fastest Growing Market | Middle East |
| Largest Market | Europe |
| Market Concentration | Low |
Major Players *Disclaimer: Major Players sorted in no particular order Image © Mordor Intelligence. Reuse requires attribution under CC BY 4.0. | |
Alfalfa Seed Market Analysis by Mordor Intelligence
The alfalfa seed market size is expected to grow from USD 1.12 billion in 2025 to USD 1.16 billion in 2026 and is forecast to reach USD 1.39 billion by 2031 at 3.61% CAGR over 2026-2031. Intensifying demand for dairy protein, expanding grass-fed and organic meat value chains, and farmers interest in climate-resilient varieties are accelerating varietal upgrades across every major producing region. Leading seed companies are rationalizing brand portfolios, channel strategies, and digital agronomy tools to defend margins while responding to shifting regulatory landscapes that increasingly reward methane-reducing feed crops. On-farm economics also favor premium hybrids as improved stand persistence and yield stability offset higher seed outlays, particularly where water scarcity and heat stress threaten conventional varieties. Meanwhile, governments in Europe and the Middle East are using incentive programs, import rules, and sustainability labeling schemes to pull advanced genetics into mainstream forage systems.
Key Report Takeaways
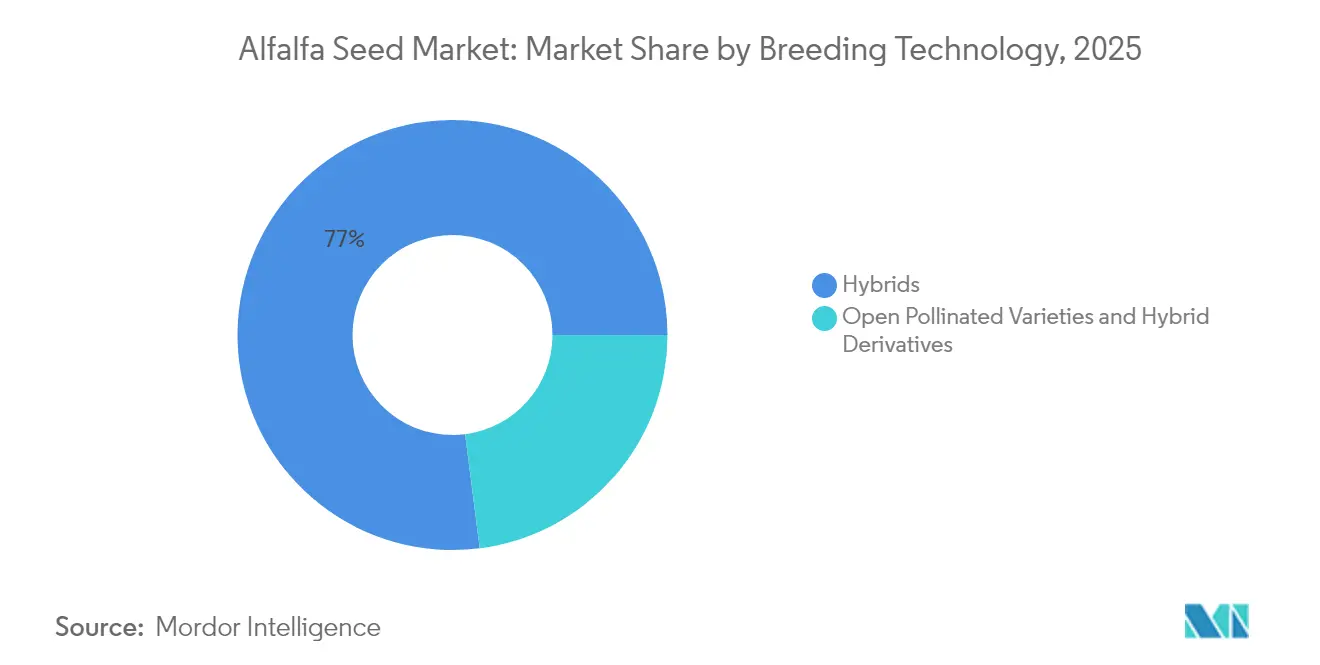
- By breeding technology, hybrids accounted for 77.02% of the alfalfa seed market share in 2025 and are projected to advance at a 3.77% CAGR through 2031.
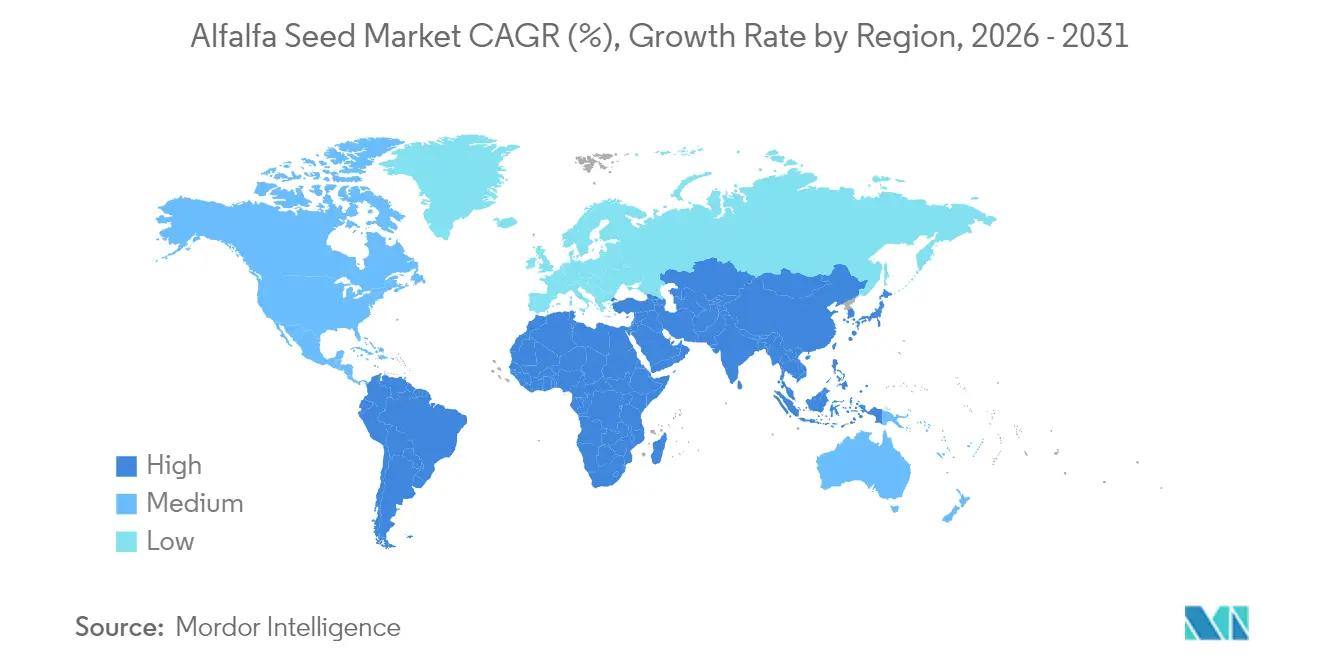
- By geography, Europe led with 40.02% of the alfalfa seed market size in 2025, and the Middle East is forecast to post the fastest 6.74% CAGR to 2031.
Note: Market size and forecast figures in this report are generated using Mordor Intelligence’s proprietary estimation framework, updated with the latest available data and insights as of 2026.
Global Alfalfa Seed Market Trends and Insights
Drivers Impact Analysis*
| Driver | (~) % Impact on CAGR Forecast | Geographic Relevance | Impact Timeline |
|---|---|---|---|
| Rising global demand for dairy-based protein | +1.2% | Global, with a concentration in Asia-Pacific and Europe | Medium term (2-4 years) |
| Rapid adoption of high-yielding forage hybrids | +0.8% | North America and Europe core, expanding to South America | Short term (≤ 2 years) |
| Growth in grass-fed and organic meat value chains | +0.5% | North America and Europe, and emerging in the Asia-Pacific | Long term (≥ 4 years) |
| Climate-resilient varieties for regenerative farming | +0.7% | Global, with early adoption in drought-prone regions | Medium term (2-4 years) |
| Digitally enabled forage-specific advisory platforms | +0.3% | North America and Europe initially, scaling globally | Long term (≥ 4 years) |
| Government incentives for methane-reducing feed crops | +0.4% | Europe and North America, expanding to Asia-Pacific | Medium term (2-4 years) |
| Source: Mordor Intelligence | |||
Rising Global Demand for Dairy-Based Protein
Global milk processors are locking in higher-protein forage contracts, pushing the alfalfa seed market toward cultivars that reliably exceed crude protein on a dry-matter basis. China’s planted alfalfa area is flourishing as policymakers seek domestic feed self-sufficiency, while European buyers tighten feed specifications to underpin traceability claims. These trends increase premiums for seed lots with certified germination and purity records, redirecting breeder investments toward protein-dense leaf traits. Researchers also report early-stage pilot plants that extract plant-based protein concentrates from alfalfa, hinting at new processing channels that could further widen seed demand once commercial viability improves.
Rapid Adoption of High-Yielding Forage Hybrids
Hybrid alfalfa delivers stand yields 15-20% above standard open-pollinated lines under optimal conditions, a gap that widens further in stress environments[1]Source: University of California Agriculture and Natural Resources, “Alfalfa – UC-Impalo-WF,” ucanr.edu . Producers therefore accept seed list prices 20-30% higher as lower replant frequency reduces lifetime cost per ton of forage harvested. Major firms are fast-tracking molecular marker selection and genomic prediction pipelines to shorten product cycles and fine-tune regional adaptation. Corteva, for example, retained its Alforex brand inside a revamped multi-channel seed strategy to protect specialized breeding investments while simplifying upstream operations[2]Source: Corteva Agriscience, “New U.S. Multi-Channel, Multi-Brand Seed Strategy,” corteva.com.
Growth in Grass-Fed and Organic Meat Value Chains
Retail demand for verified grass-fed and organic proteins translates into higher farm-gate premiums, supporting alfalfa seed premiums for certified organic lots in mature markets. Organic standards mandate three-year field transitions and prohibit genetically engineered events, confining production to specialist growers who can maintain strict isolation distances and compliance records. Breeders respond by stacking traits that extend grazing windows, boost leaf-to-stem ratios, and quicken regrowth after harvest, directly feeding grass-finished beef and organic dairy programs. Because organic supply shortages frequently occur, investors continue to back independent companies that focus solely on this niche despite broader industry consolidation.
Climate-Resilient Varieties for Regenerative Farming
Water scarcity and heat stress intensify variety turnover, particularly in the U.S. Southwest, parts of Australia, and across the Mediterranean rim. Public-sector programs, including a grant to the University of California Davis, demonstrate how cooperative funding accelerates drought-tolerance breeding, with six to ten experimental cultivars entering field trials by 2027. Seed lines featuring deep rooting profiles, enhanced nitrogen fixation, and superior mycorrhizal associations are increasingly marketed as building blocks for regenerative rotations that cut synthetic fertilizer needs. In practice, regenerative acreage growth strengthens the alfalfa seed market because multi-year forage stands help restore soil organic matter between cash crops.
Restraints Impact Analysis*
| Restraint | (~) % Impact on CAGR Forecast | Geographic Relevance | Impact Timeline |
|---|---|---|---|
| Regulatory uncertainty around transgenic forages | -0.6% | North America and Europe primarily | Short term (≤ 2 years) |
| Volatility in forage seed prices due to weather shocks | -0.4% | Global, with a concentration in major production regions | Short term (≤ 2 years) |
| Limited cold-chain in emerging forage seed markets | -0.3% | Asia-Pacific and Africa primarily | Medium term (2-4 years) |
| Farmer's reluctance to switch from saved seed | -0.2% | Global, particularly in developing markets | Long term (≥ 4 years) |
| Source: Mordor Intelligence | |||
Regulatory Uncertainty Around Transgenic Forages
HarvXtra alfalfa, containing combined herbicide-tolerant and reduced-lignin traits, still operates under domestic-use agreements across 11 western U.S. states, preventing hay or seed exports to regions lacking event approval. Comparable restrictions in the European Union block commercial release, forcing seed distributors to maintain dual product lines and inflating inventory costs. Isolation distances approaching 900 feet for foundation seed lots impose further logistical complexity for multipurpose farms, ultimately slowing adoption even where regulatory consent exists.
Volatility in Forage Seed Price Due to Weather Shocks
Seed production clusters rely on predictable late-summer drying conditions; deviations such as 2024’s El Niño weather reduced harvestable seed in Washington and parts of Argentina. Because a limited group of microclimates dominates certified seed output, any localized drought, hail, or unseasonal rainfall removes significant supply from the trade, driving spot-market price spikes that deter forward-buying by farmers. Coupled with rising pollination service fees as honey-bee losses continue, weather variability remains a structural headwind for the alfalfa seed market.
*Our forecasts treat driver/restraint impacts as directional, not additive. The impact forecasts reflect baseline growth, mix effects, and variable interactions.
Segment Analysis
By Breeding Technology: Hybrids Preserve Growth Leadership
Hybrids retained 77.02% alfalfa seed market share in 2025 and are on track for a 3.77% CAGR to 2031, underpinning the largest slice of the alfalfa seed market size in 2025. Strong heterosis drives higher dry-matter yields per acre, while improved pest and disease tolerance reduces stand loss risk. Non-transgenic hybrids lead export-oriented sales because buyers avoid genetically engineered events, although transgenic lines dominate U.S. domestic sales where regulatory acceptance allows glyphosate-based weed control. Premium pricing remains sustainable as growers calculate lower replant costs over a stand life that frequently exceeds five production years. Breeding programs rapidly integrate molecular markers, allowing companies to release drought-tolerant or salt-tolerant hybrids within shorter research cycles.
Open-pollinated and hybrid derivatives represent a good share of the alfalfa seed market size in 2025. Adoption persists in cost-sensitive geographies and certified organic systems where hybrid premiums cannot be recouped. Synthetic varieties that blend multiple parental lines offer incremental yield gains yet lack the uniformity demanded by large dairy operations, limiting uptake. Nonetheless, public-sector breeding continues to support these categories to preserve genetic diversity and local adaptation, ensuring smallholder relevance even as hybrids dominate globalized supply chains.


Geography Analysis
Europe held 40.02% of the alfalfa seed market share in 2025. Environmental regulations and sophisticated dairy supply chains require seed lots with documented traceability, certified germination, and zero transgenic content, creating consistent demand for premium hybrids and organic varieties. Germany, France, and the Netherlands collectively consume more than one-third of regional volume, while Eastern European countries adopt climate-tolerant lines to stabilize yields during hotter summers. Precision farming incentives within the EU’s Common Agricultural Policy encourage variable-rate seeding and digital field recordkeeping, placing seed companies with data-rich advisory platforms at a competitive advantage.
The Middle East registers the fastest 6.74% CAGR. Government-sponsored food security strategies, such as Saudi Arabia’s Vision 2030, finance protected-culture systems and deficit-irrigation research that prioritize drought-tolerant cultivars. Extreme heat and salinity necessitate varieties with robust stress physiology, creating a market niche for specialized breeders. Progressive water pricing reforms also motivate dairy integrators to shift away from high-water-footprint forage imports toward locally adapted alfalfa, bolstering regional seed demand.
Asia-Pacific offers heterogeneous growth trajectories. China’s dairy-led expansion lifts national alfalfa planting and sustains import demand for Western genetics until domestic breeding pipelines mature. India’s ban on GM alfalfa constrains multinationals but favors public institutes and local firms supplying non-GMO hybrids. Australia remains a key seed exporter to Southeast Asia, leveraging strict phytosanitary protocols and high-grade seed conditioning facilities to penetrate markets that lack large-scale seed production ecosystems.

Competitive Landscape
Market Concentration is low as Bayer AG, Corteva, Inc., and Syngenta Group, DLF A/S, and Royal Barenbrug Group B.V. streamlined brand portfolios to cut overhead and refocus R&D budgets on high-value trait platforms. Bayer retired 10 regional seed brands and will redirect marketing around the Channel to raise marketing efficiency. Corteva’s revamped multi-brand strategy maintains Alforex for forage genetics while collapsing smaller corn and soybean lines, illustrating the strategic importance of alfalfa inside a diversified seed offering. Global leaders combine deep germplasm libraries, trait licensing agreements, and digital farming partnerships to differentiate in mature markets where acreage expansion is limited.
Regional specialists such as Royal Barenbrug and RAGT Group remain competitive by tailoring products to local agronomic conditions and providing hands-on technical support. Their decentralized production networks reduce supply risk and allow rapid seed delivery when multinational pipelines face regulatory or logistical delays. University of California Davis commenced a three-year drought-tolerant breeding program funded by USD 936,000 in federal grants by the Alfalfa Seed and Alfalfa Forage Research Program within the USDA's National Institute of Food and Agriculture, which supports the development of new alfalfa varieties with improved drought tolerance[3]Source: National Institute of Food and Agriculture, “Developing, Testing, and Implementing Improved Alfalfa Varieties for a Water-Challenged Future,” nifa.usda.gov. Start-ups focusing on certified organic, non-GMO, or regenerative-ready seed leverage niche positioning to attract premium pricing even as they outsource basic seed multiplication to contract growers.
Digital transformation reshapes competitive boundaries. Platforms integrating field sensors, remote imagery, and economic thresholds optimize harvest timing and nutrient management, thereby embedding seed suppliers deeper into customer decision chains. Syngenta and Land O’Lakes pilot subscription services that bundle genetics, crop protection, and data analytics, shifting revenue models toward recurring service income. Companies that combine proprietary traits with granular farm-level insight stand to capture a disproportionate share as value migrates from pure germplasm to integrated solution packages.
Alfalfa Seed Industry Leaders
Bayer AG
Syngenta Group
DLF A/S
Corteva, Inc.
Royal Barenbrug Group B.V.
- *Disclaimer: Major Players sorted in no particular order


Recent Industry Developments
- January 2025: S&W Seed Company reported a strategic focus on premium alfalfa seed varieties with enhanced drought tolerance, targeting expansion in water-stressed regions across the Western United States. The company emphasized the development of proprietary genetics through partnerships with regional breeding programs.
- January 2024: The National Institute of Food and Agriculture (NIFA) modified its processes for distributing FY 2025 grant funds under the Alfalfa Seed and Alfalfa Forage System program to ensure faster disbursement.


Global Alfalfa Seed Market Report Scope
Hybrids, Open Pollinated Varieties & Hybrid Derivatives are covered as segments by Breeding Technology. Africa, Asia-Pacific, Europe, Middle East, North America, South America are covered as segments by Region.Breeding Technology
| Hybrids | Non-Transgenic Hybrids | |
| Transgenic Hybrids | Herbicide Tolerant Hybrids | |
| Insect Resistant Hybrids | ||
| Open Pollinated Varieties & Hybrid Derivatives | ||
Geography
| Africa | By Breeding Technology | |
| By Country | Egypt | |
| Ethiopia | ||
| Ghana | ||
| Kenya | ||
| Nigeria | ||
| South Africa | ||
| Tanzania | ||
| Rest of Africa | ||
| Asia-Pacific | By Breeding Technology | |
| Australia | ||
| Bangladesh | ||
| China | ||
| India | ||
| Japan | ||
| Myanmar | ||
| Pakistan | ||
| Philippines | ||
| Vietnam | ||
| Rest of Asia-Pacific | ||
| Europe | By Breeding Technology | |
| France | ||
| Germany | ||
| Italy | ||
| Netherlands | ||
| Poland | ||
| Romania | ||
| Russia | ||
| Spain | ||
| Turkey | ||
| Ukraine | ||
| United Kingdom | ||
| Rest of Europe | ||
| Middle East | By Breeding Technology | |
| Iran | ||
| Saudi Arabia | ||
| Rest of Middle East | ||
| North America | By Breeding Technology | |
| Canada | ||
| Mexico | ||
| United States | ||
| Rest of North America | ||
| South America | By Breeding Technology | |
| Argentina | ||
| Brazil | ||
| Rest of South America | ||
| Breeding Technology | Hybrids | Non-Transgenic Hybrids | |
| Transgenic Hybrids | Herbicide Tolerant Hybrids | ||
| Insect Resistant Hybrids | |||
| Open Pollinated Varieties & Hybrid Derivatives | |||
| Geography | Africa | By Breeding Technology | |
| By Country | Egypt | ||
| Ethiopia | |||
| Ghana | |||
| Kenya | |||
| Nigeria | |||
| South Africa | |||
| Tanzania | |||
| Rest of Africa | |||
| Asia-Pacific | By Breeding Technology | ||
| Australia | |||
| Bangladesh | |||
| China | |||
| India | |||
| Japan | |||
| Myanmar | |||
| Pakistan | |||
| Philippines | |||
| Vietnam | |||
| Rest of Asia-Pacific | |||
| Europe | By Breeding Technology | ||
| France | |||
| Germany | |||
| Italy | |||
| Netherlands | |||
| Poland | |||
| Romania | |||
| Russia | |||
| Spain | |||
| Turkey | |||
| Ukraine | |||
| United Kingdom | |||
| Rest of Europe | |||
| Middle East | By Breeding Technology | ||
| Iran | |||
| Saudi Arabia | |||
| Rest of Middle East | |||
| North America | By Breeding Technology | ||
| Canada | |||
| Mexico | |||
| United States | |||
| Rest of North America | |||
| South America | By Breeding Technology | ||
| Argentina | |||
| Brazil | |||
| Rest of South America | |||


Market Definition
- Commercial Seed - For the purpose of this study, only commercial seeds have been included as part of the scope. Farm-saved Seeds, which are not commercially labeled are excluded from scope, even though a minor percentage of farm-saved seeds are exchanged commercially among farmers. The scope also excludes vegetatively reproduced crops and plant parts, which may be commercially sold in the market.
- Crop Acreage - While calculating the acreage under different crops, the Gross Cropped Area has been considered. Also known as Area Harvested, according to the Food & Agricultural Organization (FAO), this includes the total area cultivated under a particular crop across seasons.
- Seed Replacement Rate - Seed Replacement Rate is the percentage of area sown out of the total area of crop planted in the season by using certified/quality seeds other than the farm-saved seed.
- Protected Cultivation - The report defines protected cultivation as the process of growing crops in a controlled environment. This includes greenhouses, glasshouses, hydroponics, aeroponics, or any other cultivation system that protects the crop against any abiotic stress. However, cultivation in an open field using plastic mulch is excluded from this definition and is included under open field.
| Keyword | Definition |
|---|---|
| Row Crops | These are usually the field crops which include the different crop categories like grains & cereals, oilseeds, fiber crops like cotton, pulses, and forage crops. |
| Solanaceae | These are the family of flowering plants which includes tomato, chili, eggplants, and other crops. |
| Cucurbits | It represents a gourd family consisting of about 965 species in around 95 genera. The major crops considered for this study include Cucumber & Gherkin, Pumpkin and squash, and other crops. |
| Brassicas | It is a genus of plants in the cabbage and mustard family. It includes crops such as carrots, cabbage, cauliflower & broccoli. |
| Roots & Bulbs | The roots and bulbs segment includes onion, garlic, potato, and other crops. |
| Unclassified Vegetables | This segment in the report includes the crops which don’t belong to any of the above-mentioned categories. These include crops such as okra, asparagus, lettuce, peas, spinach, and others. |
| Hybrid Seed | It is the first generation of the seed produced by controlling cross-pollination and by combining two or more varieties, or species. |
| Transgenic Seed | It is a seed that is genetically modified to contain certain desirable input and/or output traits. |
| Non-Transgenic Seed | The seed produced through cross-pollination without any genetic modification. |
| Open-Pollinated Varieties & Hybrid Derivatives | Open-pollinated varieties produce seeds true to type as they cross-pollinate only with other plants of the same variety. |
| Other Solanaceae | The crops considered under other Solanaceae include bell peppers and other different peppers based on the locality of the respective countries. |
| Other Brassicaceae | The crops considered under other brassicas include radishes, turnips, Brussels sprouts, and kale. |
| Other Roots & Bulbs | The crops considered under other roots & bulbs include Sweet Potatoes and cassava. |
| Other Cucurbits | The crops considered under other cucurbits include gourds (bottle gourd, bitter gourd, ridge gourd, Snake gourd, and others). |
| Other Grains & Cereals | The crops considered under other grains & cereals include Barley, Buck Wheat, Canary Seed, Triticale, Oats, Millets, and Rye. |
| Other Fibre Crops | The crops considered under other fibers include Hemp, Jute, Agave fibers, Flax, Kenaf, Ramie, Abaca, Sisal, and Kapok. |
| Other Oilseeds | The crops considered under other oilseeds include Ground nut, Hempseed, Mustard seed, Castor seeds, safflower seeds, Sesame seeds, and Linseeds. |
| Other Forage Crops | The crops considered under other forages include Napier grass, Oat grass, White clover, Ryegrass, and Timothy. Other forage crops were considered based on the locality of the respective countries. |
| Pulses | Pigeon peas, Lentils, Broad and horse beans, Vetches, Chickpeas, Cowpeas, Lupins, and Bambara beans are the crops considered under pulses. |
| Other Unclassified Vegetables | The crops considered under other unclassified vegetables include Artichokes, Cassava Leaves, Leeks, Chicory, and String beans. |


Research Methodology
Mordor Intelligence follows a four-step methodology in all our reports.
- Step-1: IDENTIFY KEY VARIABLES: In order to build a robust forecasting methodology, the variables and factors identified in Step-1 are tested against available historical market numbers. Through an iterative process, the variables required for market forecast are set and the model is built on the basis of these variables.
- Step-2: Build a Market Model: Market-size estimations for the forecast years are in nominal terms. Inflation is not a part of the pricing, and the average selling price (ASP) is kept constant throughout the forecast period.
- Step-3: Validate and Finalize: In this important step, all market numbers, variables and analyst calls are validated through an extensive network of primary research experts from the market studied. The respondents are selected across levels and functions to generate a holistic picture of the market studied.
- Step-4: Research Outputs: Syndicated Reports, Custom Consulting Assignments, Databases, and Subscription Platforms


