Wheat Seed Market Size and Share
Market Overview
| Study Period | 2021 - 2031 |
|---|---|
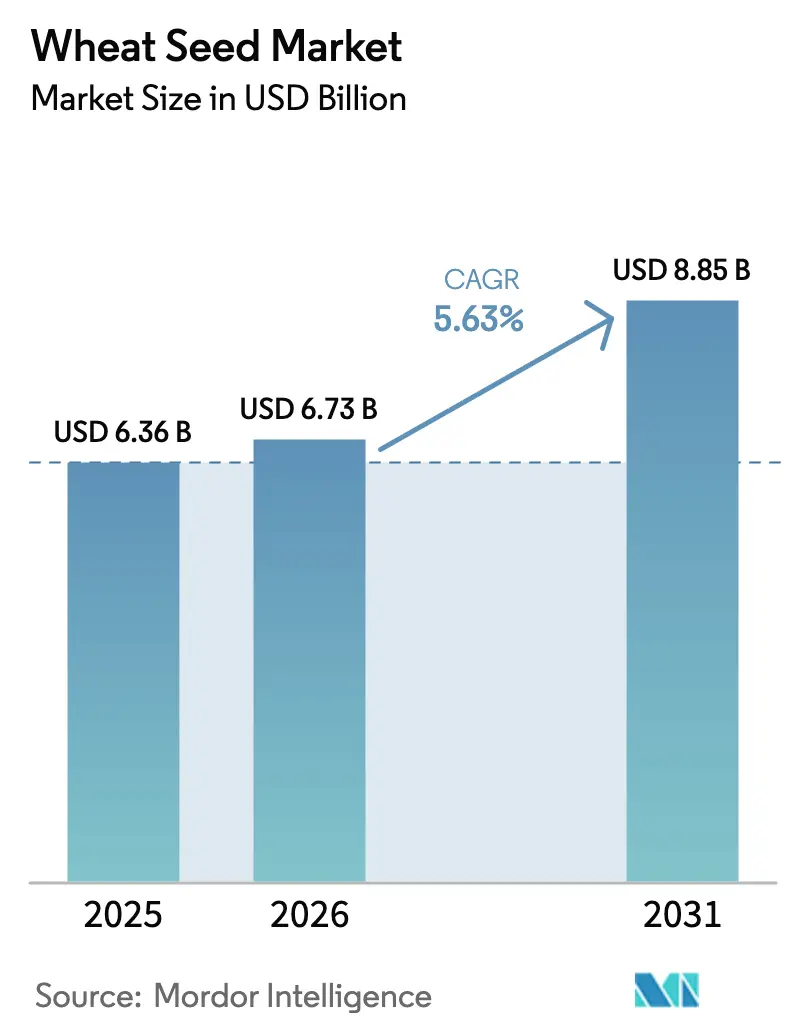
| Market Size (2026) | USD 6.73 Billion |
| Market Size (2031) | USD 8.85 Billion |
| Growth Rate (2026 - 2031) | 5.63% CAGR |
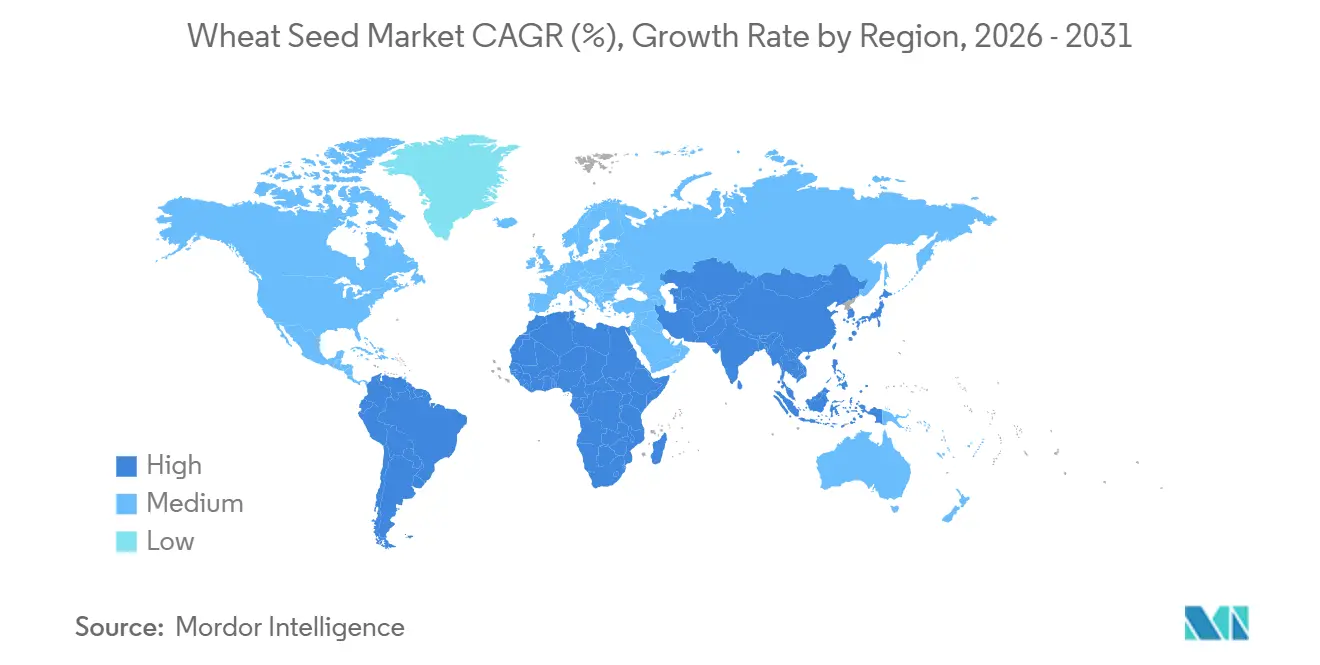
| Fastest Growing Market | South America |
| Largest Market | Europe |
| Market Concentration | Medium |
Major Players *Disclaimer: Major Players sorted in no particular order Image © Mordor Intelligence. Reuse requires attribution under CC BY 4.0. | |
Wheat Seed Market Analysis by Mordor Intelligence
The wheat seed market size was valued at USD 6.36 billion in 2025 and estimated to grow from USD 6.73 billion in 2026 to reach USD 8.85 billion by 2031, at a CAGR of 5.63% during the forecast period (2026-2031). Structural shifts in breeding technology, rising farmer purchasing power in Asia-Pacific, and broader adoption of premium seed treatments are lifting demand in both developed and emerging production hubs. Multilateral lenders now link credit lines to climate-resilient genetics, creating a compliance-driven pull for certified seed that further widens the formal channel of the wheat seed market. Digital traceability platforms are unlocking varietal authenticity premiums in export-oriented supply chains, while gene-editing tools accelerate trait deployment and compress product-launch cycles.
Key Report Takeaways
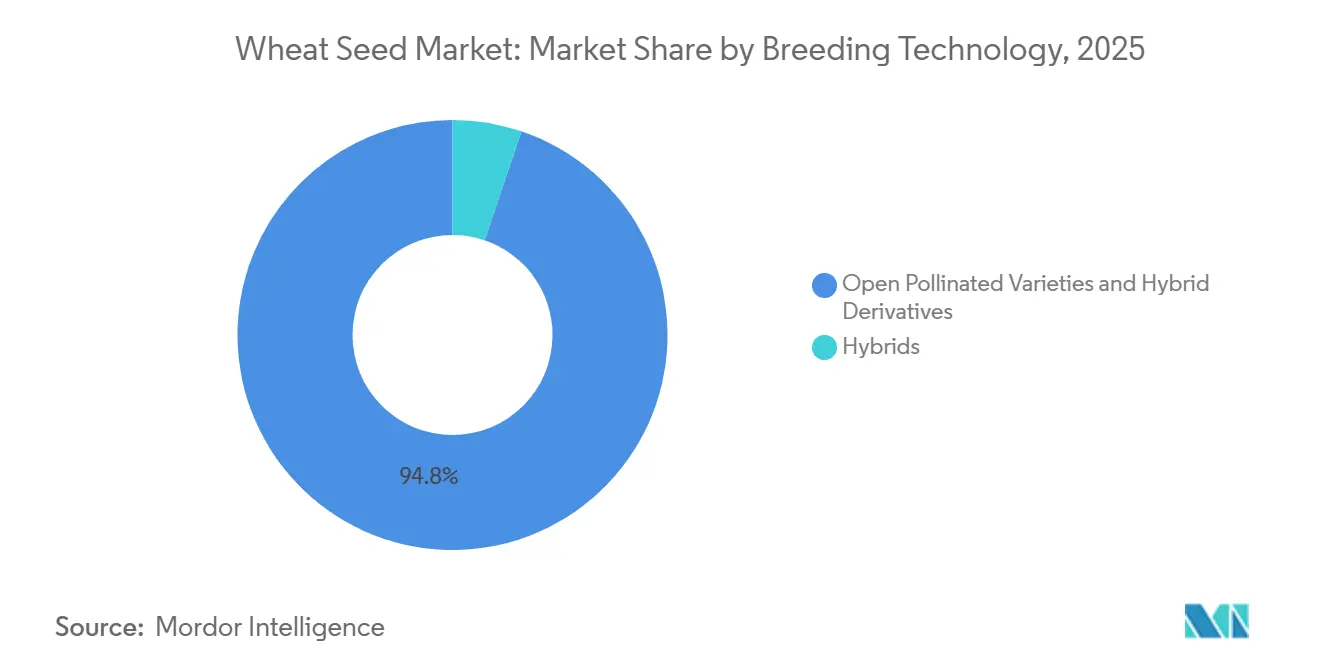
- By breeding technology, open-pollinated varieties and hybrid derivatives held 94.8% of the wheat seed market share in 2025, whereas hybrids are forecast to expand at a 6.58% CAGR through 2031.
- By Geography, Europe led with a 44.8% share of the wheat seed market size in 2025, while South America is projected to register the highest 8.17% CAGR between 2026 and 2031.
Note: Market size and forecast figures in this report are generated using Mordor Intelligence’s proprietary estimation framework, updated with the latest available data and insights as of 2026.
Global Wheat Seed Market Trends and Insights
Drivers Impact Analysis*
| Driver | (~) % Impact on CAGR Forecast | Geographic Relevance | Impact Timeline |
|---|---|---|---|
| Accelerated varietal turnover in emerging economies | +1.2% | Asia-Pacific, Africa, and South America | Medium term (2-4 years) |
| Rising government minimum-support prices and input subsidies | +1.0% | Asia-Pacific core, Africa and South America | Short term (≤ 2 years) |
| Expansion of seed-treatment adoption boosting premium seed demand | +0.9% | North America and Europe, expanding to South America | Medium term (2-4 years) |
| Digital seed-traceability platforms linking growers to buyers | +0.6% | Early adoption in North America, Europe, and Australia | Long term (≥ 4 years) |
| Corporate pivot toward CRISPR-enabled hybridization platforms | +1.1% | North America, Europe, and Australia | Long term (≥ 4 years) |
| Climate-resilience mandates from multilateral lenders | +0.8% | Africa, South Asia, and South America | Medium term (2-4 years) |
| Source: Mordor Intelligence | |||
Accelerated Varietal Turnover in Emerging Economies
Accelerated varietal turnover in emerging economies is transforming the Wheat Seed Market, with the life cycles of wheat varieties in regions such as India, Pakistan, and Sub-Saharan Africa now reduced to less than 5 years, down from nearly 8 years a decade ago. In India, improved lines designed to meet diverse agro‑climatic conditions and biotic‑stress challenges have encouraged faster seed‑replacement behavior among smallholders[1]Source: Press Information Bureau, “PM releases 109 high-yielding, climate-resilient and biofortified varieties,” pib.gov.in . Similarly, in Ethiopia, more than 65% of wheat growers adopted varieties introduced after 2020, supported by extension-led evidence of yield improvements, highlighting the growing trend of rapid varietal adoption. Shorter varietal lifespans have reduced multi-year seed saving, shifting demand toward formal seed channels and driving market growth. Consequently, private breeders are realizing faster returns on research and development investments, fostering a continuous cycle of germplasm improvements and enabling sustained premium pricing in the wheat seed market.
Rising Government Minimum-Support Prices and Input Subsidies
For the 2025-26 marketing season, India raised the wheat Minimum Support Price (MSP) by 6.6% to INR 2,425 per quintal (USD 27), offering a 105% margin over production costs to boost farm income and promote certified seeds and modern technologies[2]Source: Press Information Bureau, “Government Announces Minimum Support Prices for Rabi Crops 2025-26,” pib.gov.in. In 2026, China prioritized modernizing the seed industry through the No. 1 Central Document, focusing on high-quality domestic varieties. The Ministry of Finance allocated CNY 1.25 billion (USD 0.18 billion) in February 2026 for winter wheat in 11 provinces to stabilize yields and improve climate resilience. These measures enhance farm liquidity and drive the adoption of premium seed genetics, enabling the wheat seed market to deliver traits like heat tolerance and disease resistance to a broader user base.
Expansion of Seed-Treatment Adoption Boosting Premium Seed Demand
Penetration of fungicide and insecticide coatings reached a significant share of certified wheat seed sales in North America and Europe in 2025. Treated lots command a 25% price premium, which boosts revenue per hectare for suppliers and dealers alike. BASF SE launched a dual-active formulation in 2025 that protected 1.2 million hectares in Europe during its first season, validating farmer appetite for bundled crop-protection value. Syngenta AG noted that its treatments cut in-season fungicide sprays by 1.3 passes per field, lowering total chemical load without sacrificing yield. This trend establishes a business model in which the wheat seed market incorporates protection as a standard feature, rather than as an additional post-planting option.
Corporate Pivot toward CRISPR-Enabled Hybridization Platforms
In 2025, Bayer AG intensified its research and development efforts on climate-resilient wheat genetics, emphasizing patents and technologies focused on heat tolerance and Nitrogen-Use Efficiency (NUE). This initiative is a key component of Bayer’s 'Systemic Hybrid Wheat' program, which aims to increase yields by 15% while reducing reliance on synthetic fertilizers. By combining digital modeling with advanced breeding techniques, Bayer aims to mitigate post-anthesis heat stress, a significant challenge in stabilizing wheat yields amid unpredictable global weather conditions[3]Source: Bayer AG, “Innovation and Sustainability in the Cereal Seed Pipeline,” Bayer.com . The wheat seed market is being driven by a corporate shift toward CRISPR-enabled hybridization platforms. Start-to-launch timelines decrease by approximately 40% when breeders transition from conventional backcrossing to Clustered Regularly Interspaced Short Palindromic Repeats (CRISPR)-guided allele swaps, expediting the pace of product updates in the wheat seed market. Regulatory clarity in countries such as Australia and Argentina is enabling firms to advance commercial releases earlier than initially anticipated. This method offers combined advantages of higher yield potential and improved climate resilience while avoiding the introduction of foreign DNA, an important consideration for consumer acceptance.
Restraints Impact Analysis*
| Restraint | (~) % Impact on CAGR Forecast | Geographic Relevance | Impact Timeline |
|---|---|---|---|
| Farmer distrust toward patented hybrid royalty clauses | -0.8% | Asia-Pacific, Africa, South America | Medium term (2-4 years) |
| Regulatory uncertainty on gene-edited traits | -0.7% | Europe, Asia-Pacific and Africa | Long term (≥ 4 years) |
| Rising on-farm seed saving in price-sensitive regions | -1.0% | Asia-Pacific, Africa, South America | Short term (≤ 2 years) |
| Supply-chain bottlenecks for early-generation breeder seed | -0.6% | Africa and South Asia | Medium term (2-4 years) |
| Source: Mordor Intelligence | |||
Farmer Distrust toward Patented Hybrid Royalty Clauses
A significant number of wheat farmers in India and Pakistan avoid hybrid purchases due to concerns about lower yields, higher input costs, and royalty fees that erode net margins. Arguments over farmer-saved seed rights dominate policy debates in Argentina, where grower associations are lobbying for prolonged royalty exemptions. The cloud over intellectual-property enforcement suppresses hybrid penetration below 10% across most emerging wheat economies. Unless transparent and flexible fee systems emerge, the growth of the wheat seed market risks stalling in regions where informal channels remain entrenched.
Regulatory Uncertainty on Gene-Edited Traits
Regulatory uncertainty regarding gene-edited traits continues to hinder growth in the Wheat Seed Market. The European Union has yet to decide whether gene-edited crops should fall under its existing Genetically Modified Organism (GMO) legislation, delaying investments and field trials. In India, draft approval guidelines were introduced in 2025, but the lack of finalized regulations has left commercialization timelines uncertain. In contrast, Australia approved its first gene-edited wheat variety in 2025. Major Asian export markets have yet to recognize gene-edited categories, creating additional trade barriers. Consequently, companies are compelled to maintain dual breeding pipelines conventional and gene-edited leading to increased development costs of up to 25%. This fragmented regulatory environment highlights the need for harmonized global protocols on risk assessment and labeling to support the scalable commercialization of gene-edited wheat varieties.
*Our forecasts treat driver/restraint impacts as directional, not additive. The impact forecasts reflect baseline growth, mix effects, and variable interactions.
Segment Analysis
By Breeding Technology: Open-Pollinated Varieties Dominate, Hybrids Gain Momentum
Open-pollinated varieties and hybrid derivatives accounted for 94.8% of the wheat seed market share in 2025, driven by farmers' preference for seed-saving flexibility and lower initial costs. Hybrids are projected to grow the fastest, with a compound annual growth rate (CAGR) of 6.58% from 2026 to 2031. This growth is attributed to yield advantages and stress-tolerance traits that justify higher seed prices in large-scale commercial farming systems. Seed companies report that hybrid wheat achieves gross margins higher than open-pollinated varieties, encouraging increased investment in male-sterile and cytoplasmic-male-sterile production technologies. The accelerated adoption of hybrids in markets such as Argentina and Australia underscores the segment's commercial viability, despite higher royalty fees and seed-replacement costs.
The remaining portion of the wheat seed market is focused on early-stage transgenic or gene-edited hybrids, which face challenges due to uneven global regulatory frameworks. Field trials in Australia and Argentina have demonstrated promising improvements in herbicide tolerance and drought resilience. Over the forecast period, the adoption of these advanced breeding platforms will depend on achieving broader regulatory clarity and gaining consumer acceptance, which are critical for transitioning these technologies from niche to mainstream markets.


Geography Analysis
Europe is projected to lead the wheat seed market with a 44.8% share in 2025. This dominance is attributed to compulsory varietal registration and high seed-replacement rates in countries such as France, Germany, and Poland. Robust subsidy programs in Russia and stringent purity standards within the European Union minimize informal seed channels, supporting premium pricing in the region. South America is anticipated to exhibit the fastest growth, with the wheat seed segment forecasted to grow at a CAGR of 8.17% from 2026 to 2031. Argentina’s yield-gap initiatives and Brazil’s development of tropical wheat varieties are driving cultivation into new areas. Additionally, the expansion of hybrid acreage in the Pampas and improved logistics for certified seed distribution are bolstering commercial growth in this high-potential region.
In the Asia-Pacific region, steady growth is driven by India’s cooperative networks promoting formal seed adoption, China’s introduction of water-efficient winter wheat lines, and Australia’s use of genomic selection to safeguard its export pipeline. Africa is transitioning from predominantly informal seed sourcing to certified solutions, supported by multilateral credit lines that incentivize climate-resilient genetics. However, distribution challenges remain a significant obstacle. Meanwhile, North America’s mature input ecosystem ensures stable demand through widespread adoption of seed-treatment bundling and precision-farming services.
Several factors are collectively raising the baseline for future wheat seed demand. These include rising minimum support prices in Asia-Pacific, subsidy-backed hybrid incentives in South America, and digital traceability premiums in Europe and Australia. In Africa and South Asia, multilateral lender mandates linking credit to stress-tolerant varieties are accelerating the adoption of certified seeds, enhancing market penetration. Continued investments in regional breeding stations and last-mile cold-chain infrastructure are projected to reduce launch cycles and improve access to advanced seed varieties. As these initiatives align, they are anticipated to strengthen the wheat seed market’s growth trajectory, laying a solid foundation for sustained expansion through 2031.

Competitive Landscape
Major players in the market, such as Bayer AG, Syngenta AG, Corteva Inc., Groupe Limagrain Holding, and KWS SAAT SE & Co. KGaA, accounted for a significant share of the wheat seed market in 2025, reflecting a moderately concentrated market structure. Bayer AG reinforced its leadership position in January 2026 by investing CAD 45 million (USD 33 million) to build a world-class breeding facility in Saskatoon, Canada. This expansion consolidates its R&D operations to accelerate its pipeline of heat-tolerant and climate-resilient hybrids, specifically targeting yield stability in volatile environments. Syngenta AG leverages an integrated seed and crop-protection platform, with its 2025 sustainability report highlighting that bundled seed treatments reduced on-farm fungicide applications by 1.3 passes per season, supporting its premium market positioning. Both companies are driving advancements in CRISPR-enabled trait development and patent activity, aiming to shorten product launch cycles and maintain pricing power amid increased scrutiny of royalties.
Corteva Inc., Groupe Limagrain Holding, and KWS SAAT SE & Co. KGaA complete the top tier, each focusing on distinct geographic and technological strategies. In 2022, Groupe Limagrain Holding inaugurated a new processing facility in France with an annual capacity of 80,000 metric tons, incorporating digital traceability to enhance batch authentication for European and North African markets. Similarly, in 2025, KWS SAAT SE & Co. acquired a majority stake in a Romanian breeder, providing direct access to Black Sea germplasm and accelerating the time-to-market for winter wheat varieties tailored to continental climates.
Mid-size breeders and agri tech start-ups are expanding into Sub-Saharan Africa and South Asia, where certified seed penetration remains below 30% and informal distribution channels dominate. These challengers are using mobile commerce platforms to bypass traditional dealer networks, delivering region-specific genetics and real-time agronomic advice. Leading multinational companies aim to enhance margins by integrating seeds with embedded treatments and blockchain-based traceability, enabling higher realized pricing per kilogram. Continued investments in gene editing, regional breeding stations, and last-mile cold-chain infrastructure are projected to accelerate product launches and support double-digit revenue growth for agile competitors through 2031.
Wheat Seed Industry Leaders
Bayer AG
Syngenta AG
Corteva Inc.
Groupe Limagrain Holding
KWS SAAT SE & Co. KGaA
- *Disclaimer: Major Players sorted in no particular order

Recent Industry Developments
- February 2026: Syngenta unveiled its X-Terra hybrid wheat, the company’s first commercial hybrid that couples broad-spectrum disease resistance with optimized nitrogen-use efficiency. This advance is set to boost premium-seed demand, as growers gain yield stability while trimming key input costs, reinforcing hybrid momentum in the global wheat seed market.
- January 2026: India released 184 new crop varieties across 25 crops, including climate-resilient wheat lines that farmers will have access to within 3 years. The influx of public-sector genetics accelerates varietal turnover and supports the growth of the formal wheat seed market by aligning resilience goals with farmer adoption programs.
- December 2025: Limagrain introduced high-yielding winter wheat lines to the Recommended List 2026/27 that fit both main and late drilling slots. The broader sowing flexibility is likely to strengthen Limagrain’s European footprint by matching variety choice with on-farm scheduling constraints, thereby expanding its share of certified seed sales.


Global Wheat Seed Market Report Scope
A wheat seed is the reproductive unit of the wheat plant (Triticum aestivum) used for sowing to grow new crops. The Wheat Seed Market Report is Segmented by Breeding Technology (Hybrids [Non-Transgenic Hybrids and Transgenic Hybrids] and Open-Pollinated Varieties and Hybrid Derivatives) and Geography (North America, South America, Europe, Asia-Pacific, Middle East, and Africa). The Market Forecasts are Provided in Terms of Value (USD) and Volume (Units).
| Hybrids | Transgenic Hybrids |
| Non-Transgenic Hybrids | |
| Open Pollinated Varieties and Hybrid Derivatives |
| United Kingdom |
| Germany |
| France |
| Spain |
| Russia |
| Italy |
| Netherlands |
| Poland |
| Romania |
| Ukraine |
| Rest of Europe |
| China |
| India |
| Australia |
| Thailand |
| Pakistan |
| Bangladesh |
| Myanmar |
| Japan |
| Thailand |
| Myanmar |
| Rest of Asia-Pacific |
| Brazil |
| Argentina |
| Rest of South America |
| South Africa |
| Egypt |
| Nigeria |
| Ethiopia |
| Tanzania |
| Kenya |
| Rest of Africa |
| Iran |
| Saudi Arabia |
| Rest of Middle East |
| United States |
| Canada |
| Mexico |
| Rest of North America |
| By Breeding Technology | Hybrids | Transgenic Hybrids |
| Non-Transgenic Hybrids | ||
| Open Pollinated Varieties and Hybrid Derivatives | ||
| Europe | United Kingdom | |
| Germany | ||
| France | ||
| Spain | ||
| Russia | ||
| Italy | ||
| Netherlands | ||
| Poland | ||
| Romania | ||
| Ukraine | ||
| Rest of Europe | ||
| Asia-Pacific | China | |
| India | ||
| Australia | ||
| Thailand | ||
| Pakistan | ||
| Bangladesh | ||
| Myanmar | ||
| Japan | ||
| Thailand | ||
| Myanmar | ||
| Rest of Asia-Pacific | ||
| South America | Brazil | |
| Argentina | ||
| Rest of South America | ||
| Africa | South Africa | |
| Egypt | ||
| Nigeria | ||
| Ethiopia | ||
| Tanzania | ||
| Kenya | ||
| Rest of Africa | ||
| Middle East | Iran | |
| Saudi Arabia | ||
| Rest of Middle East | ||
| North America | United States | |
| Canada | ||
| Mexico | ||
| Rest of North America |


Market Definition
- Commercial Seed - For the purpose of this study, only commercial seeds have been included as part of the scope. Farm-saved Seeds, which are not commercially labeled are excluded from scope, even though a minor percentage of farm-saved seeds are exchanged commercially among farmers. The scope also excludes vegetatively reproduced crops and plant parts, which may be commercially sold in the market.
- Crop Acreage - While calculating the acreage under different crops, the Gross Cropped Area has been considered. Also known as Area Harvested, according to the Food & Agricultural Organization (FAO), this includes the total area cultivated under a particular crop across seasons.
- Seed Replacement Rate - Seed Replacement Rate is the percentage of area sown out of the total area of crop planted in the season by using certified/quality seeds other than the farm-saved seed.
- Protected Cultivation - The report defines protected cultivation as the process of growing crops in a controlled environment. This includes greenhouses, glasshouses, hydroponics, aeroponics, or any other cultivation system that protects the crop against any abiotic stress. However, cultivation in an open field using plastic mulch is excluded from this definition and is included under open field.
| Keyword | Definition |
|---|---|
| Row Crops | These are usually the field crops which include the different crop categories like grains & cereals, oilseeds, fiber crops like cotton, pulses, and forage crops. |
| Solanaceae | These are the family of flowering plants which includes tomato, chili, eggplants, and other crops. |
| Cucurbits | It represents a gourd family consisting of about 965 species in around 95 genera. The major crops considered for this study include Cucumber & Gherkin, Pumpkin and squash, and other crops. |
| Brassicas | It is a genus of plants in the cabbage and mustard family. It includes crops such as carrots, cabbage, cauliflower & broccoli. |
| Roots & Bulbs | The roots and bulbs segment includes onion, garlic, potato, and other crops. |
| Unclassified Vegetables | This segment in the report includes the crops which don’t belong to any of the above-mentioned categories. These include crops such as okra, asparagus, lettuce, peas, spinach, and others. |
| Hybrid Seed | It is the first generation of the seed produced by controlling cross-pollination and by combining two or more varieties, or species. |
| Transgenic Seed | It is a seed that is genetically modified to contain certain desirable input and/or output traits. |
| Non-Transgenic Seed | The seed produced through cross-pollination without any genetic modification. |
| Open-Pollinated Varieties & Hybrid Derivatives | Open-pollinated varieties produce seeds true to type as they cross-pollinate only with other plants of the same variety. |
| Other Solanaceae | The crops considered under other Solanaceae include bell peppers and other different peppers based on the locality of the respective countries. |
| Other Brassicaceae | The crops considered under other brassicas include radishes, turnips, Brussels sprouts, and kale. |
| Other Roots & Bulbs | The crops considered under other roots & bulbs include Sweet Potatoes and cassava. |
| Other Cucurbits | The crops considered under other cucurbits include gourds (bottle gourd, bitter gourd, ridge gourd, Snake gourd, and others). |
| Other Grains & Cereals | The crops considered under other grains & cereals include Barley, Buck Wheat, Canary Seed, Triticale, Oats, Millets, and Rye. |
| Other Fibre Crops | The crops considered under other fibers include Hemp, Jute, Agave fibers, Flax, Kenaf, Ramie, Abaca, Sisal, and Kapok. |
| Other Oilseeds | The crops considered under other oilseeds include Ground nut, Hempseed, Mustard seed, Castor seeds, safflower seeds, Sesame seeds, and Linseeds. |
| Other Forage Crops | The crops considered under other forages include Napier grass, Oat grass, White clover, Ryegrass, and Timothy. Other forage crops were considered based on the locality of the respective countries. |
| Pulses | Pigeon peas, Lentils, Broad and horse beans, Vetches, Chickpeas, Cowpeas, Lupins, and Bambara beans are the crops considered under pulses. |
| Other Unclassified Vegetables | The crops considered under other unclassified vegetables include Artichokes, Cassava Leaves, Leeks, Chicory, and String beans. |


Research Methodology
Mordor Intelligence follows a four-step methodology in all our reports.
- Step-1: IDENTIFY KEY VARIABLES: In order to build a robust forecasting methodology, the variables and factors identified in Step-1 are tested against available historical market numbers. Through an iterative process, the variables required for market forecast are set and the model is built on the basis of these variables.
- Step-2: Build a Market Model: Market-size estimations for the forecast years are in nominal terms. Inflation is not a part of the pricing, and the average selling price (ASP) is kept constant throughout the forecast period.
- Step-3: Validate and Finalize: In this important step, all market numbers, variables and analyst calls are validated through an extensive network of primary research experts from the market studied. The respondents are selected across levels and functions to generate a holistic picture of the market studied.
- Step-4: Research Outputs: Syndicated Reports, Custom Consulting Assignments, Databases, and Subscription Platforms


