Market Overview
| Study Period | 2018 - 2031 |
|---|---|
| Forecast Data Period | 2026 - 2031 |
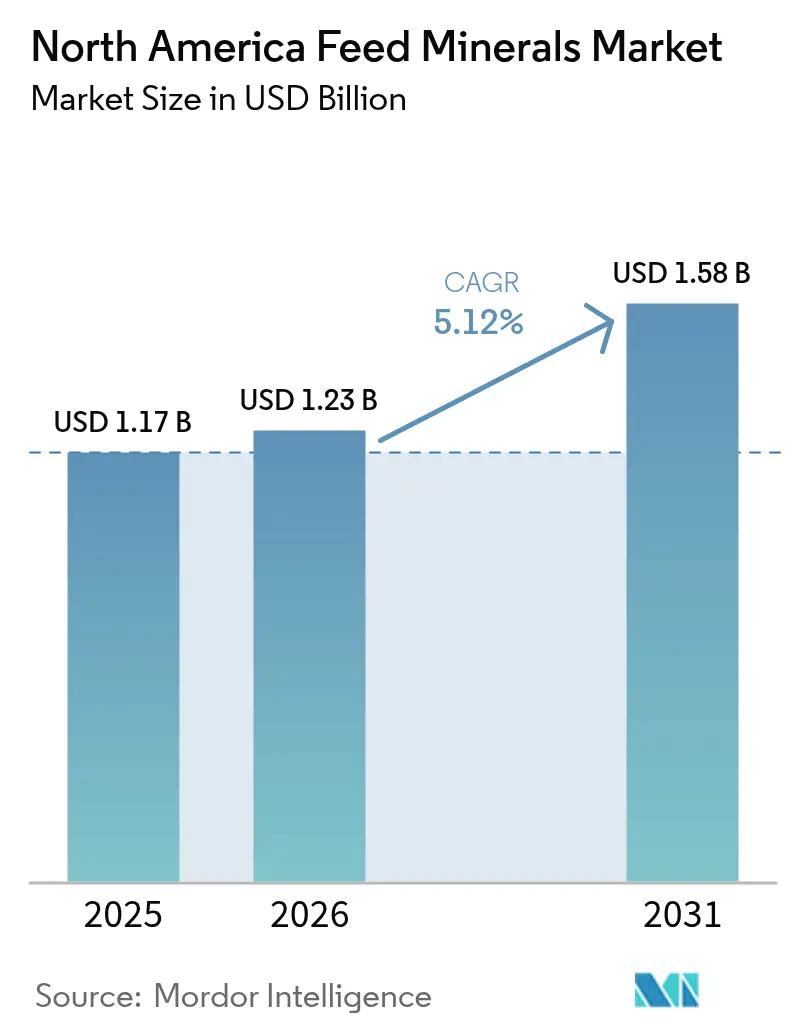
| Base Year Market Size (2025) | USD 1.17 Billion |
| Market Size (2026) | USD 1.23 Billion |
| Market Size (2031) | USD 1.58 Billion |
| Growth Rate (2026 - 2031) | 5.12% CAGR |
| Market Concentration | Medium |
Major Players*Disclaimer: Major Players sorted in no particular order Image © Mordor Intelligence. Reuse requires attribution under CC BY 4.0. | |
North America Feed Minerals Market Analysis by Mordor Intelligence
North America feed minerals market size in 2026 is estimated at USD 1.23 billion, growing from 2025 value of USD 1.17 billion with 2031 projections showing USD 1.58 billion, growing at 5.12% CAGR over 2026-2031. This steady expansion reflects the region’s priority on livestock productivity gains through precision nutrition, tighter alignment with regulatory mineral‐inclusion rules, and rapid adoption of chelated trace minerals that improve feed conversion efficiency. Increased livestock export volumes, especially beef and pork shipped under United States-Mexico-Canada Agreement (USMCA) provisions, amplify the need for mineral programs that meet international carcass quality and shelf-life expectations[1]Source: United States Department of Agriculture “Livestock and Products Annual,” USDA, usda.gov . Higher incidence of production stressors such as heat load in feedlots and metabolic disorders in high-yield dairy herds further elevates mineral fortification demand, while real-time micro-dosing equipment embeds minerals into precision-feeding regimens. The competitive playing field remains moderately fragmented, yet scale advantages in premix production and distribution are allowing market leaders to widen channel reach and accelerate chelated-mineral capacity investments.
Key Report Takeaways
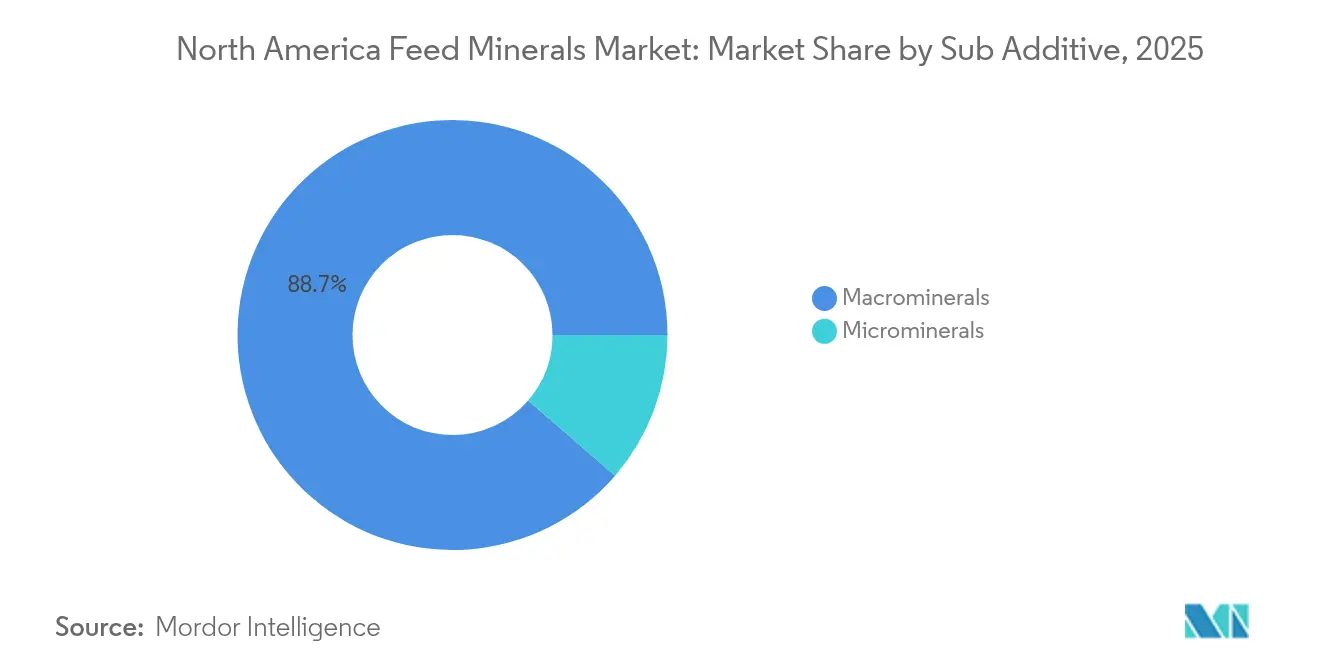
- By sub-additive, macrominerals led with an 88.65% North America feed minerals market share in 2025 and are projected to advance at a 5.23% CAGR through 2031.
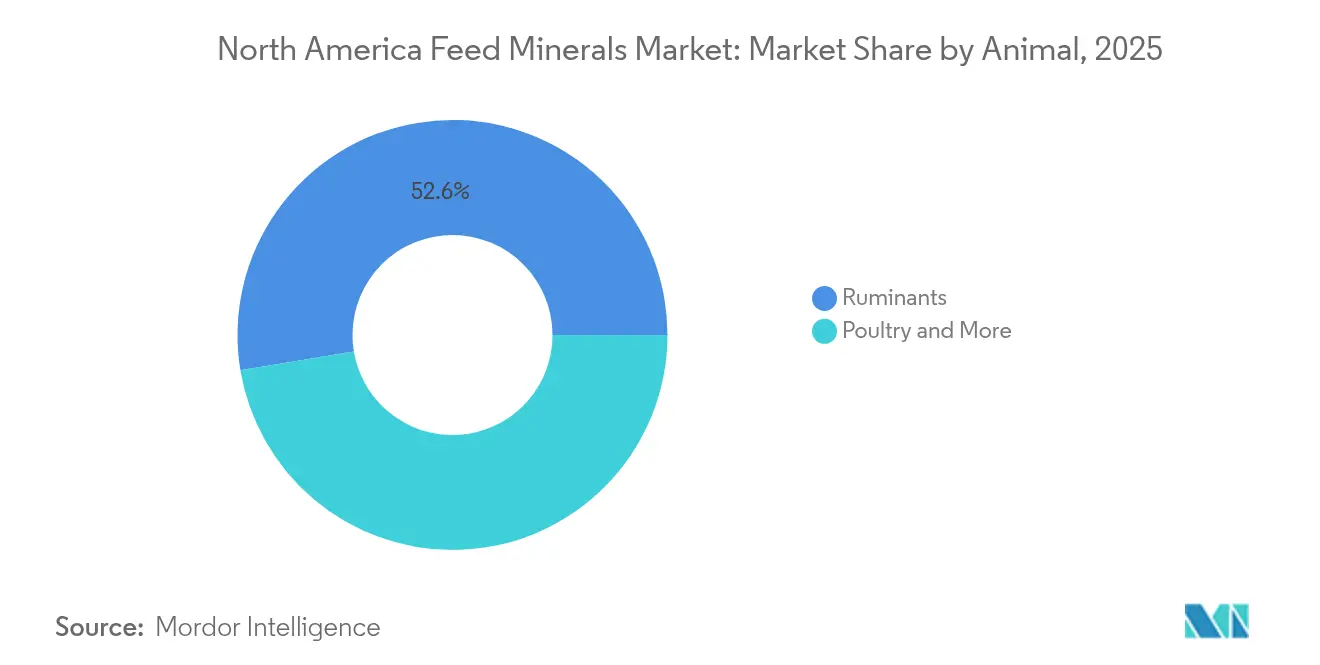
- By animal, ruminants captured 52.62% of the North America feed minerals market size in 2025, while the same segment is forecast to post the fastest 5.78% CAGR through 2031.
- By country, the United States accounted for 70.35% of the North America feed minerals market size in 2025 and is anticipated to maintain a 5.84% CAGR to 2031.
Note: Market size and forecast figures in this report are generated using Mordor Intelligence’s proprietary estimation framework, updated with the latest available data and insights as of 2026.
North America Feed Minerals Market Trends and Insights
Drivers Impact Analysis*
| Driver | (~) % Impact on CAGR Forecast | Geographic Relevance | Impact Timeline |
|---|---|---|---|
| Rising adoption of mineral-fortified poultry feed | +1.2% | United States and Canada | Medium term (2-4 years) |
| Intensifying livestock production export demand | +1.0% | United States and Mexico | Long term (≥ 4 years) |
| Regulatory push for trace-mineral inclusion | +0.9% | North America | Short term (≤ 2 years) |
| Shift toward chelated or organic minerals | +0.8% | United States and Canada | Medium term (2-4 years) |
| Precision feeding and micro-dosing platforms | +0.6% | United States | Long term (≥ 4 years) |
| Nano-mineral innovations for immune modulation | +0.4% | United States and Canada | Long term (≥ 4 years) |
| Source: Mordor Intelligence | |||


Rising Adoption of Mineral-Fortified Poultry Feed
Eggshell quality issues and accelerated broiler growth targets push producers toward robust mineral programs that deliver calcium and phosphorus in highly available forms. Large integrators rely on chelated trace elements that raise shell strength 8-12% versus inorganic alternatives, satisfying stringent retailer quality audits. Food and Drug Administration (FDA) rules under the Food Safety Modernization Act compel documentation of every mineral input, stimulating demand for turnkey premix solutions that simplify compliance. Precision Layer Management software tracks mineral consumption in real time and flags deviations that could erode flock performance. Forward-looking layer operations fold mineral analytics into hatchery-to-lay dashboards, ensuring genetic potential is met under variable barn climates as poultry remains North America’s largest meat protein; the North America feed minerals market benefits from predictable, high-volume mineral turnover aligned with weekly chick placements.
Intensifying Livestock Production Export Demand
The USMCA framework lowers tariff friction, encouraging United States and Canadian beef and pork operations to embed premium mineral programs that support carcass color stability and shelf life demanded by Asian and South American importers. Export-oriented feedlots exceed domestic zinc and copper requirements to minimize oxidative meat discoloration during transit. Mexico’s expanding pork sector mirrors this strategy, sourcing United States chelated blends that meet Japanese residue and speciation limits. Elevated mineral precision converts into higher feed costs but secures price premiums on chilled cuts, repositioning minerals from overhead to revenue enabler within integrated supply chains.
Regulatory Push for Trace-Mineral Inclusion
Coordinated Food and Drug Administration (FDA) and Association of American Feed Control Officials (AAFCO) actions now specify floor and ceiling levels for zinc, copper, and manganese across every commercial feed class, replacing a patchwork of guidance documents. Canada’s Feed Regulations 2024 mirror these thresholds, obligating quarterly laboratory verification. Smaller mills unable to fund in-house analytics outsource premix manufacturing, expanding addressable volumes for specialized suppliers. Caps on total inclusion rates incentivize high-bioavailability forms that meet animal requirements without breaching runoff rules. Rapid regulatory clarity also standardizes label claims, supporting transparent supply chains that downstream brands can reference in sustainability scorecards.
Shift Toward Chelated or Organic Minerals
Chelated molecules circumvent antagonisms in the gastrointestinal tract, driving 2-3-fold higher absorption in both ruminants and monogastrics. Dairy trials show organic zinc cutting somatic cell counts and oxidative stress markers by 15-20%, directly extending productive life. Reduced inclusion weights brighten environmental audits by shrinking excreted mineral loads, a rising priority for retailers assigning Scope 3 carbon values to protein products. As manufacturing capacity for chelates grows across the Midwest and Ontario, premix suppliers leverage shorter lead times to displace Asian imports. Higher unit prices translate into better gross margins for feed mills, and livestock producers justify the premium through measurable gains in milk yield, fertility, and carcass grade outs.
Restraints Impact Analysis*
| Restraint | (~) % Impact on CAGR Forecast | Geographic Relevance | Impact Timeline |
|---|---|---|---|
| Volatile prices of zinc, copper and other ores | -0.8% | North America | Short term (≤ 2 years) |
| Strict manure-runoff mineral limits | -0.6% | United States and Canada | Medium term (2-4 years) |
| Alternative gut-health additives displacing minerals | -0.5% | North America | Long term (≥ 4 years) |
| China-centric chelate supply risk | -0.4% | North America | Medium term (2-4 years) |
| Source: Mordor Intelligence | |||
Volatile Prices of Zinc, Copper, and Other Ores
Annual swings of 25-35% in zinc and copper quotations inflate premix cost structures, forcing quarterly contract renegotiations between feed mills and livestock integrators in the region. Copper inputs can equal 70% of a chelate’s finished cost, so any spike compresses gross margin when mills lock in feed prices months ahead. Some producers in the region hedge exposure by shifting toward multi-mineral products with higher manganese or selenium ratios, redistributing dietary emphasis but risking sub-optimal performance. Capital allocations for new chelated technology lines often pause during commodity price peaks, temporarily slowing innovation velocity inside the North America feed minerals market.
Strict Manure-Runoff Mineral Limits
Environment Protection Act (EPA) revisions to Concentrated Animal Feeding Operation permits restrict allowable copper and zinc soil loading, compelling dairy and swine barns to tighten inclusion rates. While chelates ease compliance, conversion lifts feed cost 8-12% for mid-size farms lacking bargaining power. Operators must invest in nutrient management plans and frequent soil assays, raising administrative overhead. Some mitigate risk by under-supplementing minerals, which can erode immunity and growth metrics, indirectly tempering the North America feed minerals industry uptake curve.
*Our forecasts treat driver/restraint impacts as directional, not additive. The impact forecasts reflect baseline growth, mix effects, and variable interactions.
Segment Analysis
By Sub Additive – Macrominerals Drive Market Foundation
Macrominerals controlled an 88.65% North America feed minerals market share in 2025, reflecting their centrality to skeletal development, lactation, and reproductive performance. Calcium and phosphorus dominate volume, supported by dairy herds that require precise ratios to sustain high-yield milking cycles. The segment is projected to register a 5.23% CAGR. Supply chains for calcium carbonate and dicalcium phosphate are mature, promoting cost predictability that resonates with cash-flow-sensitive feed mills.
Precision nutrition advances encourage phase-feeding programs that adjust macromineral density across animal life stages. Microencapsulation shields calcium from premature rumen dissociation, raising absorption rates and curbing fecal excretion. These technical gains help dairies satisfy manure phosphorus limits without sacrificing milk yield. Innovations resonate particularly in automated milking parlors where sensor feedback loops integrate blood calcium data to prevent sub-clinical hypocalcemia. Continuous optimization sustains the leadership of macrominerals in the North America feed minerals market.


By Animal – Ruminants Lead Mineral Consumption
Ruminants captured 52.62% of the North American feed minerals market size in 2025 and are slated for the fastest 5.78% CAGR through 2031. Beef feedlots adopt mineral regimens that bolster average daily gain and enhance carcass marbling, critical for export premiums. Dairy farms rely on sophisticated mineral schedules that pivot alongside lactation curves, with chelated zinc improving hoof integrity and reproductive uptime.
Growth momentum also stems from expanding grass-fed and organic beef labels that continue to require minerals yet must meet certification limits on synthetics, favoring organic trace complexes. Sheep and goat dairies, while smaller, widen demand for species-specific blends that address copper sensitivity and seasonal metabolic stress. Poultry and swine remain significant but slower-growing mineral users, relying more on precision-dosing tech to trim inclusions. Aquaculture garners attention as coastal recirculating systems scale; water-stable mineral granules that resist leaching into tanks reinforce demand diversity across the North America feed minerals market.
Geography Analysis
North America's feed minerals market growth continues to lean heavily on the United States, which represented 70.35% of the total value in 2025 and is projected to reach a 5.84% CAGR by 2031. The nation’s vast dairy, beef, and poultry operations apply mineral strategies as standard operating procedure rather than discretionary input. Integrated supply chains from Mississippi River barge grain movements to Midwest premix hubs provide logistical efficiency that underpins competitive pricing. Regulatory reliability under FDA and feed mill licensing rules assures uniform product quality, promoting confidence among export-oriented protein packers that mineral profiles will pass overseas audits.
Canada contributes meaningful scale, particularly through its licensed dairy farms and Western feedlots finishing beef for both domestic and Pacific Rim buyers. The new Feed Regulations 2024 standardize mineral inclusion and enforcement, drawing smaller regional mills into compliance consulting agreements with large premix vendors Chelated blends gain traction as cold winters intensify calf health risks; organic zinc and copper help mitigate frost-related oxidative stress without breaching environmental emission caps. These factors foster predictable growth and support higher average selling prices, reinforcing supplier margins in the North America feed minerals market. Mexico shows the sharpest trajectory, leveraging USMCA access to United States mineral innovations and capital investments. Rapid poultry expansion drives calcium-rich premix demand, while vertically integrated swine firms invest in cloud-based ration formulation that mirrors U.S. best practice. Local premix plants emerge in Guadalajara and Monterrey, lowering lead times and creating bilingual technical sales roles that translate mineral science into on-farm savings. As aquaculture ventures proliferate along both coasts, water-stable mineral granules season demand diversity and cushion currency volatility. Combined, these geographic dynamics weave a regional tapestry of stable yet diversified mineral consumption.
Competitive Landscape
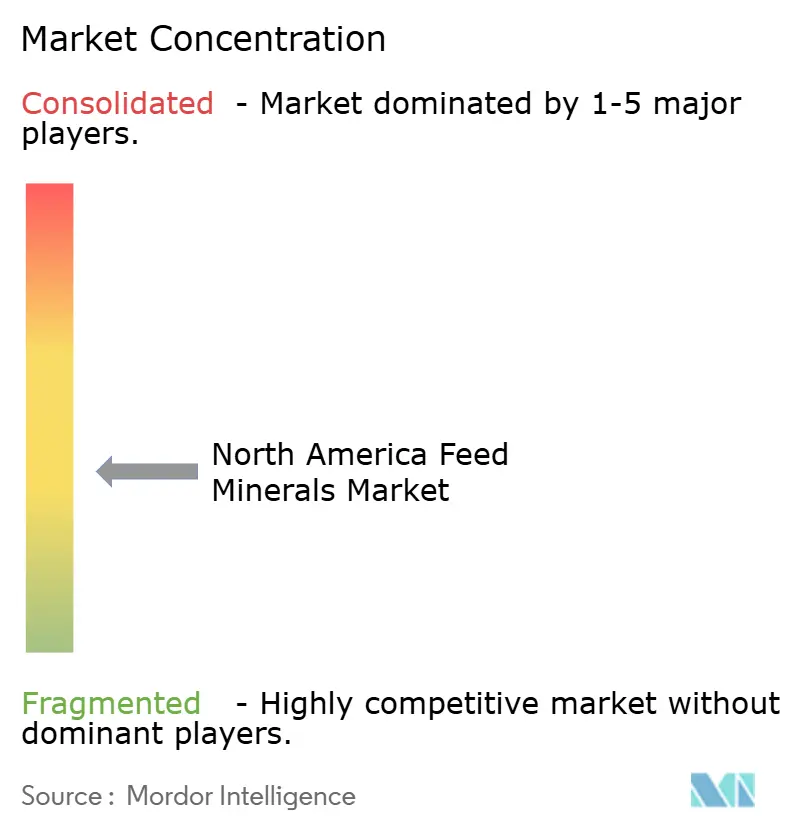
The North America feed minerals market is moderately fragmented; the five largest companies control a modest share, leaving headroom for strategic roll-ups and joint ventures. Archer Daniels Midland leads the market share, wielding vertically integrated grain origination, solvent extraction, and premix compounding assets that compress the cost of goods sold. Land O’Lakes follows closely to ADM, leveraging cooperative membership to secure distribution into hard-to-reach dairy territories.
Strategic emphasis centers on chelate capacity expansion and digital feeding alliances. ADM and Huvepharma’s 2024 agreement added Garlium and Xtract phyto-technologies to premix portfolios, bundling mineral and plant-derived additives for holistic gut health support. Novus International’s acquisition of BioResource International in 2024 folded phytase and protease enzymes into its bis-chelated mineral platform, facilitating matrix energy releases that offset ingredient inflation while maintaining trace mineral density [3].Source: “Novus acquires enzyme company BioResource International,” Feed Strategy, feedstrategy.com
White-space remains in aquaculture and nano-mineral niches. Early movers such as Zinpro explore immune-focused nanotechnology, while smaller innovators pursue microencapsulation patents to protect macrominerals from processing abrasion. Distribution networks increasingly pair mineral lines with precision feeding hardware, driving recurring subscription data revenue that augments volumetric premix sales. Overall competition now hinges on solution breadth across species, form, and digital enablement, rather than price per ton alone, positioning scaled incumbents for incremental share gains.
North America Feed Minerals Industry Leaders
Cargill Inc.
Phibro Animal Health Corporation
Nutreco N.V. (SHV Holdings N.V.)
Land O'Lakes Inc.
Archer Daniels Midland Company
- *Disclaimer: Major Players sorted in no particular order

Recent Industry Developments
- September 2025: ADM Animal Nutrition introduced a feed premix line containing vitamins, minerals, and probiotics for poultry and livestock, with products aimed at improving growth performance and gut health. Commercial farms and feed manufacturers have shown significant interest in adopting these products.
- August 2025: Zinpro Corporation launched Zinpro ProFusion Paste, a mineral-based premix containing bioavailable trace elements for ruminants and monogastric animals in the United States. Initial pilot programs demonstrated improvements in livestock growth rates and herd performance, as the product aims to enhance animal health and immunity.
- January 2025: Animine, a supplier of precision minerals, established a collaboration with Feedworks USA, a specialty feed ingredient distributor, in the United States market. The partnership enables Animine to provide its product portfolio to agricultural producers and nutritionists in the United States.


North America Feed Minerals Market Report Scope
Macrominerals, Microminerals are covered as segments by Sub Additive. Aquaculture, Poultry, Ruminants, Swine are covered as segments by Animal. Canada, Mexico, United States are covered as segments by Country.Sub Additive
| Macrominerals |
| Microminerals |
Animal
| Aquaculture | By Sub Animal | Fish |
| Shrimp | ||
| fish | ||
| Other Aquaculture Species | ||
| Poultry | By Sub Animal | Broiler |
| Layer | ||
| Other Poultry Birds | ||
| Ruminants | By Sub Animal | Beef Cattle |
| Dairy Cattle | ||
| Other Ruminants | ||
| Swine | ||
| Other Animals |
Geography
| Canada |
| Mexico |
| United States |
| Rest of North America |
| Sub Additive | Macrominerals | ||
| Microminerals | |||
| Animal | Aquaculture | By Sub Animal | Fish |
| Shrimp | |||
| fish | |||
| Other Aquaculture Species | |||
| Poultry | By Sub Animal | Broiler | |
| Layer | |||
| Other Poultry Birds | |||
| Ruminants | By Sub Animal | Beef Cattle | |
| Dairy Cattle | |||
| Other Ruminants | |||
| Swine | |||
| Other Animals | |||
| Geography | Canada | ||
| Mexico | |||
| United States | |||
| Rest of North America | |||


Market Definition
- FUNCTIONS - For the study, feed additives are considered to be commercially manufactured products that are used to enhance characteristics such as weight gain, feed conversion ratio, and feed intake when fed in appropriate proportions.
- RESELLERS - Companies engaged in reselling feed additives without value addition have been excluded from the market scope, to avoid double counting.
- END CONSUMERS - Compound feed manufacturers are considered to be end-consumers in the market studied. The scope excludes farmers buying feed additives to be used directly as supplements or premixes.
- INTERNAL COMPANY CONSUMPTION - Companies engaged in the production of compound feed as well as the manufacturing of feed additives are part of the study. However, while estimating the market sizes, the internal consumption of feed additives by such companies has been excluded.
| Keyword | Definition |
|---|---|
| Feed additives | Feed additives are products used in animal nutrition for purposes of improving the quality of feed and the quality of food from animal origin, or to improve the animals’ performance and health. |
| Probiotics | Probiotics are microorganisms introduced into the body for their beneficial qualities. (It maintains or restores beneficial bacteria to the gut). |
| Antibiotics | Antibiotic is a drug that is specifically used to inhibit the growth of bacteria. |
| Prebiotics | A non-digestible food ingredient that promotes the growth of beneficial microorganisms in the intestines. |
| Antioxidants | Antioxidants are compounds that inhibit oxidation, a chemical reaction that produces free radicals. |
| Phytogenics | Phytogenics are a group of natural and non-antibiotic growth promoters derived from herbs, spices, essential oils, and oleoresins. |
| Vitamins | Vitamins are organic compounds, which are required for normal growth and maintenance of the body. |
| Metabolism | A chemical process that occurs within a living organism in order to maintain life. |
| Amino acids | Amino acids are the building blocks of proteins and play an important role in metabolic pathways. |
| Enzymes | Enzyme is a substance that acts as a catalyst to bring about a specific biochemical reaction. |
| Anti-microbial resistance | The ability of a microorganism to resist the effects of an antimicrobial agent. |
| Anti-microbial | Destroying or inhibiting the growth of microorganisms. |
| Osmotic balance | It is a process of maintaining salt and water balance across membranes within the body's fluids. |
| Bacteriocin | Bacteriocins are the toxins produced by bacteria to inhibit the growth of similar or closely related bacterial strains. |
| Biohydrogenation | It is a process that occurs in the rumen of an animal in which bacteria convert unsaturated fatty acids (USFA) to saturated fatty acids (SFA). |
| Oxidative rancidity | It is a reaction of fatty acids with oxygen, which generally causes unpleasant odors in animals. To prevent these, antioxidants were added. |
| Mycotoxicosis | Any condition or disease caused by fungal toxins, mainly due to contamination of animal feed with mycotoxins. |
| Mycotoxins | Mycotoxins are toxin compounds that are naturally produced by certain types of molds (fungi). |
| Feed Probiotics | Microbial feed supplements positively affect gastrointestinal microbial balance. |
| Probiotic yeast | Feed yeast (single-cell fungi) and other fungi used as probiotics. |
| Feed enzymes | They are used to supplement digestive enzymes in an animal’s stomach to break down food. Enzymes also ensure that meat and egg production is improved. |
| Mycotoxin detoxifiers | They are used to prevent fungal growth and to stop any harmful mold from being absorbed in the gut and blood. |
| Feed antibiotics | They are used both for the prevention and treatment of diseases but also for rapid growth and development. |
| Feed antioxidants | They are used to protect the deterioration of other feed nutrients in the feed such as fats, vitamins, pigments, and flavoring agents, thus providing nutrient security to the animals. |
| Feed phytogenics | Phytogenics are natural substances, added to livestock feed to promote growth, aid in digestion, and act as anti-microbial agents. |
| Feed vitamins | They are used to maintain the normal physiological function and normal growth and development of animals. |
| Feed flavors and sweetners | These flavors and sweeteners help to mask tastes and odors during changes in additives or medications and make them ideal for animal diets undergoing transition. |
| Feed acidifiers | Animal feed acidifiers are organic acids incorporated into the feed for nutritional or preservative purposes. Acidifiers enhance congestion and microbiological balance in the alimentary and digestive tracts of livestock. |
| Feed minerals | Feed minerals play an important role in the regular dietary requirements of animal feed. |
| Feed binders | Feed binders are the binding agents used in the manufacture of safe animal feed products. It enhances the taste of food and prolongs the storage period of the feed. |
| Key Terms | Abbreviation |
| LSDV | Lumpy Skin Disease Virus |
| ASF | African Swine Fever |
| GPA | Growth Promoter Antibiotics |
| NSP | Non-Starch Polysaccharides |
| PUFA | Polyunsaturated Fatty Acid |
| Afs | Aflatoxins |
| AGP | Antibiotic Growth Promoters |
| FAO | The Food And Agriculture Organization of the United Nations |
| USDA | The United States Department of Agriculture |


Research Methodology
Mordor Intelligence follows a four-step methodology in all our reports.
- Step-1: IDENTIFY KEY VARIABLES: In order to build a robust forecasting methodology, the variables and factors identified in Step-1 are tested against available historical market numbers. Through an iterative process, the variables required for market forecast are set and the model is built on the basis of these variables.
- Step-2: Build a Market Model: Market-size estimations for the forecast years are in nominal terms. Inflation is not a part of the pricing, and the average selling price (ASP) is kept constant throughout the forecast period.
- Step-3: Validate and Finalize: In this important step, all market numbers, variables and analyst calls are validated through an extensive network of primary research experts from the market studied. The respondents are selected across levels and functions to generate a holistic picture of the market studied.
- Step-4: Research Outputs: Syndicated Reports, Custom Consulting Assignments, Databases & Subscription Platforms


