Market Overview
| Study Period | 2017 - 2030 |
|---|---|
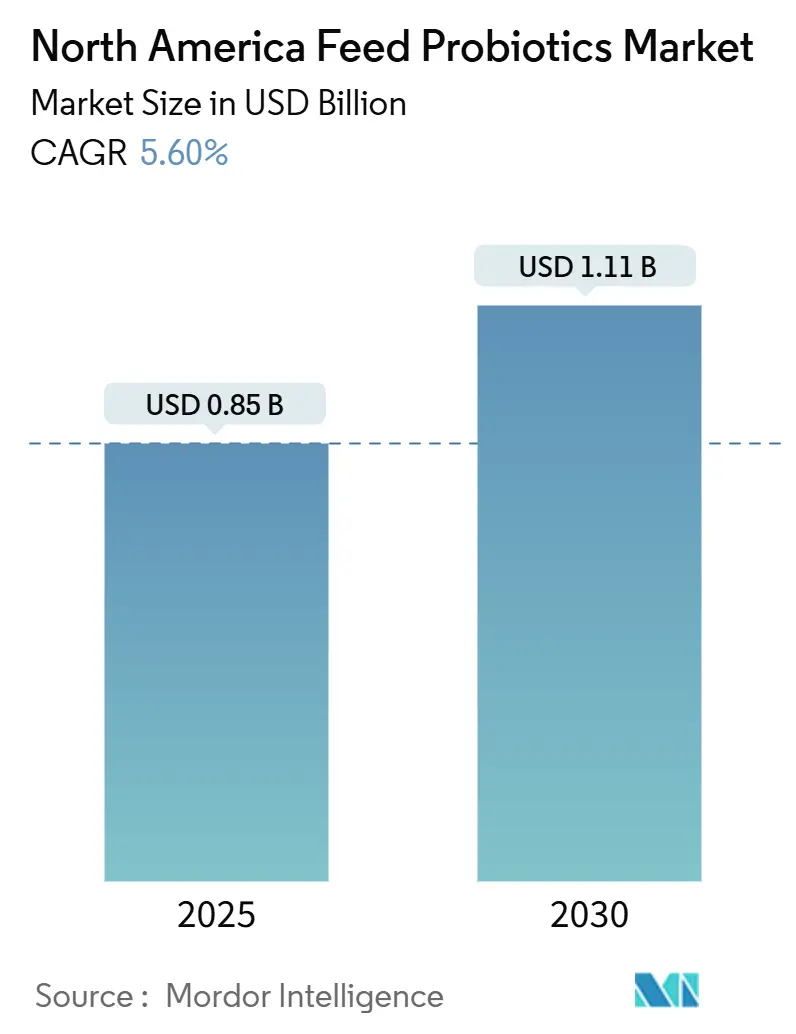
| Market Size (2025) | USD 0.85 Billion |
| Market Size (2030) | USD 1.11 Billion |
| Growth Rate (2025 - 2030) | 5.60% CAGR |
| Fastest Growing Market | Lactobacilli |
| Largest Market | United States |
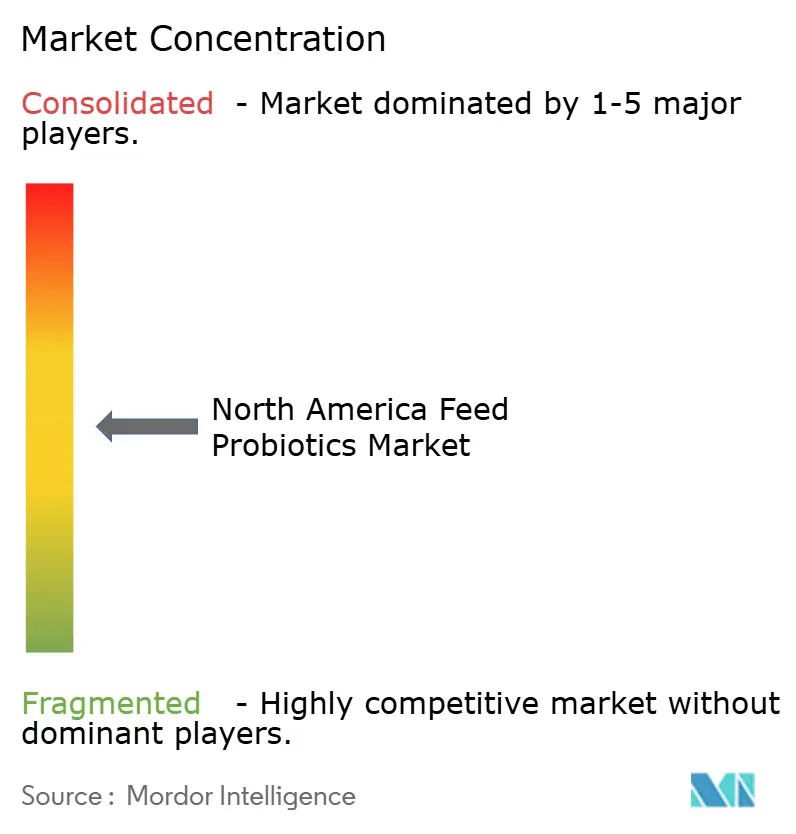
| Market Concentration | Medium |
Major Players *Disclaimer: Major Players sorted in no particular order Image © Mordor Intelligence. Reuse requires attribution under CC BY 4.0. | |
North America Feed Probiotics Market Analysis by Mordor Intelligence
The North America feed probiotics market size stands at USD 0.85 billion in 2025 and is projected to reach USD 1.11 billion by 2030, advancing at a 5.6% CAGR. Growing regulatory restrictions on prophylactic antibiotics, rising consumer preference for antibiotic-free meat, and ongoing investments in precision livestock technologies sustain this steady expansion[1]Source: Center for Veterinary Medicine, “Guidance for Industry #293,” fda.gov. Concentrated poultry production, the search for functional feed solutions that safeguard gut health, and the scaling of recirculating aquaculture systems collectively drive volume growth. Manufacturers are prioritizing strains that withstand pelleting temperatures while delivering measurable performance gains, and integrators are signing multi-year supply agreements that guarantee demand visibility. Thermal instability during feed processing, high regulatory costs for novel strains, and culture-media price volatility remain immediate headwinds, but capital flow into encapsulation technologies and collaborative industry–university research projects signals a robust innovation pipeline.
Key Report Takeaways
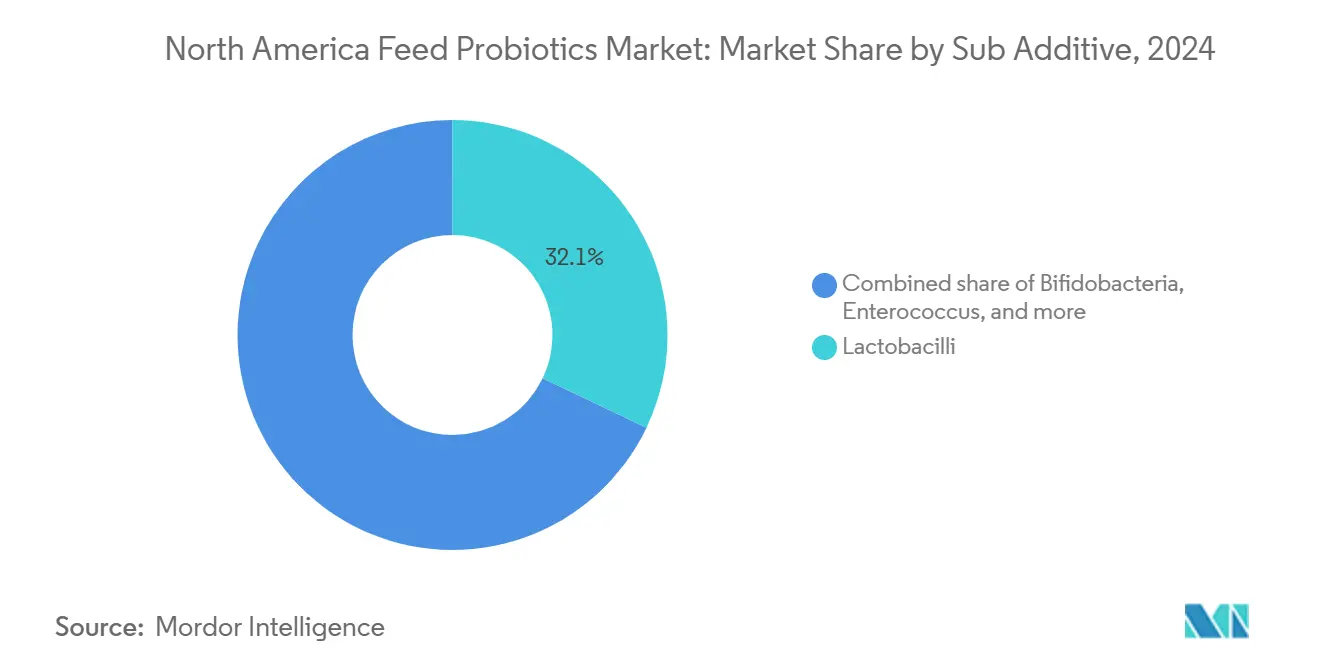
- By probiotic strain, Lactobacilli led with 32.1% of the North America feed probiotics market share in 2024, while Bifidobacteria is projected to register the fastest 7.8% CAGR through 2030.
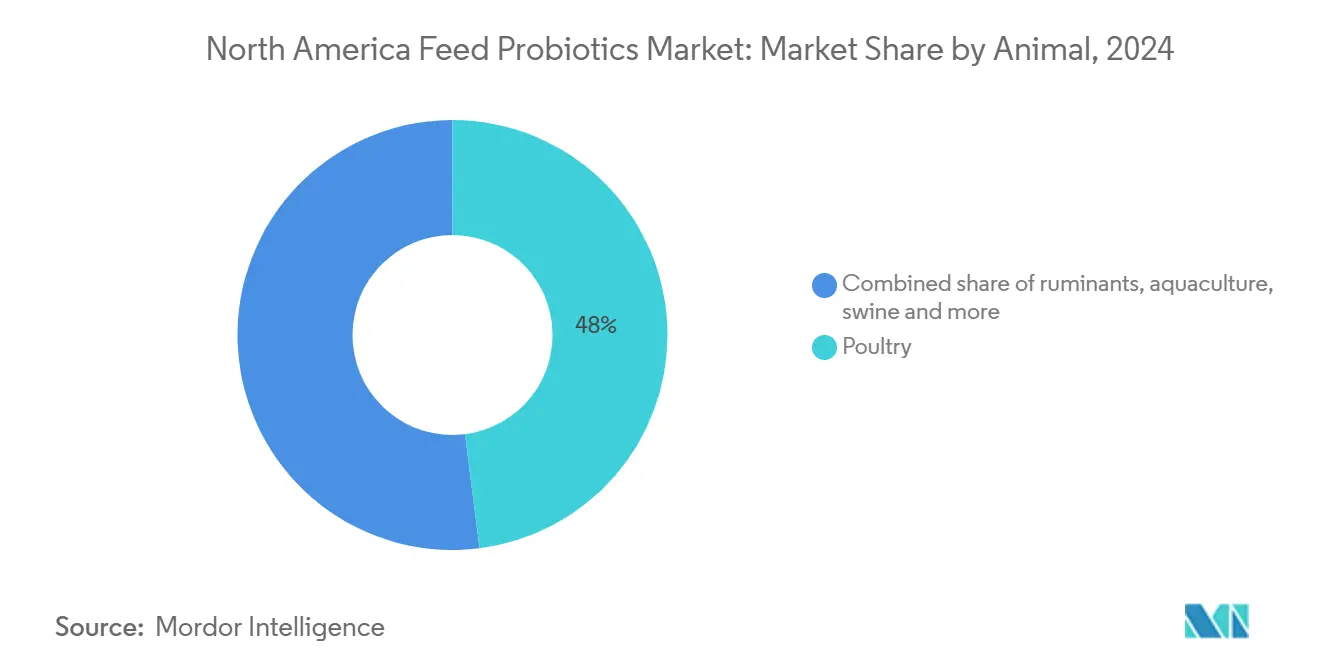
- By animal, poultry captured 48.0% of the North America feed probiotics market size in 2024, whereas ruminants are forecast to expand at a 6.2% CAGR between 2025 and 2030.
- By geography, the United States commanded 70.6% market share in 2024, while Canada recorded the highest projected 7.8% CAGR to 2030.
North America Feed Probiotics Market Trends and Insights
Drivers Impact Analysis*
| Driver | (~) % Impact on CAGR Forecast | Geographic Relevance | Impact Timeline |
|---|---|---|---|
| Antibiotic-free meat demand surge | +1.2% | United States and Canada | Medium term (2-4 years) |
| Rising aquaculture feed volumes | +0.8% | Coastal United States and Maritime Canada | Long term (≥ 4 years) |
| Functional-feed investments by integrators | +0.7% | Midwest and Southeast United States | Short term (≤ 2 years) |
| United States Veterinary Feed Directive enforcement | +0.6% | United States; spillover to Canada and Mexico | Medium term (2-4 years) |
| Precision livestock farming adoption | +0.4% | Technology-forward operations across North America | Long term (≥ 4 years) |
| Canadian alternative-protein research funding | +0.3% | Canada with technology transfer to United States | Long term (≥ 4 years) |
| Source: Mordor Intelligence | |||
Antibiotic-free meat demand surge
North American retailers have tightened procurement policies that ban routine antibiotic use, pushing integrators to adopt probiotic premixes that protect flock health while meeting label claims. Large poultry companies such as Tyson Foods Incorporated and Pilgrim’s Pride Corporation report measurable feed-conversion improvements after switching to high-cell-count Lactobacilli blends. Price premiums on “No Antibiotics Ever” products compensate producers for the incremental feed cost. Regulatory guardrails under the United States Food and Drug Administration (FDA) Center for Veterinary Medicine reinforce this transition by upholding strict oversight of medically important antibiotics[2]Source: Center for Veterinary Medicine, “Veterinary Feed Directive Information,” fda.gov. Consumer advocacy campaigns continue to highlight antimicrobial resistance, preserving structural demand for probiotic alternatives.
Rising aquaculture feed volumes
Expansion of land-based recirculating aquaculture systems raises demand for water-stable probiotic formulations that curb pathogenic bacteria in dense tanks. National Oceanic and Atmospheric Administration (NOAA) initiatives streamline aquaculture permitting, catalyzing salmon and shrimp capacity gains[3]Source: National Oceanic and Atmospheric Administration Fisheries, “NOAA Aquaculture Strategy,” noaa.gov. Canadian operators in Nova Scotia and New Brunswick deploy Bacillus spores in biofloc systems to sustain water quality, reduce mortality, and deliver incremental growth. Suppliers able to prove viability in saline conditions capture premium margins, positioning aquaculture as a high-value niche within the wider North America feed probiotics market.
Functional-feed investments by integrators
Major agribusiness companies are increasing their investments in functional feed research and development to create customized probiotic formulations for specific production systems. Cargill, Incorporated has expanded its feed technology centers to develop targeted probiotic solutions that address gut health challenges across different livestock species and production environments. These investments support vertical integration strategies, allowing feed manufacturers to develop proprietary probiotic blends that differentiate their products and strengthen customer relationships. The growing focus on precision nutrition necessitates advanced probiotic formulations that work synergistically with other functional ingredients, including enzymes, organic acids, and prebiotics.
United States Veterinary Feed Directive enforcement
The FDA Veterinary Feed Directive (VFD) restricts prophylactic antibiotic use in livestock production, increasing the demand for probiotic alternatives. The VFD requires veterinary oversight for medically important antibiotics, which encourages producers to use probiotics for prevention rather than antibiotics for treatment. The costs of veterinary consultations and prescriptions make routine antibiotic use less economical compared to probiotic supplements. The FDA Center for Veterinary Medicine provides guidance that supports VFD implementation by defining appropriate antibiotic use and recommending probiotics for disease prevention. The regulations influence practices beyond the United States, as Canadian and Mexican producers align their operations to maintain access to U.S. markets. This regulatory environment supports stable market conditions for probiotic manufacturers by establishing barriers to renewed antibiotic use.
Restraint Impact Analysis*
| Restraint | (~) % Impact on CAGR Forecast | Geographic Relevance | Impact Timeline |
|---|---|---|---|
| Thermal instability in pelleting | −0.9% | North America feed mills with high-temperature lines | Short term (≤ 2 years) |
| High regulatory and R&D costs | −0.6% | United States and Canada | Medium term (2-4 years) |
| Classification gaps for postbiotics | −0.4% | United States FDA and Association of American Feed Control Officials | Medium term (2-4 years) |
| Culture-media supply volatility | −0.3% | Global supply chains feeding North American plants | Short term (≤ 2 years) |
| Source: Mordor Intelligence | |||
Thermal instability in pelleting
The high-temperature pelleting process, typically operating at 80-90°C, significantly reduces probiotic viability, particularly affecting heat-sensitive Lactobacillus and Bifidobacterium strains commonly used in feed formulations. Feed manufacturers must balance processing efficiency with probiotic preservation, as higher temperatures needed for optimal pellet quality and production rates adversely affect microbial survival. While microencapsulation technologies can protect probiotics, they increase production costs by 15-25%, limiting acceptance among cost-conscious livestock producers. Technical limitations confine probiotic applications primarily to cold-pressed or liquid feed systems, which represent smaller market segments compared to pelleted feeds.
High regulatory and R&D costs
The high costs of Generally Recognized as Safe (GRAS) registrations and Canadian Food Inspection Agency (CFIA) approvals impede new-strain launches and create barriers for smaller companies entering the market. The FDA food additive petition process requires comprehensive safety and efficacy data, with costs ranging from USD 0.5 million to 1.5 million per strain. Similarly, CFIA approvals require extensive documentation under Canadian feed regulations. The expiration of the FDA-AAFCO Memorandum of Understanding in October 2024 eliminates streamlined ingredient definition processes, requiring companies to pursue formal regulatory pathways, including Animal Food Ingredient Consultation (AFIC) procedures. This regulatory environment extends development timelines and increases capital requirements, particularly affecting companies developing novel probiotic strains or delivery mechanisms.
*Our forecasts treat driver/restraint impacts as directional, not additive. The impact forecasts reflect baseline growth, mix effects, and variable interactions.
Segment Analysis
By Sub Additive: Thermal-robust Bacillus challenges Lactobacilli leadership
Lactobacilli retained 32.1% of the North America feed probiotics market share in 2024, anchored by extensive literature support and streamlined Association of American Feed Control Officials definitions. Bifidobacteria, despite a smaller base, are advancing at a 7.8% CAGR as ruminant producers embrace strains that modulate volatile fatty acid profiles. Bacillus spores, captured under “other probiotics,” win projects where pelleting stability is non-negotiable, and university licensing deals highlight rising research interest. The University of Arkansas patented a Bacillus coagulans strain showing full survival at 90 °C; Kent Nutrition Group plans a commercial launch in 2025. This innovation illustrates the trend toward processing-tolerant cultures that protect functional promises during real-world manufacturing.
Competitive differentiation increasingly hinges on demonstrating in vivo outcomes under commercial stocking densities rather than laboratory conditions alone. DSM-Firmenich AG leverages high solids fermentation and triple-coat encapsulation to preserve cell counts past pelleting, whereas Evonik Industries AG pairs probiotic dosing with online gut-health diagnostics. The North American feed probiotics industry now evaluates strains not solely on colony-forming units but on metabolite signatures such as butyrate yield.


By Animal: Poultry volumes dominate, Ruminant accelerates
Poultry applications delivered 48.0% of the North America feed probiotics market size in 2024, driven by broiler operations that require fast-acting gut microbiome support to sustain feed-conversion ratios under antibiotic-free protocols. Layer formulators incorporate probiotics for egg-shell integrity and micronutrient absorption, widening the usage base. Ruminant adoption gathers momentum; dairy herds supplement Bifidobacteria to mitigate sub-acute ruminal acidosis and lift milk solids, pushing the segment toward a 6.2% CAGR. Feedlots integrate Bacillus blends to curb liver abscess incidence, signaling cross-species knowledge transfer.
Swine nurseries continue to rely on Lactobacilli and Enterococcus during weaning stress, though expansion is tempered by African Swine Fever vigilance in Mexico. Aquaculture remains niche by volume but commands four times higher per-ton inclusion revenue due to specialized water-stable beads. Companion animals enter the narrative, yet volumes remain marginal relative to food animal demand.
Geography Analysis
The United States contributed 70.6% of the 2024 value, anchored by the continent’s largest livestock inventory and nearly 6,000 commercial feed mills equipped for probiotic premix inclusion. FDA Veterinary Feed Directive oversight keeps antibiotics under prescription, sustaining probiotic pull-through. Precision livestock farming pilots in the Midwest employ micro-sensors to titrate Bacillus inoculation levels, tying additive usage to real-time health metrics. Multinational feed groups exploit extensive dealer networks to distribute strain-specific products across both contract and independent operations.
Canada is forecast to record a 7.8% CAGR through 2030, catalyzed by Protein Industries Canada’s CAD 150 million (USD 111 million) renewed mandate that co-funds microbial feed-ingredient projects. Canadian Food Inspection Agency policies harmonize closely with FDA requirements yet offer targeted fast-track lanes for evidence-backed strains, shortening commercialization cycles. Maritimes aquaculture clusters deploy water-stable probiotics to manage biofloc and improve salmon survival, boosting niche high-margin demand.
Mexico remains smaller in absolute terms but plays a strategic role as an exporter aligned with United States antibiotic-free expectations. SENASICA (National Service for Agro-alimentary Public Health, Safety and Quality) regulations under NOM-012-SAG/ZOO-2020 require transparent strain identification, facilitating cross-border trade. Caribbean and Central American markets adopt probiotics primarily for shrimp grow-out ponds, leveraging North American technical support. Overall, geographic growth patterns track trade relationships and regulatory convergence that reinforce market continuity.
Competitive Landscape
Top Companies in North America Feed Probiotics Market
The top five players, DSM-Firmenich AG, Evonik Industries AG, Kerry Group PLC, and others, controlled a modest share of the revenue in 2024, signifying moderate concentration. DSM-Firmenich AG leads with patented high solids fermentation and a North Carolina facility that guarantees rapid delivery to United States integrators. Evonik Industries AG integrates GutCare spores with its cloud-based health platform, generating recurring software-plus-ingredient revenue. Kemin Industries Incorporated leverages antimicrobial feed additives that complement probiotics for holistic pathogen control.
Strategic moves highlight vertical integration and data coupling. Archer-Daniels-Midland Company acquired Deerland Probiotics and Enzymes to internalize spore production, while Cargill Incorporated expanded a Minnesota fermentation unit dedicated to custom strains for poultry super-integrators. Smaller innovators focus on micro-encapsulation patents and postbiotic extracts to carve niches.
Regulatory complexity since the 2024 FDA-Association of American Feed Control Officials memorandum lapse tilts the advantage toward firms with dedicated regulatory affairs teams capable of navigating expanded petition pathways. Private-label deals proliferate as retailers push antibiotic-free labels, opening white-space for agile formulators able to supply custom blends at scale.
North America Feed Probiotics Industry Leaders
Evonik Industries AG
IFF(Danisco Animal Nutrition)
Kerry Group PLC
DSM-Firmenich AG
Adisseo France S.A.S.
- *Disclaimer: Major Players sorted in no particular order

Recent Industry Developments
- October 2025: Lallemand Animal Nutrition introduced LEVUCELL Trivantage, a comprehensive feed supplement combining multiple nutritional components for dairy and beef producers and equine owners in the United States. The product integrates three established technologies - LEVUCELL SC for rumen efficiency, PROTERNATIVE for gut integrity, and AGRIMOS for immune system support - to address digestive health in a single solution.
- March 2025: International Flavors & Fragrances Inc. (IFF) launched Enviva PRO, a three-strain Bacillus probiotic. The product is specifically formulated for swine to support gut health and productivity during the critical weaning phase.
- January 2025: Cargill showcased Biostrong Dual, which combines postbiotic metabolites and phytogenic extracts. The product aims to improve poultry gut health, nutrient absorption, and stress resistance. This addition to Cargill's micronutrition portfolio serves as an alternative to antibiotic growth promoters in sustainable poultry production.


North America Feed Probiotics Market Report Scope
The North America Feed Probiotics Market Report is Segmented by Sub Additive (Bifidobacteria, Enterococcus, Lactobacilli, Pediococcus, Streptococcus, Other Probiotics), Animal (Aquaculture, Poultry, Ruminants, Swine, Other Animals), and Geography (Canada, Mexico, United States, Rest of North America). The Market Forecasts are Provided in Terms of Value (USD) and Volume.
Sub Additive
| Bifidobacteria |
| Enterococcus |
| Lactobacilli |
| Pediococcus |
| Streptococcus |
| Other Probiotics |
Animal
| Aquaculture | By Sub Animal | Fish |
| Shrimp | ||
| fish | ||
| Other Aquaculture Species | ||
| Poultry | By Sub Animal | Broiler |
| Layer | ||
| Other Poultry Birds | ||
| Ruminants | By Sub Animal | Beef Cattle |
| Dairy Cattle | ||
| Other Ruminants | ||
| Swine | ||
| Other Animals |
Country
| Canada |
| Mexico |
| United States |
| Rest of North America |
| Sub Additive | Bifidobacteria | ||
| Enterococcus | |||
| Lactobacilli | |||
| Pediococcus | |||
| Streptococcus | |||
| Other Probiotics | |||
| Animal | Aquaculture | By Sub Animal | Fish |
| Shrimp | |||
| fish | |||
| Other Aquaculture Species | |||
| Poultry | By Sub Animal | Broiler | |
| Layer | |||
| Other Poultry Birds | |||
| Ruminants | By Sub Animal | Beef Cattle | |
| Dairy Cattle | |||
| Other Ruminants | |||
| Swine | |||
| Other Animals | |||
| Country | Canada | ||
| Mexico | |||
| United States | |||
| Rest of North America | |||


Market Definition
- FUNCTIONS - For the study, feed additives are considered to be commercially manufactured products that are used to enhance characteristics such as weight gain, feed conversion ratio, and feed intake when fed in appropriate proportions.
- RESELLERS - Companies engaged in reselling feed additives without value addition have been excluded from the market scope, to avoid double counting.
- END CONSUMERS - Compound feed manufacturers are considered to be end-consumers in the market studied. The scope excludes farmers buying feed additives to be used directly as supplements or premixes.
- INTERNAL COMPANY CONSUMPTION - Companies engaged in the production of compound feed as well as the manufacturing of feed additives are part of the study. However, while estimating the market sizes, the internal consumption of feed additives by such companies has been excluded.
| Keyword | Definition |
|---|---|
| Feed additives | Feed additives are products used in animal nutrition for purposes of improving the quality of feed and the quality of food from animal origin, or to improve the animals’ performance and health. |
| Probiotics | Probiotics are microorganisms introduced into the body for their beneficial qualities. (It maintains or restores beneficial bacteria to the gut). |
| Antibiotics | Antibiotic is a drug that is specifically used to inhibit the growth of bacteria. |
| Prebiotics | A non-digestible food ingredient that promotes the growth of beneficial microorganisms in the intestines. |
| Antioxidants | Antioxidants are compounds that inhibit oxidation, a chemical reaction that produces free radicals. |
| Phytogenics | Phytogenics are a group of natural and non-antibiotic growth promoters derived from herbs, spices, essential oils, and oleoresins. |
| Vitamins | Vitamins are organic compounds, which are required for normal growth and maintenance of the body. |
| Metabolism | A chemical process that occurs within a living organism in order to maintain life. |
| Amino acids | Amino acids are the building blocks of proteins and play an important role in metabolic pathways. |
| Enzymes | Enzyme is a substance that acts as a catalyst to bring about a specific biochemical reaction. |
| Anti-microbial resistance | The ability of a microorganism to resist the effects of an antimicrobial agent. |
| Anti-microbial | Destroying or inhibiting the growth of microorganisms. |
| Osmotic balance | It is a process of maintaining salt and water balance across membranes within the body's fluids. |
| Bacteriocin | Bacteriocins are the toxins produced by bacteria to inhibit the growth of similar or closely related bacterial strains. |
| Biohydrogenation | It is a process that occurs in the rumen of an animal in which bacteria convert unsaturated fatty acids (USFA) to saturated fatty acids (SFA). |
| Oxidative rancidity | It is a reaction of fatty acids with oxygen, which generally causes unpleasant odors in animals. To prevent these, antioxidants were added. |
| Mycotoxicosis | Any condition or disease caused by fungal toxins, mainly due to contamination of animal feed with mycotoxins. |
| Mycotoxins | Mycotoxins are toxin compounds that are naturally produced by certain types of molds (fungi). |
| Feed Probiotics | Microbial feed supplements positively affect gastrointestinal microbial balance. |
| Probiotic yeast | Feed yeast (single-cell fungi) and other fungi used as probiotics. |
| Feed enzymes | They are used to supplement digestive enzymes in an animal’s stomach to break down food. Enzymes also ensure that meat and egg production is improved. |
| Mycotoxin detoxifiers | They are used to prevent fungal growth and to stop any harmful mold from being absorbed in the gut and blood. |
| Feed antibiotics | They are used both for the prevention and treatment of diseases but also for rapid growth and development. |
| Feed antioxidants | They are used to protect the deterioration of other feed nutrients in the feed such as fats, vitamins, pigments, and flavoring agents, thus providing nutrient security to the animals. |
| Feed phytogenics | Phytogenics are natural substances, added to livestock feed to promote growth, aid in digestion, and act as anti-microbial agents. |
| Feed vitamins | They are used to maintain the normal physiological function and normal growth and development of animals. |
| Feed flavors and sweetners | These flavors and sweeteners help to mask tastes and odors during changes in additives or medications and make them ideal for animal diets undergoing transition. |
| Feed acidifiers | Animal feed acidifiers are organic acids incorporated into the feed for nutritional or preservative purposes. Acidifiers enhance congestion and microbiological balance in the alimentary and digestive tracts of livestock. |
| Feed minerals | Feed minerals play an important role in the regular dietary requirements of animal feed. |
| Feed binders | Feed binders are the binding agents used in the manufacture of safe animal feed products. It enhances the taste of food and prolongs the storage period of the feed. |
| Key Terms | Abbreviation |
| LSDV | Lumpy Skin Disease Virus |
| ASF | African Swine Fever |
| GPA | Growth Promoter Antibiotics |
| NSP | Non-Starch Polysaccharides |
| PUFA | Polyunsaturated Fatty Acid |
| Afs | Aflatoxins |
| AGP | Antibiotic Growth Promoters |
| FAO | The Food And Agriculture Organization of the United Nations |
| USDA | The United States Department of Agriculture |


Research Methodology
Mordor Intelligence follows a four-step methodology in all our reports.
- Step-1: IDENTIFY KEY VARIABLES: In order to build a robust forecasting methodology, the variables and factors identified in Step-1 are tested against available historical market numbers. Through an iterative process, the variables required for market forecast are set and the model is built on the basis of these variables.
- Step-2: Build a Market Model: Market-size estimations for the forecast years are in nominal terms. Inflation is not a part of the pricing, and the average selling price (ASP) is kept constant throughout the forecast period.
- Step-3: Validate and Finalize: In this important step, all market numbers, variables and analyst calls are validated through an extensive network of primary research experts from the market studied. The respondents are selected across levels and functions to generate a holistic picture of the market studied.
- Step-4: Research Outputs: Syndicated Reports, Custom Consulting Assignments, Databases & Subscription Platforms


