Market Overview
| Study Period | 2021 - 2031 |
|---|---|
| Forecast Data Period | 2026 - 2031 |
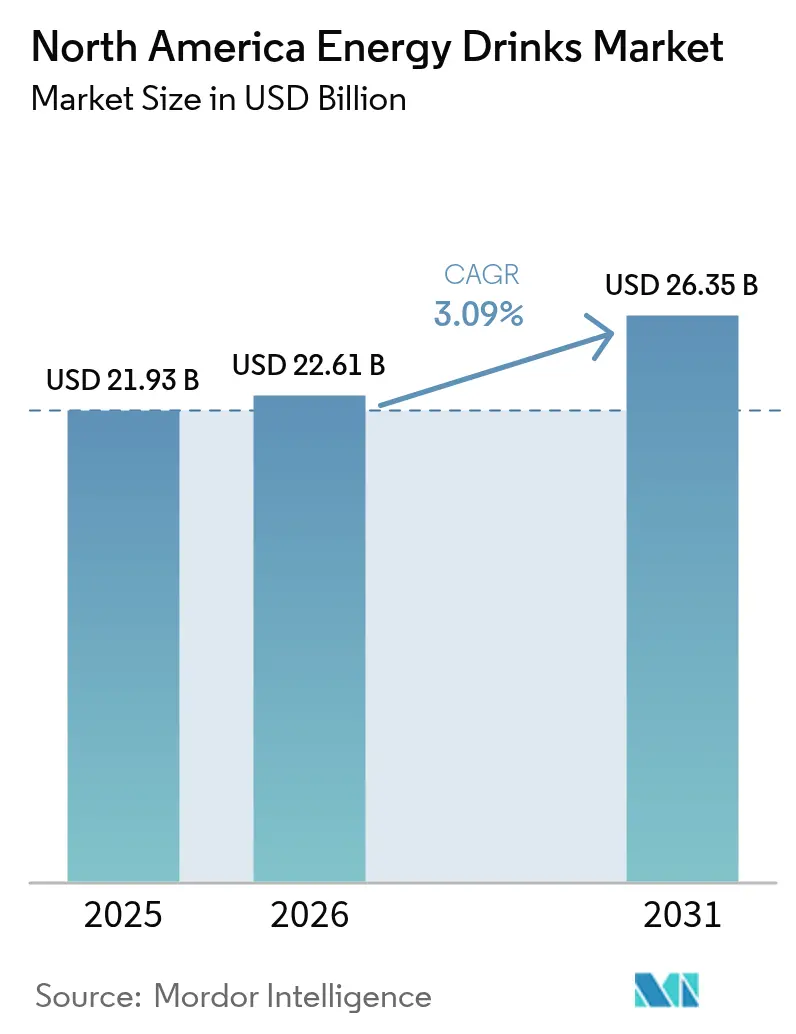
| Base Year Market Size (2025) | USD 21.93 Billion |
| Market Size (2026) | USD 22.61 Billion |
| Market Size (2031) | USD 26.35 Billion |
| Growth Rate (2026 - 2031) | 3.09% CAGR |
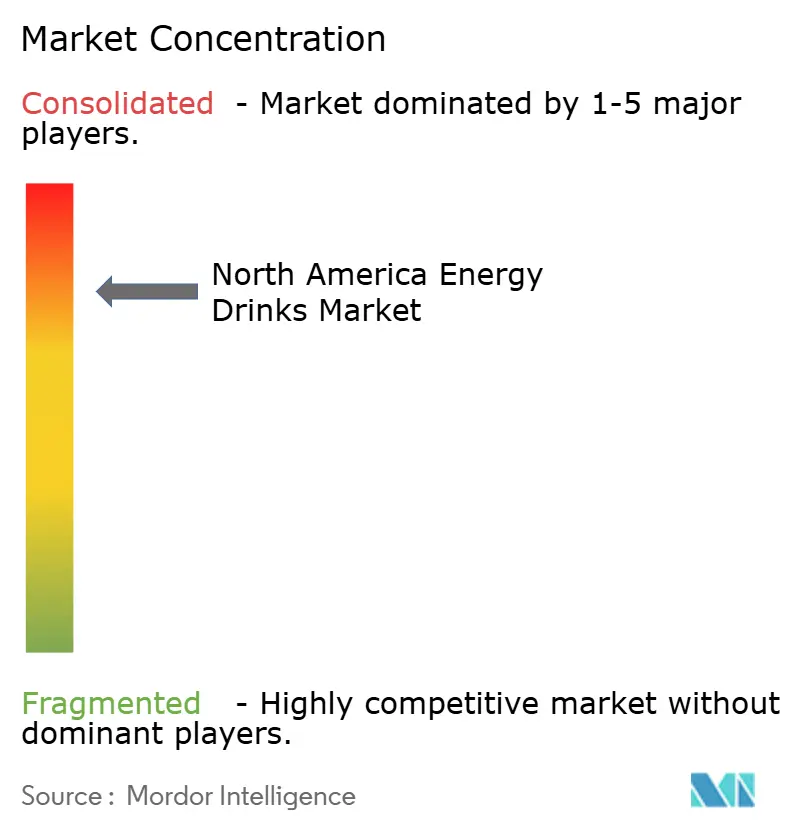
| Market Concentration | High |
Major Players
*Disclaimer: Major Players sorted in no particular order Image © Mordor Intelligence. Reuse requires attribution under CC BY 4.0. |
|
North America Energy Drinks Market Analysis by Mordor Intelligence
The North America energy drinks market size was valued at USD 21.93 billion in 2025 and estimated to grow from USD 22.61 billion in 2026 to reach USD 26.35 billion by 2031, at a CAGR of 3.09% during the forecast period (2026-2031). Legacy formulations built around high sugar and synthetic caffeine are losing ground as consumers gravitate toward clean-label, sugar-free, and function-forward beverages positioned for immunity, cognition, and recovery benefits. Premium pricing power rests with brands that substantiate claims through recognizable botanical extracts, non-nutritive sweeteners, and transparent sourcing, while mainstream incumbents rely on aggressive flavor rotation to hold shelf space. Channel realignment is equally pronounced: convenience stores remain the single largest off-trade venue, yet dollar stores, club stores, and direct-to-consumer subscriptions are growing faster as inflation lifts price sensitivity across income tiers. Meanwhile, private-label energy drinks are expanding swiftly, eroding brand loyalty among value shoppers and pressuring manufacturers to sharpen differentiation through functional innovation and lifestyle marketing.
Key Report Takeaways
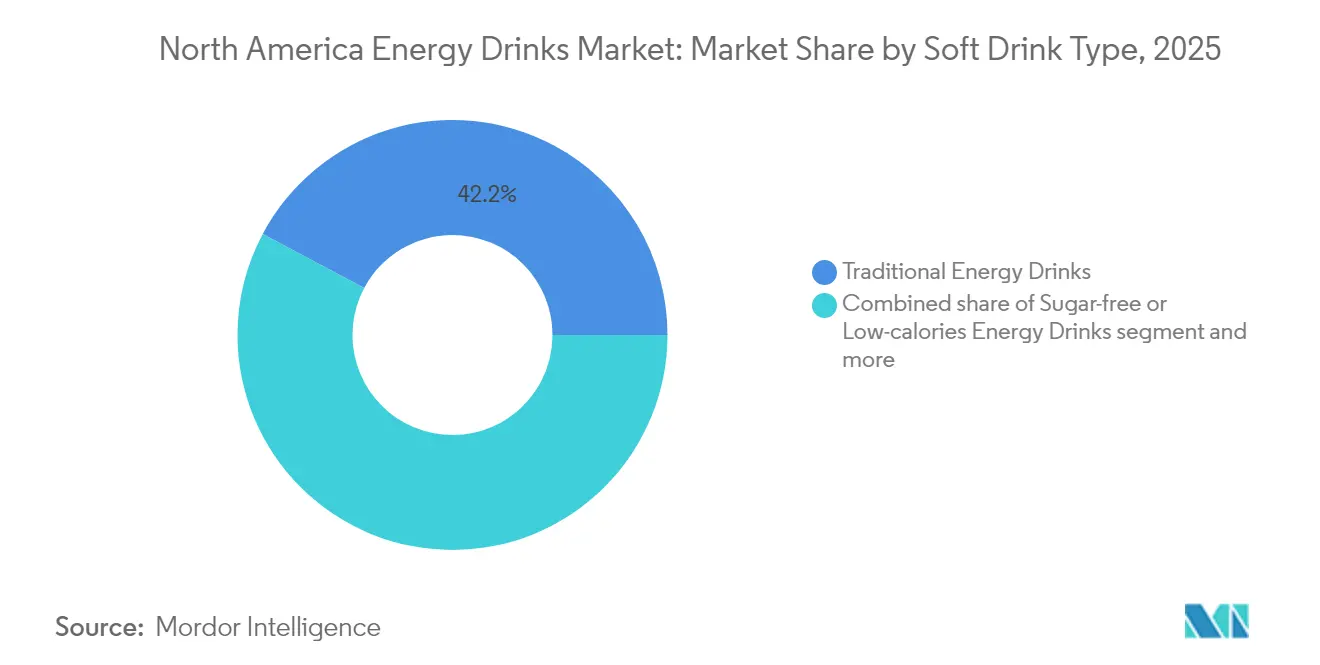
- By soft-drink type, traditional formulations still held 42.21% of the North America energy drinks market share in 2025, whereas natural and organic variants are advancing at a 4.86% CAGR to 2031.
- By packaging, metal cans captured 55.74% of the North American energy drinks market size in 2025, while glass bottles are forecast to expand at a 5.01% CAGR through 2031.
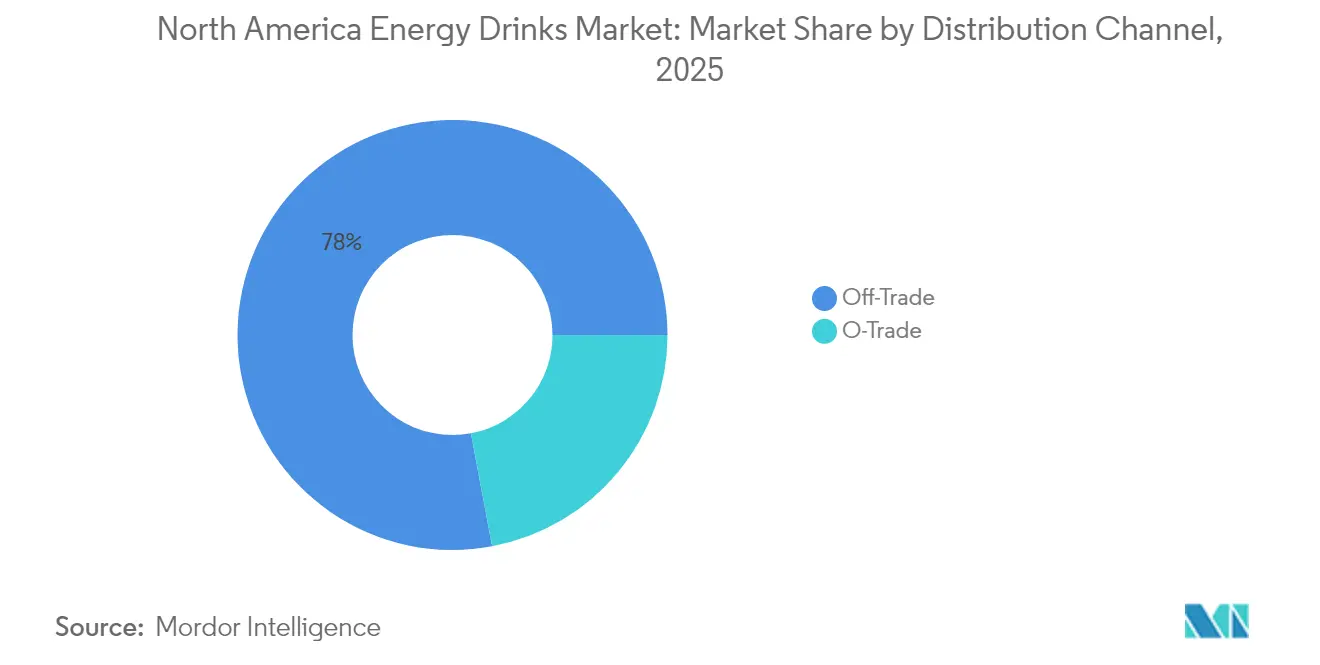
- By distribution channel, off-trade outlets commanded 77.95% of sales in 2025; on-trade venues are set to increase at a 5.88% CAGR as post-pandemic traffic normalizes.
- By functionality, endurance-oriented drinks held 52.88% of revenue in 2025, whereas muscle-recovery variants enriched with BCAAs and electrolytes are on pace for a 5.12% CAGR to 2031.
- By country, the United States held 91.73% of the North American energy drinks market share in 2025, while Canada is projected to grow at a 5.78% CAGR through 2031.
Note: Market size and forecast figures in this report are generated using Mordor Intelligence’s proprietary estimation framework, updated with the latest available data and insights as of 2026.
North America Energy Drinks Market Trends and Insights
Drivers Impact Analysis*
| Driver | (~) % Impact on CAGR Forecast | Geographic Relevance | Impact Timeline |
|---|---|---|---|
| Expansion of functional claims like immune support spurs growth | +0.7% | North America, with stronger uptake in United States urban centers and Canadian metros | Medium term (2-4 years) |
| Millennials and Gen Z drive demand for performance enhancement products | +0.9% | United States and Canada, particularly in 18-34 age cohort | Short term (≤ 2 years) |
| Sports sponsorships and youth marketing campaigns enhance brand visibility | +0.5% | United States and Mexico, with spillover to Canada via cross-border media | Medium term (2-4 years) |
| Social media influence promotes trial of new flavors and shots | +0.6% | North America, led by United States TikTok and Instagram adoption | Short term (≤ 2 years) |
| Demand for cognitive enhancement fuels hybrid beverages | +0.8% | United States and Canada, especially among professionals and students | Medium term (2-4 years) |
| Urban lifestyle demands quick energy solutions for busy schedules | +0.7% | United States, Canada, and Mexico urban corridors (Toronto, New York, Mexico City) | Long term (≥ 4 years) |
| Source: Mordor Intelligence | |||


Expansion of functional claims like immune support spurs growth
The energy drinks industry is evolving as functional claims related to immunity, stress resilience, and cognition gain traction. Beverages are transitioning from basic caffeine-based formulations to multi-benefit "daily performance" products, with consumers increasingly seeking adaptogens like ashwagandha, rhodiola, and ginseng, alongside nootropics such as L-theanine, alpha-GPC, and lion’s mane. This trend is driving brands to create integrated "energy + immunity + focus" formulations, where plant-based caffeine sources (e.g., green tea, guayusa, matcha, yerba mate, and guarana, as seen in GURU’s organic offerings) act as cleaner carriers for functional ingredients rather than simple stimulants. Research and development efforts now focus on achieving specific cognitive or immune outcomes by leveraging ingredient synergies, enabling premium pricing over standard taurine-caffeine-sugar mixes. Regulatory frameworks, such as Canada’s supplemented food guidelines capping caffeine at 180 mg per serving and mandating age and us, age warnings, are pushing formulators to enhance the perceived effectiveness of caffeine while ensuring compliance [1]Source: Government of Canada, "New Cautionary Labels on Caffeinated Energy Drinks", canada.ca . Clinically validated ingredients, like Nutrition21’s nooLVL, a bonded arginine-silicate complex proven to improve attention, working memory, and reaction time, are setting benchmarks for substantiated claims that align with regulatory standards. This clinical evidence bridges marketing and regulatory requirements, allowing brands to craft precise front-of-pack claims under food and supplement regulations. Retailers are responding by expanding premium shelf space, particularly in natural and better-for-you aisles near vitamins and sports nutrition products. This ecosystem is driving portfolio segmentation, with traditional energy drinks targeting price-sensitive consumers, while functional lines appeal to label-conscious buyers seeking immunity and mental well-being support.
Millennials and Gen Z drive demand for performance enhancement products
Millennials and Gen Z are driving significant changes in the energy drinks market by redefining performance enhancement as a lifestyle choice rather than a niche application. Consumers aged 18–34 dominate category volume, prioritizing zero-sugar formulations, transparent ingredient sourcing, and brands that align with their fitness, esports, or creator-driven identities. NIH data reveal that nearly one-third of United States teens aged 12–17 regularly consume energy drinks, making them the second-most used dietary supplement after multivitamins, underscoring the importance of targeting younger demographics to build long-term brand loyalty [2]Source: National Center for Complementary and Integrative Health (NCCIH), "Energy Drinks", nccih.nih.gov . Celsius Holdings has capitalized on this shift, achieving 84% year-on-year revenue growth in Q2 2025 by positioning itself as a “fitness-forward, better-for-you energy” brand. Its Alani Nu line has successfully tapped into the underserved female gym-goer segment, recording 129% growth through tailored flavors, pastel aesthetics, and influencer partnerships. The expanded Celsius–PepsiCo partnership in September 2025 has further enhanced accessibility in convenience stores and mass merchandisers, embedding energy drinks into daily routines alongside RTD protein, meal kits, or snacks. Similarly, C4 Energy’s partnership with WWE, launched at WrestleMania XL in 2024, targets Gen Z males by integrating the product into wrestling storylines, entrances, and athlete content, fostering trial by connecting the brand to themes of strength and training. Retailers are increasingly allocating cooler space to brands that resonate with performance-focused subcultures, such as gym-goers, female consumers, or gamers, while legacy soda brands struggle to compete due to their focus on refreshment and nostalgia. Pure-play energy drink brands are leveraging their alignment with youth subcultures and data-backed growth among 18–34-year-olds and teens to secure prime shelf placement, aggressive sampling, and enhanced digital marketing activations.
Sports sponsorships and youth marketing campaigns enhance brand visibility
Sports sponsorships and youth-focused marketing campaigns are increasingly driving brand visibility by embedding energy drink products into cultural touchpoints relevant to fitness enthusiasts, gamers, and extreme sports fans. These strategies foster organic word-of-mouth promotion, which is more effective than traditional advertising in an era of ad-blockers and fragmented media consumption. By positioning energy drinks as performance enhancers rather than simple refreshments, brands connect consumption to aspirational moments such as pre-game rituals or recovery sessions, resonating strongly with youth demographics inclined toward functional beverages. For instance, in 2023, UFC partnered with PRIME, a hydration drink brand founded by Logan Paul and KSI, in a multi-year global marketing agreement, making PRIME the Official Global Sports Drink of UFC. This partnership integrates PRIME into UFC assets, including Pay-Per-View events and Fight Nights, with prominent branding inside the Octagon and across broadcasts, translating into increased retail sales as athletes’ social media posts featuring branded products drive immediate consumer interest. Youth campaigns amplify this impact through AR filters, Twitch integrations, and campus sampling initiatives, gamifying product discovery and ensuring brands like Ghost Lifestyle remain prominent during Fortnite streams or gym-related TikTok content without relying on traditional television advertising. The synergy between sponsorships and digital campaigns creates a self-sustaining cycle where event exposure generates user-generated content (UGC), amplified by algorithms to reach similar audiences, maintaining visibility beyond the event while leveraging influencer authenticity to navigate youth marketing regulations. Retailers prioritize these high-visibility brands in prime store locations, supported by proven sales data from partnerships, ultimately redefining visibility as a metric tied to cultural relevance and activation-driven ROI rather than traditional impressions.
Urban lifestyle demands quick energy solutions for busy schedules
Urbanization trends, with Canada’s urban population surpassing 80% in 2023 and the United States exceeding 84% in 2024 according to World Bank data, are driving increased energy drink consumption in metropolitan areas such as Toronto, Montreal, Vancouver, and major American cities like New York, Los Angeles, Chicago, and San Francisco [3]Source: World Bank, "Urban Population (% of Total Population) - United States", data.worldbank.org . Longer commutes, shift work, and 24-hour economies are reducing sleep opportunities, creating demand for instant alertness solutions. Convenience stores are benefiting from this trend, with energy drink sales rising during fuel stops, lunch breaks, and late-night shifts, making these beverages a preferred choice for urban consumers managing tight schedules. Quick-service restaurants (QSRs) are also capitalizing on this demand, with initiatives like Dunkin’s February 2024 launch of Sparkd’ Energy, a competitively priced carbonated drink containing vitamins B6 and B12, caffeine, and guarana, designed to attract on-the-go workers through drive-through channels. Meanwhile, dollar stores are experiencing growth as inflation drives consumers to trade down from premium options, while mass merchandisers expand assortments and club stores scale bulk purchases. However, traditional convenience outlets in suburban areas are facing challenges due to declining foot traffic. This channel fragmentation underscores the importance of a multi-format distribution strategy, with brands leveraging extensive broker networks to maintain a competitive edge over direct-to-consumer (DTC) startups that lack omnichannel reach. Urban density, with 80-84% of the population residing in cities, amplifies sales velocity in convenience stores and QSRs, while diversified distribution ensures availability across various touchpoints, such as gas stations, dollar stores, and drive-throughs. Dunkin’s approach exemplifies how QSRs can convert coffee customers into energy drink consumers during peak fatigue periods, reinforcing the category’s relevance. Energy drinks have become integral to urban lifestyles, bridging commutes and work shifts, while robust distribution strategies ensure market resilience in high-density urban environments.
Restraints Impact Analysis*
| Restraint | (~) % Impact on CAGR Forecast | Geographic Relevance | Impact Timeline |
|---|---|---|---|
| Competition from other hydration formats | -0.4% | North America, with strongest pressure in United States sports-drink aisles | Short term (≤ 2 years) |
| Regulatory pressure on sugar and HFSS products | -0.6% | Mexico and select United States states (California, New York), spillover to Canada | Medium term (2-4 years) |
| Supply chain issues for natural ingredients disrupt availability | -0.3% | North America, particularly affecting organic and Fair Trade brands | Medium term (2-4 years) |
| Regulatory restrictions on caffeine content and age verification limit impulse sales | -0.5% | Canada and Mexico, with United States state-level proposals emerging | Long term (≥ 4 years) |
| Source: Mordor Intelligence | |||
Competition from other hydration formats
The energy drinks market is facing increasing competition from alternative hydration formats as consumers shift toward sports drinks, electrolyte waters, and functional hydration beverages that emphasize recovery and sustained vitality without the overstimulation linked to high-caffeine formulas. These alternatives are gaining prominence in key consumption occasions such as post-workout rehydration and daily wellness routines, where products like Gatorade's sports drinks and Bodyarmor's rehydration powders with no artificial additives appeal to fitness-focused consumers seeking electrolytes over energy spikes. Sports drinks are outperforming energy drinks in convenience stores, driven by innovations like low-sugar ION4 systems and clean-label options that attract proactive health-conscious buyers. As brands blur category lines, energy drinks incorporating ingredients like BCAAs and creatine attempt to mimic sports nutrition, but hydration-focused brands maintain a competitive edge in recovery and electrolyte replenishment, drawing volume away from traditional energy drinks at gym exits and recovery moments. Retailers are responding by allocating more cooler space to high-velocity hydration products, reducing shelf presence for energy drinks in fitness-oriented sections, with Bodyarmor's natural positioning resonating amid clean-label demands. Furthermore, hydration formats are expanding into "proactive wellness" with functional additives like adaptogens, appealing to millennials prioritizing gut health, mood support, and muscle recovery over caffeine-based energy boosts. Enhanced hydration innovations, including hydrogen-infused and amino-acid waters, are further diluting the role of energy drinks beyond acute performance needs. In North America, where hydration trends have surged in consumer interest as reflected in Google search data by March 2025, this competition is capping energy drink growth by converting impulse purchases into deliberate hydration choices, especially as sodium concerns and demand for clean alternatives rise, narrowing energy drinks' role to specific "alertness" niches within the evolving functional beverage landscape.
Regulatory restrictions on caffeine content and age verification limit impulse sales
Regulatory restrictions on caffeine content and age verification are significantly impacting impulse sales in the energy drinks market. Measures such as Health Canada's 180 mg per serving caffeine limit and mandatory cautionary statements effective January 1, 2026, which highlight cardiovascular and neurological risks for vulnerable groups, are forcing reformulations that dilute product potency and reduce premium appeal. Concurrently, bans in nearly 100 Quebec municipalities on energy drink sales in recreation centers and public facilities restrict access for younger consumers, particularly the 15-24 age group, where energy drink consumption is prevalent. These restrictions have spurred public health initiatives advocating for retail age-gating similar to alcohol and tobacco regulations. In contrast, the United States FDA's lack of a caffeine ceiling allows servings exceeding 300 mg, creating regulatory discrepancies that compel United States brands to reformulate or delist products for the Canadian market, increasing cross-border supply chain costs. Emerging United States state-level discussions on point-of-sale age verification could further disrupt convenience-store sales by adding checkout delays, reducing unplanned purchases during fuel or meal stops. These combined challenges, Canadian caffeine caps, Quebec's venue bans, youth-focused regulations, U.S. regulatory flexibility, and potential age verification, are collectively constraining the market's reliance on spontaneous urban sales. Retailers face the dilemma of stocking low-caffeine products with slower sales or limiting assortments to avoid verification challenges, ultimately restricting growth opportunities for established brands navigating divergent regulatory landscapes.
*Our forecasts treat driver/restraint impacts as directional, not additive. The impact forecasts reflect baseline growth, mix effects, and variable interactions.
Segment Analysis
By Soft Drink Type: Clean Labels Accelerate Organic Segment
Traditional energy drinks, led by Red Bull and Monster Beverage, accounted for 42.21% of the market share in 2025. However, these established players are losing ground to sugar-free and organic competitors that cater to health-conscious millennials and Gen Z consumers. The natural and organic energy drinks segment is projected to grow at a 4.86% CAGR through 2031, outpacing the market's average growth rate of 3.09%. This growth is driven by increasing consumer scrutiny of ingredient labels, with a preference for products free from artificial colors, flavors, and synthetic caffeine. In response to these trends, GURU Organic Energy reformulated its core product line in 2024, incorporating ingredients such as green tea, guayusa, matcha, yerba mate, and guarana. These changes, along with USDA Organic and Fair Trade certifications, enable GURU to secure premium shelf space in natural-foods retail channels. Similarly, Runa Clean Energy leverages guayusa, a holly leaf native to Ecuador, as a source of 150 milligrams of caffeine. With USDA Organic and Fair Trade certifications, Runa positions itself as a sustainable alternative to conventionally farmed coffee and synthetic caffeine.
Parallel to the rise of organic offerings, sugar-free and low-calorie energy drinks are capturing market share by appealing to consumers focused on calorie reduction rather than organic certifications. Over half of new energy drink launches in 2024 featured sugar-free claims, reflecting this shift in consumer preferences. Meanwhile, energy shots, such as the 2-ounce formats popularized by 5-Hour Energy, are experiencing a decline as consumers increasingly opt for larger ready-to-drink cans. These larger formats provide better value per milligram of caffeine and align with hydration trends. Additionally, hybrid energy drinks that combine energy with protein or electrolytes are carving out niche segments. However, these products lack the distribution scale necessary to compete with traditional or sugar-free market leaders.


By Packaging Type: Metal Dominates, Glass Gains Premium Traction
Metal cans accounted for 55.74% of the packaging market share in 2025, driven by their infinite recyclability and supply-chain efficiencies. These efficiencies allow manufacturers to source cans domestically, avoiding the freight costs associated with glass. Aluminum, when recycled content exceeds 50%, demonstrates a carbon footprint that is 79% lower in energy consumption and 67% lower in greenhouse-gas emissions compared to virgin PET. This threshold aligns with commitments from Coca-Cola, PepsiCo, and Keurig Dr Pepper, supported by their USD 100 million "Every Bottle Back" initiative, which focuses on enhancing municipal recycling infrastructure. Meanwhile, glass bottles are projected to grow at a 5.01% CAGR through 2031, as premium brands leverage glass's perceived purity and sustainability to justify retail prices 20% to 30% higher than aluminum equivalents.
PET bottles remain a key packaging format, particularly for multi-serve sizes in club stores and mass merchandisers, where consumers frequently purchase 4-packs and 6-packs for home consumption. Coca-Cola HBC sustained 100% recycled PET content throughout 2024 and implemented lightweighting programs, achieving a 15% reduction in plastic usage per bottle without compromising structural integrity. Formats such as aseptic packages, Tetra Pak cartons, and pouches cater to niche applications, including single-serve shots and kids' energy drinks. However, the latter category faces regulatory challenges as governments impose restrictions on caffeine access for minors. Disposable cups, commonly used in foodservice and quick-service restaurants, represent a smaller segment of the packaging market but are experiencing growth. This trend is supported by initiatives like Dunkin's expansion of energy-drink menus to capture afternoon consumer demand.
By Distribution Channel: Off-Trade Leads, On-Trade Rebounds
Off-trade channels, comprising supermarkets, hypermarkets, convenience stores, specialty stores, and online retail, accounted for 77.95% of the market share in 2025. However, on-trade venues, such as bars, restaurants, gyms, nightclubs, and entertainment complexes, are experiencing a resurgence, growing at a 5.88% CAGR through 2031. This growth is driven by the normalization of post-pandemic foot traffic and strategic initiatives by operators to bundle energy drinks with food, thereby increasing check averages. Convenience stores have seen a rise in energy-drink sales, but dollar sales have declined as suburban locations lose traffic to dollar stores, mass merchandisers, and club stores. Dollar stores are attracting inflation-conscious consumers who prioritize affordability over brand loyalty, while club stores appeal to households purchasing multi-packs for home consumption. Online retail is expanding rapidly, particularly in Canada, where e-commerce penetration for snacks and beverages grew between 2022 and 2024. This growth is supported by same-day delivery services and subscription models that encourage repeat purchases.
Supermarkets and hypermarkets remain the largest off-trade segment, offering an extensive assortment of brands, flavors, and pack sizes. However, private-label energy drinks are gaining traction as retailers like Walmart, Kroger, and Costco introduce house brands priced 30% to 40% lower than national equivalents. Specialty stores, including natural-food retailers and supplement shops, are targeting consumers seeking organic, Fair Trade, and nootropic-enhanced formulations, which command a premium over mainstream products. On-trade growth is concentrated in urban gyms and fitness centers, where energy drinks are positioned alongside protein shakes and pre-workout supplements. Quick-service restaurants are also capitalizing on this trend. For example, Dunkin' launched its 'Sparkd' Energy in February 2024 to compete with bottled alternatives during breakfast and afternoon dayparts. Bars and nightclubs, traditionally dominated by Red Bull and Jägermeister mixers, are diversifying their energy-drink offerings to include sugar-free and organic options. These alternatives cater to health-conscious patrons who avoid high-fructose corn syrup.
By Functionality: Endurance Dominates, Recovery Gains Traction
Endurance and energy-boost formulations accounted for 52.88% of the market share in 2025, driven by key ingredients such as caffeine, taurine, B vitamins, and guarana. These components deliver immediate alertness and sustained stamina, catering to the needs of shift workers, students, and athletes. The muscle-recovery segment is projected to grow at a CAGR of 5.12% through 2031, fueled by the inclusion of branched-chain amino acids (L-leucine, L-isoleucine, L-valine), electrolytes (sodium, potassium, magnesium), and protein isolates. These ingredients are designed to minimize exercise-induced muscle damage and accelerate glycogen replenishment, meeting the demands of fitness-conscious consumers.
Other functionalities, such as cognitive enhancement, immune support, and mood elevation, are gaining traction despite holding smaller market shares. Brands are increasingly integrating adaptogens (ashwagandha, rhodiola, ginseng) and nootropics (L-theanine, alpha-GPC, lion's mane) into their formulations, offering products that combine physical energy with mental clarity. A 2024 survey revealed that United States consumers are prioritizing sustained brain energy, reflecting a growing demand for solutions addressing both physical fatigue and cognitive fog. HIBO Energy, launched in 2024, exemplifies this trend by combining 140 milligrams of organic caffeine from cascara and green tea with chlorogenic acid and prebiotics, positioning itself at the intersection of energy, gut health, and mental performance. Similarly, Celsius Holdings markets its flagship line as a fitness drink that accelerates metabolism through a proprietary blend of green tea extract, guarana, ginger, and caffeine. The brand leverages endorsements from fitness influencers and CrossFit athletes, who amplify its performance-focused narrative on platforms like Instagram and TikTok. The muscle-recovery segment's 5.12% CAGR aligns with crossover demand from the United States sports-nutrition market, where consumers already purchase protein powders, pre-workout supplements, and amino-acid blends. Energy drinks are increasingly viewed as a convenient, ready-to-drink alternative, consolidating multiple functional benefits into a single SKU.
Geography Analysis
In 2025, the United States captured 91.73% of North America's energy-drink revenue, driven by premiumization trends as consumers increasingly opted for sugar-free and organic variants. Red Bull and Monster Beverage collectively accounted for just over half of United States dollar sales during the year, though their combined market share has declined from historical peaks. This shift reflects the growing influence of competitors like Celsius, Alani Nu, and private-label brands, which have expanded their presence in convenience stores, mass merchandisers, and dollar stores. Celsius Holdings reported an 84% year-over-year revenue growth in Q2 2025, fueled by its distribution partnership with PepsiCo and targeted social-media campaigns positioning the brand as a fitness-oriented alternative to traditional energy drinks. The United States market's maturity is evident in the diversification of retail channels. Dollar stores and mass merchandisers experienced growth, while traditional convenience stores saw a decline, signaling a consumer preference for price optimization and product variety over proximity. Additionally, nearly one-third of United States teens aged 12 to 17 regularly consume energy drinks, according to the NIH. This makes energy drinks the second most popular dietary supplement after multivitamins, prompting state-level debates on age restrictions and caffeine labeling. However, no federal legislation has been enacted as of 2025.
Canada's energy-drink market is projected to grow at a 5.78% CAGR through 2031, nearly double the continental average. Urban millennials in cities such as Toronto, Montreal, and Vancouver are driving this growth by prioritizing clean-label formulations over traditional high-sugar options. In Quebec, energy-drink consumption among residents aged 20 to 34 has risen, with increases in both daily and weekly usage. Among Quebec youth aged 15 to 24, a significant portion have tried energy drinks, with half consuming them multiple times per year. Upcoming regulatory changes from Health Canada, effective January 1, 2026, will introduce a 180-milligram caffeine cap and new labeling requirements for supplemented foods. These regulations may delay product launches due to the reformulation cycle, but they also create opportunities for brands that proactively adopt clean labels and functional ingredients. Meanwhile, e-commerce is reshaping the Canadian snack and beverage market. Growth in same-day delivery services and subscription models is driving repeat purchases, favoring digitally native brands like GURU and Yerbaé over legacy players reliant on brick-and-mortar distribution.
In Mexico, the energy drinks market is expanding, but regulatory challenges are constraining its growth potential. A nationwide ban on caffeinated beverages in schools was implemented on March 29, 2025. Additionally, legislation prohibiting sales to minors under 18 has been approved, with fines reaching MX 226,280 (approximately USD 13,300). These measures limit impulse purchases among adolescents, a key demographic for trial consumption. Furthermore, mandatory front-of-pack warning labels now require black octagonal seals on products exceeding thresholds for sugar, sodium, saturated fat, and calories. This has driven reformulation efforts toward non-nutritive sweeteners and contributed to a decline in sugar-sweetened beverage purchases, particularly in public markets and small stores. The rest of North America, comprising smaller markets and territories, contributes marginally to regional revenue. However, these areas present white-space opportunities for brands seeking first-mover advantages in less competitive geographies compared to the United States, Canada, and Mexico.
Competitive Landscape
The North America energy drinks market registers high consolidation, indicating that a handful of multinational corporations, PepsiCo, The Coca-Cola Company, Red Bull, Monster Beverage, and Keurig Dr Pepper, control the majority of distribution networks, promotional budgets, and shelf space in convenience stores, supermarkets, and mass merchandisers. Strategic consolidation has gained momentum in 2024-2025, with established players acquiring emerging brands to access Gen Z consumers and enhance functional expertise. For instance, Keurig Dr Pepper's USD 990 million acquisition of a 60% stake in Ghost Energy in October 2024, with an option to acquire the remainder by 2028, highlights the preference for expanding distribution reach through acquisitions rather than organic growth. Similarly, PepsiCo's September 2025 partnership with Celsius Holdings consolidated brands like Celsius, Alani Nu, and Rockstar under one umbrella, increasing its stake to 11% for USD 585 million. Additionally, Celsius's USD 75 million co-packer acquisition in November 2024 underscores the growing necessity for vertical integration, especially as contract manufacturers face challenges in meeting demand for sugar-free and organic variants. These developments underscore how market leaders leverage scale to accelerate growth, creating significant barriers for smaller, independent brands reliant on external funding.
Opportunities for differentiation lie in emerging niches such as cognitive enhancement, muscle recovery, and sustainable packaging, where demand is outpacing the ability of incumbents to innovate in a commoditized caffeine category. Nootropics, including L-theanine, alpha-GPC, and lion's mane, enable premium pricing by offering substantiated cognitive benefits, as demonstrated by Nutrition21's nooLVL, which is backed by peer-reviewed trials and avoids FDA drug-related concerns. Muscle-recovery blends featuring BCAAs and electrolytes are gaining traction, positioning energy drinks as ready-to-drink (RTD) alternatives to powders and pre-workout supplements, particularly among U.S. sports-nutrition consumers. Prime Hydration, driven by the influencer reach of Logan Paul and KSI, who collectively have 40 million YouTube subscribers, disrupted the market by securing Walmart exclusivity and becoming 2023's top hydration seller, briefly surpassing Gatorade. These trends highlight the potential for agile players to capitalize on functional layering and targeted retail strategies.
Private-label offerings at major retailers like Walmart, Kroger, and Costco are also reshaping the competitive landscape. Priced 30-40% lower than national brands, these products are attracting inflation-conscious shoppers and eroding brand loyalty across price tiers. This shift presents a challenge for consolidated portfolios that are slower to pivot beyond their core stimulant-based offerings. As the market evolves, companies that can swiftly adapt to consumer demands for multifunctional products and sustainable solutions are better positioned to capture growth in these emerging segments.
North America Energy Drinks Industry Leaders
-
Red Bull GmbH
-
Monster Beverage Corp.
-
PepsiCo, Inc.
-
The Coca-Cola Company
-
Celsius Holdings, Inc.
- *Disclaimer: Major Players sorted in no particular order

Recent Industry Developments
- October 2025: Grupo Jumex and AriZona Beverages expanded their partnership by introducing Jumex Energy, a new line of energy drinks. These beverages combine Jumex's fruit nectar blends with a performance-enhancing formulation. The product line featured lightly carbonated Mango and Strawberry flavors, each containing 150 mg of caffeine. Additionally, the drinks were enriched with vitamins C, B5, B6, B12, and a blend of taurine, guarana, and ginseng.
- July 2025: O'Neill Vintners & Distillers introduced Catalyst, an energy drink designed for health-conscious consumers. Catalyst offered 120 mg of caffeine, 10 calories, and contained no sugar, artificial sweeteners, colors, or flavors. Its advanced formula incorporates premium nootropics to improve focus and cognitive performance. Additionally, it included plant-based caffeine and vitamins B12 and B6, which supported metabolism and natural energy production.
- May 2025: Anheuser-Busch and 1st Phorm recently introduced their energy drink line, Phorm Energy, across the United States. The product line featured four distinct flavors: Screamin’ Freedom, Blue Blitz, Orange Fury, and Grape Smash. These drinks incorporated natural caffeine derived from green tea, electrolytes to support hydration, and a blend of ingredients formulated to enhance mental focus. Additionally, the beverages contained no sugar or artificial flavors.


North America Energy Drinks Market Report Scope
The North America Energy Drinks Market Report is Segmented by Soft Drink Type (Traditional, Sugar-Free or Low-Calorie, Natural/Organic, Energy Shots, Other), Packaging Type (PET Bottles, Glass Bottles, Metal Can, Aseptic Packages, Disposable Cups), Distribution Channel (On-Trade, Off-Trade), Functionality (Endurance/Energy Boost, Muscle Recovery, Others), and Geography (United States, Canada, Mexico, Rest of North America). Market Forecasts are Provided in Terms of Value (USD).
By Soft Drink Type
| Traditional Energy Drinks |
| Sugar-free or Low-calories Energy Drinks |
| Natural/Organic Energy Drinks |
| Energy Shots |
| Other Energy Drinks |
By Packaging Type
| PET Bottles |
| Glass Bottles |
| Metal Can |
| Aseptic Packages (tetra pak, cartons, pouches) |
| Disposable Cups |
By Distribution Channel
| On-Trade | |
| Off-Trade | Supermarket/Hypermarket |
| Convenience Stores | |
| Specialty Stores | |
| Online Retail | |
| Other Distribution Channels |
By Functionality
| Endurance/Energy Boost |
| Muscle Recovery |
| Others |
By Country
| United States |
| Canada |
| Mexico |
| Rest of North America |
| By Soft Drink Type | Traditional Energy Drinks | |
| Sugar-free or Low-calories Energy Drinks | ||
| Natural/Organic Energy Drinks | ||
| Energy Shots | ||
| Other Energy Drinks | ||
| By Packaging Type | PET Bottles | |
| Glass Bottles | ||
| Metal Can | ||
| Aseptic Packages (tetra pak, cartons, pouches) | ||
| Disposable Cups | ||
| By Distribution Channel | On-Trade | |
| Off-Trade | Supermarket/Hypermarket | |
| Convenience Stores | ||
| Specialty Stores | ||
| Online Retail | ||
| Other Distribution Channels | ||
| By Functionality | Endurance/Energy Boost | |
| Muscle Recovery | ||
| Others | ||
| By Country | United States | |
| Canada | ||
| Mexico | ||
| Rest of North America | ||


Market Definition
- Carbonated Soft Drinks (CSDs) - Carbonated soft drinks (CSDs) refer to non-alcoholic beverages that are carbonated and typically flavored, containing dissolved carbon dioxide to create effervescence. These beverages commonly include cola, lemon-lime, orange, and various fruit-flavored sodas. Marketed in cans, bottles, or fountain dispense.
- Juices - We have considered packaged juices which encompass non-alcoholic beverages derived from fruits, vegetables, or a combination thereof, processed and sealed in various packaging formats such as bottles, cartons, or pouches. Excluding fresh juices, this market segment involves commercially prepared and preserved juices, often with added preservatives and flavors.
- Ready-to-Drink (RTD) Tea and RTD Coffee - Ready-to-Drink (RTD) tea and RTD coffee are pre-packaged, non-alcoholic beverages that are brewed and prepared for consumption without further dilution. RTD tea typically includes various tea varieties, infused with flavors and sweeteners, and comes in bottles, cans, or cartons. Similarly, RTD coffee involves pre-brewed coffee formulations, often mixed with milk, sugar, or flavorings, and is conveniently packaged for on-the-go consumption.
- Energy Drinks - Energy drinks are non-alcoholic beverages formulated to provide a quick boost of energy and alertness. Whereas, sports drinks are beverages designed to hydrate and replenish electrolytes, particularly after physical exertion, exercise, or intense activity
| Keyword | Definition |
|---|---|
| Carbonated Soft Drinks | Carbonated soft drinks (CSDs) are a combination of carbonated water and flavouring, sweetened by sugar or a non-sugar sweeteners. |
| Standard Cola | Standard Cola is defined as the original flavor of cola soda. |
| Diet Cola | A cola-based soft drink containing no or low amounts of sugar |
| Fruit Flavored Carbonates | A carbonated beverage prepared from fruit juice/fruit flavor with carbonated water and containing sugar, dextrose, invert sugar or liquid glucose either singly or in combination. It may contain peel oil and fruit essences. |
| Juice | Juice is a drink made from the extraction or pressing of the natural liquid contained in fruit and vegetables. |
| 100% Juice | Fruit/vegetable juice made from fruit in the form of its juice with no water added to make up the volume. It is not permitted to add sugars, sweeteners, preservatives, flavourings or colourings to fruit juice. |
| Juice Drinks (up to 24% Juice) | Fruit/vegetable juice drinks with up to 24% fruits/vegetable extract. |
| Nectars (25-99% Juice) | Juices that can have between 25 and 99% of fruit, with the minimum legal limits defined depending on the type of fruit |
| Juice concentrates | Juice Concentrates are those form of juices when most of this liquid is removed resulting in a thick, syrupy product known as juice concentrate. |
| RTD Coffee | Packaged coffee beverages that are sold in a prepared form and are ready for consumption at the time of purchase. |
| Iced Coffee | An iced coffee is a cold version of coffee, usually a combination of hot espresso and milk with ice added to it. |
| Cold Brew Coffee | Cold brew also called cold water extraction or cold pressing is made by steeping ground coffee in room-temperature water for several hours. |
| RTD Tea | Ready-to-drink (RTD) tea is a packaged tea product ready for immediate consumption without brewing or preparation |
| Iced Tea | Ice tea or iced tea is a drink made from tea without milk but with sugar and sometimes fruit flavourings, drunk cold. |
| Green Tea | Green tea is a tea beverage which promotes mental alertness, relieving digestive symptoms and promoting weight loss. |
| Herbal Tea | Herbal tea beverages are made from the infusion or decoction of herbs, spices, or other plant material in hot water. |
| Energy Drink | A type of drink containing stimulant compounds, usually caffeine, which is marketed as providing mental and physical stimulation. They may or may not be carbonated and may also contain sugar, other sweeteners, or herbal extracts, among numerous possible ingredients. |
| Sugar-free or Low-calories Energy Drinks | Sugar-free or Low-calories Energy Drinks are sugar-free, artificially sweetened energy drinks with few or no calories. |
| Traditional Energy Drink | Traditional Energy Drinks are functional soft drinks containing ingredients designed to boost the consumer's energy. |
| Natural/Oraganic Energy Drinks | Natural/Organic energy drinks are energy drinks free of artificial sweeteners and synthetic colorings. Instead, they contain naturally derived ingredients such as green tea, yerba mate, and botanical extracts. |
| Energy Shots | A small but highly concentrated energy drink that contains large amounts of caffeine and/or other stimulants. The quantity is comparatively smaller compared to energy drinks. |
| Sports Drink | Sports drinks are beverages designed specifically for the rapid supply of fluid, carbohydrates, and electrolytes before, during or after exercise. |
| Isotonic | Isotonic drinks contain similar concentrations of salt and sugar as in the human body, and are designed to quickly replace fluids lost during exercise but with an increase of carbohydrate. |
| Hypertonic | Hypertonic drinks have a higher concentration of salt and sugar than the human body. They are best drunk after exercise as it is important to replace glycogen levels quickly after exercise. |
| Hypotonic | Hypotonic drinks are designed to quickly replace fluids lost during exercise. They have very low carbohydrate content and a lower concentration of salt and sugar than the human body. |
| Electrolyte-Enhanced Water | Electrolyte water is water infused with electrically-charged minerals, such as sodium, potassium, calcium, and magnesium. |
| Protein-based Sport Drinks | Protein-based sports drinks are those sports drinks which has added protein in it that will improve performance and reduce muscle protein breakdown. |
| On-Trade | The on-trade refers to places that sell beverages for immediate consumption on the premises like bars, restaurants, and pubs |
| Off-Trade | Off-trade usually means places like liquor stores, supermarkets and other places where you don't consume the beverage right away. |
| Convenience Store | A retail business that provides the public with a convenient location to quickly purchase a wide variety of consumable products and services, generally food and gasoline. |
| Specialty store | A specialty store is a shop/store that carries a deep assortment of brands, styles, or models within a relatively narrow category of goods |
| Online Retail | Online retail is a type of eCommerce whereby a business sells goods or services directly to consumers from a website. |
| Aseptic Packaging | Aseptic packaging refers to the filling of a cold, commercially sterile product under sterile conditions into a presterilized container and closure under sterile conditions to form a seal that effectively excludes microorganisms. These includes tetra packs, cartons, pouches etc. |
| PET Bottle | PET bottle means a bottle made of polyethylene terephthalate. |
| Metal Cans | Metal containers made of aluminum or tin- plated or zinc-plated steel, which are commonly used for packaging food, beverages or other products. |
| Disposable Cups | Disposable Cup means a cup or other container designed for single use to serve beverages, such as water, cold drinks, hot drinks and alcoholic beverages. |
| Gen Z | A way of referring to the group of people who were born in the late 1990s and early 2000s. |
| Millenial | Anyone born between 1981 and 1996 (ages 23 to 38 in 2019) is considered a Millennial |
| Taurine | Taurine is an amino acid that supports immune health and nervous system function. |
| Bars & Pubs | It is a drinking establishment licensed to serve alcoholic drinks for consumption on the premises. |
| Café | It is a foodservice establishment serving refreshments (mainly coffee) and light meals. |
| On the go | It means doing / dealing with while busily engaged with something and not diverting plans in order to accommodate. |
| Internet Penetration | The Internet Penetration Rate corresponds to the percentage of the total population of a given country or region that uses the Internet. |
| Vending Machine | A machine that dispenses small articles such as food, drinks, or cigarettes when a coin or token is inserted |
| Discount store | A discount store or discounter offers a retail format in which products are sold at prices that are in principle lower than an actual or supposed "full retail price". Discounters rely on bulk purchasing and efficient distribution to keep down costs. |
| Clean Label | Clean label on the beverage market are drinks that are made from few ingredients of natural origin and are not or only slightly processed. |
| Caffeine | An alkaloid compound which is a stimulant of the central nervous system. It is mainly used recreationally, as a mild cognitive enhancer to increase alertness and attentional performance. |
| Extreme sport | Action sports, adventure sports or extreme sports are activities perceived as involving a high degree of risk. |
| High-intensity interval training | It incorporates several rounds that alternate between several minutes of high intensity movements to significantly increase the heart rate to at least 80% of one's maximum heart rate, followed by short periods of lower intensity movements. |
| Shelf life | The length of time for which an item remains usable, fit for consumption, or saleable. |
| Cream Soda | Cream soda is a sweet soft drink. Generally flavored with vanilla and based on the taste of an ice cream float |
| Root Beer | Root beer is a sweet North American soft drink traditionally made using the root bark of the sassafras tree Sassafras albidum or the vine of Smilax ornata as the primary flavor. Root beer is typically, but not exclusively, non-alcoholic, caffeine-free, sweet, and carbonated. |
| Vanilla Soda | A carbonated soft drink flavoured with vanilla. |
| Dairy-Free | A product that does not contain any milk or milk products from cows, sheep or goats. |
| Caffeine-Free Energy Drinks | Caffeine-free energy drinks rely on other ingredients to boost the energy. Popular choices include amino acids, B vitamins, and electrolytes. |


Research Methodology
Mordor Intelligence follows a four-step methodology in all our reports.
- Step-1: IDENTIFY KEY VARIABLES: In order to build a robust forecasting methodology, the variables and factors identified in Step 1 are tested against available historical market numbers. Through an iterative process, the variables required for market forecast are set, and the model is built on the basis of these variables.
- Step-2: Build a Market Model: Market-size estimations for the forecast years are in nominal terms. Inflation is not a part of the pricing, and the average selling price (ASP) is kept constant throughout the forecast period for each country.
- Step-3: Validate and Finalize: In this important step, all market numbers, variables, and analyst calls are validated through an extensive network of primary research experts from the market studied. The respondents are selected across levels and functions to generate a holistic picture of the market studied.
- Step-4: Research Outputs: Syndicated reports, custom consulting assignments, databases & subscription platforms


