Market Overview
| Study Period | 2020 - 2031 |
|---|---|
| Forecast Data Period | 2026 - 2031 |
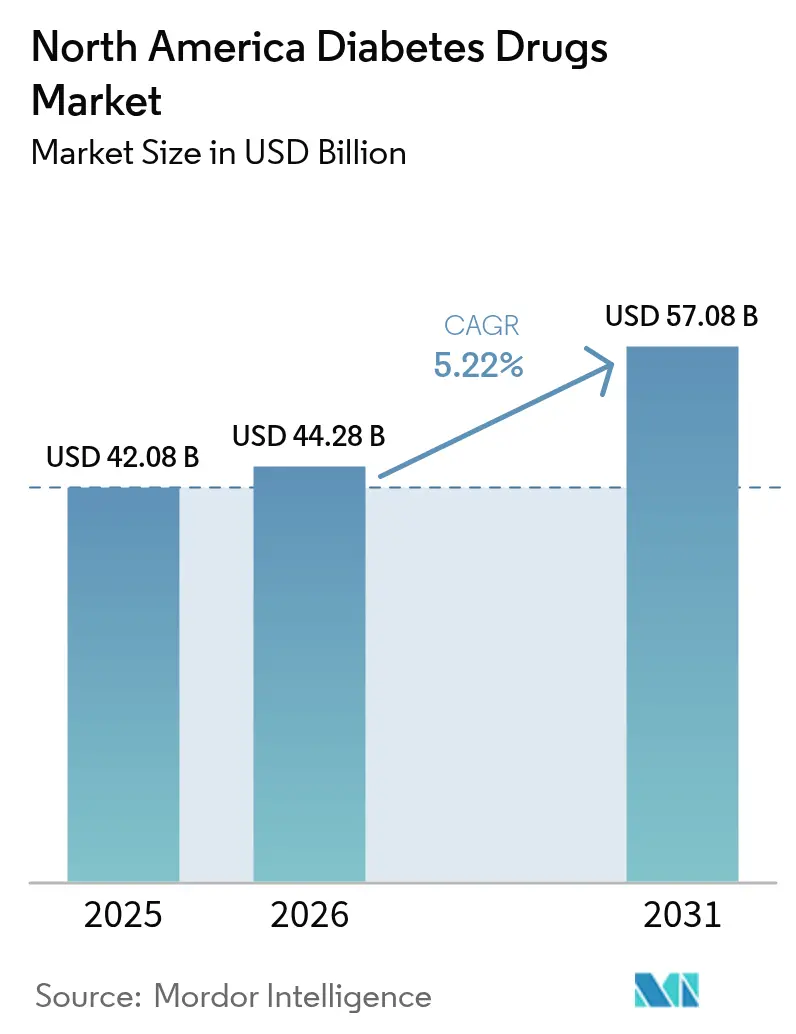
| Base Year Market Size (2025) | USD 42.08 Billion |
| Market Size (2026) | USD 44.28 Billion |
| Market Size (2031) | USD 57.08 Billion |
| Growth Rate (2026 - 2031) | 5.22% CAGR |
| Market Concentration | High |
Major Players *Disclaimer: Major Players sorted in no particular order Image © Mordor Intelligence. Reuse requires attribution under CC BY 4.0. | |
North America Diabetes Drugs Market Analysis by Mordor Intelligence
The North America diabetes drugs market size was valued at USD 42.08 billion in 2025 and estimated to grow from USD 44.28 billion in 2026 to reach USD 57.08 billion by 2031, at a CAGR of 5.22% during the forecast period (2026-2031). A growing convergence of diabetes and obesity treatment, coupled with rapid uptake of next-generation GLP-1 receptor agonists, is providing much of the forward momentum. U.S. prescription drug spending climbed 10.2% in 2024, and GLP-1s already rank as the largest and fastest-growing therapeutic spend category.[1]American Society of Health-System Pharmacists, “U.S. Drug Spending Up 10.2% in 2024, With Weight Loss Drugs Remaining Top Driver,” ashp.orgOral anti-diabetics continue to control the majority of therapy volumes even as injectable innovation accelerates, and biosimilar insulin introductions are compressing prices in key segments. Tight Medicare negotiations, state price-cap statutes, and payer prior-authorization rules are reshaping formulary choices, yet therapeutic innovations keep total spending on an upward trajectory. Mexico’s emergence as a manufacturing hub and the expansion of online pharmacies are also altering competitive economics and patient access across the region.
Key Report Takeaways
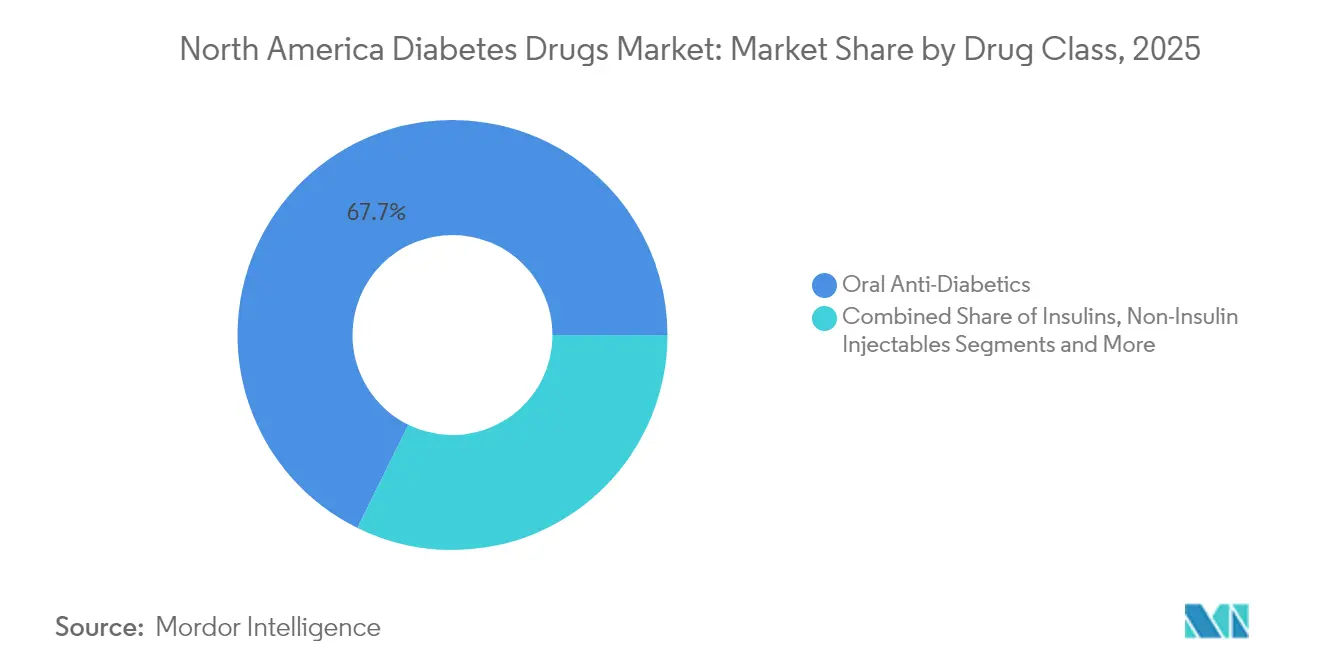
- By drug class, oral anti-diabetics led with 67.72% revenue share in 2025; non-insulin injectables are projected to deliver the highest 7.21% CAGR to 2031.
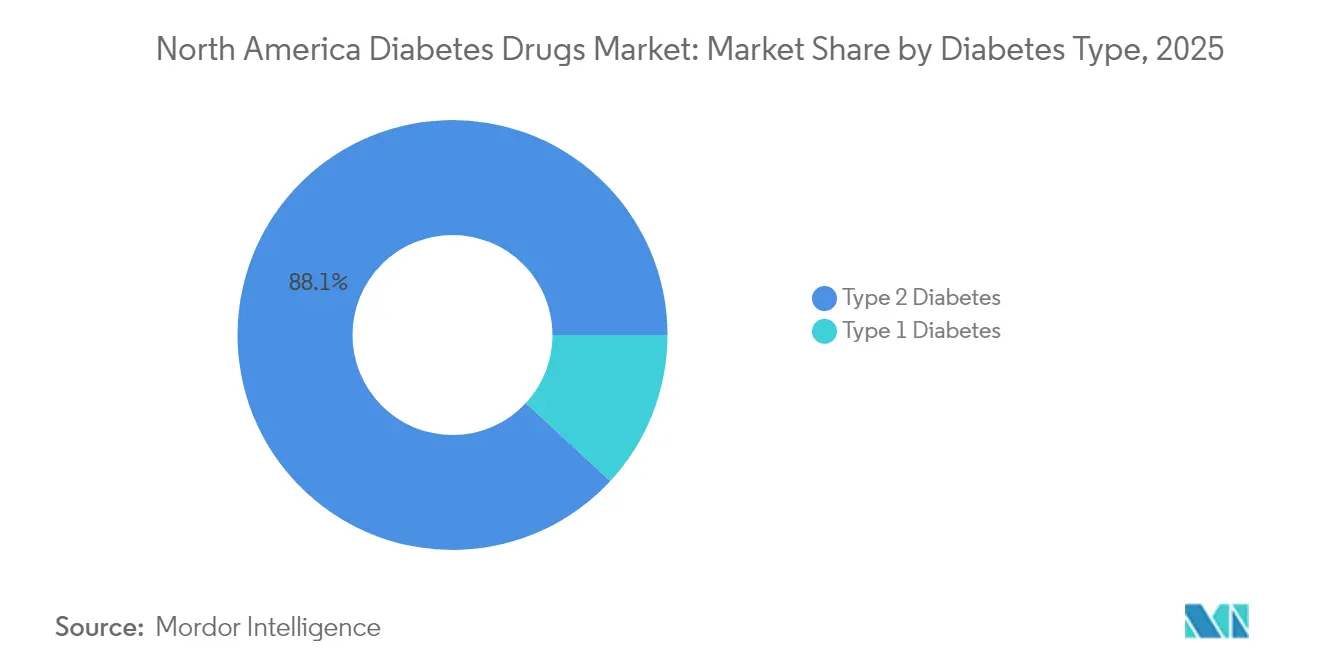
- By diabetes type, Type 2 therapies represented 88.12% of treatment volumes in 2025, while Type 1 drugs are expected to advance at a faster 6.11% CAGR through 2031.
- By drug origin, branded products controlled 78.84% of the North America diabetes drugs market share in 2025, yet generics and biosimilars are on track for a 8.63% CAGR.
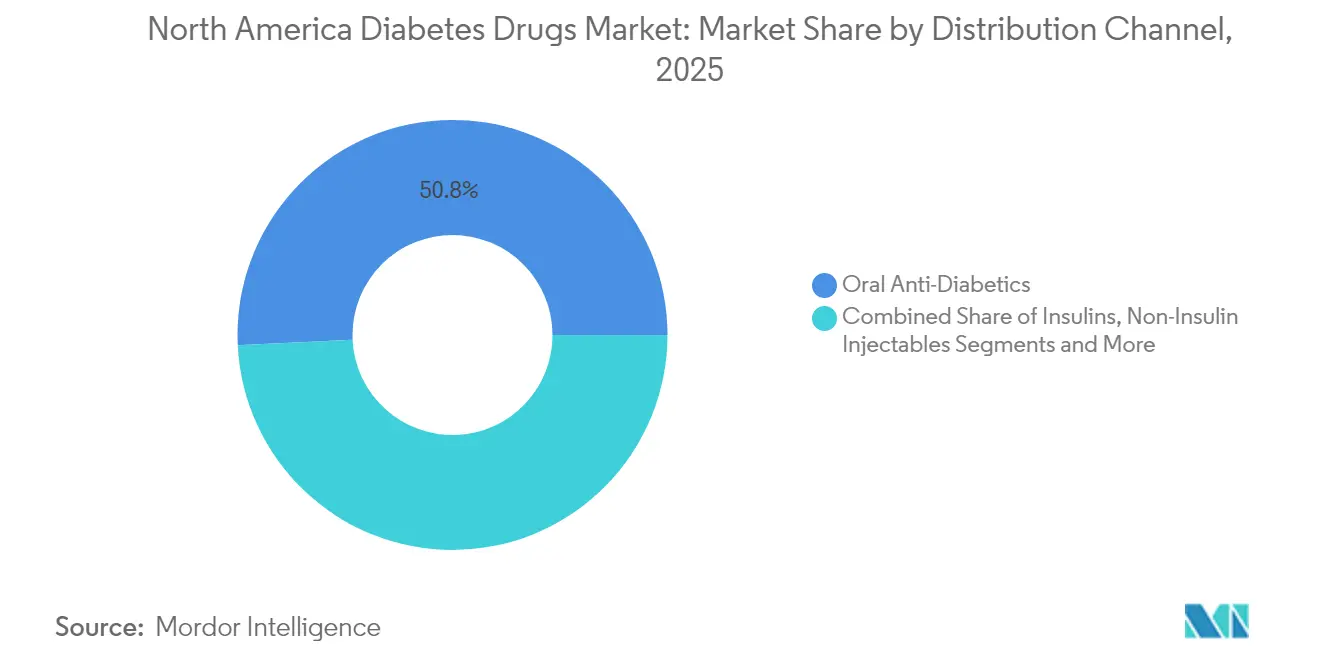
- By distribution channel, retail pharmacies held 50.76% of revenues in 2025; online pharmacies are growing the quickest at an 8.41% CAGR.
- By geography, the United States accounted for 89.02% of the North America diabetes drugs market size in 2025, whereas Mexico is set to expand at a 6.18% CAGR to 2031.
Note: Market size and forecast figures in this report are generated using Mordor Intelligence’s proprietary estimation framework, updated with the latest available data and insights as of 2026.
Market Trends and Insights
Drivers Impact Analysis of North America Diabetes Drugs Market*
| Driver | (~) % Impact on CAGR Forecast | Geographic Relevance | Impact Timeline |
|---|---|---|---|
| Increasing adoption of GLP-1 agonists in obese T2DM | +1.2% | United States & Canada, spillover to Mexico | Medium term (2-4 years) |
| Reimbursement expansion for dual & triple incretins | +0.8% | United States primarily, Canada selective coverage | Short term (≤ 2 years) |
| Biosimilar insulin price wars accelerate uptake | +0.6% | North America-wide, strongest in US | Long term (≥ 4 years) |
| CGM-linked dosing algorithms spur drug adherence | +0.4% | United States & Canada, limited Mexico penetration | Medium term (2-4 years) |
| Employer obesity-diabetes bundled contracts | +0.3% | United States corporate markets | Short term (≤ 2 years) |
| US–Mexico near-shoring of pen-fill finish lines | +0.2% | US-Mexico border regions | Long term (≥ 4 years) |
| Source: Mordor Intelligence | |||
Increasing adoption of GLP-1 agonists in obese T2DM
GLP-1 receptor agonists unify obesity and diabetes management, a nexus relevant to more than 88% of people with Type 2 diabetes. Tirzepatide reached roughly 12% prescription share of glucose-lowering drugs by end-2023, and its popularity among non-diabetic weight-management users underscores the therapeutic blur between metabolic indications.[2]Jaime Almandoz MD et al., “Discussing Tirzepatide’s Rise in Diabetes, Obesity Care,” ajmc.com Dual GLP-1/GIP activity delivers greater body-weight and HbA1c reductions than single-target drugs, while emerging triple-agonists such as retatrutide have posted 24% weight loss at 48 weeks, setting new clinical benchmarks. Fast-tracked FDA approvals for wider cardiometabolic indications are expanding reimbursement horizons and encouraging prescribers to adopt these therapies earlier in care pathways.
Reimbursement expansion for dual & triple incretins
Payers are recalibrating formularies to recognize the cardiovascular and renal benefits of dual and triple incretins. Medicare’s price negotiations apply greater pressure on legacy oral agents, while newer GLP-1s gain Tier-preferred coverage, thus lowering out-of-pocket costs for seniors.[3]Medicare Rights Center, “Administration Provides More Data on First 10 Drugs Subject to Price Negotiation,” medicarerights.orgCommercial insurers now classify obesity as a medical condition, unlocking pharmacotherapy budgets previously reserved for diabetes. Employer health plans are bundling obesity and diabetes care contracts tied to outcome metrics, reinforcing utilization growth.
Biosimilar insulin price wars accelerate uptake
Since the USD 35 insulin copay cap took effect, biosimilar manufacturers have accelerated market entries and discounting strategies, spurring wider patient adoption and forcing innovators to adjust list prices. Teva’s capacity expansions under federal purchasing agreements illustrate the corporate commitment to compete on volume. Intensifying price competition is broadening insulin access and enlarging overall therapy volumes.
CGM-linked dosing algorithms spur drug adherence
Integrating semaglutide with real-time continuous glucose monitoring (CGM) has produced an additional 0.55 percentage-point HbA1c reduction versus drug therapy alone. Newer CGM algorithms, though occasionally understating hypoglycemia risk, improve titration accuracy and bolster adherence. Over-the-counter CGM devices now receiving FDA clearance promise to widen technology adoption and reinforce medication persistence.
Restraints Impact Analysis of North America Diabetes Drugs Market*
| Restraint | (~) % Impact on CAGR Forecast | Geographic Relevance | Impact Timeline |
|---|---|---|---|
| Payer prior-authorization throttles GLP-1 volumes | −0.9% | United States primarily, limited Canada impact | Short term (≤ 2 years) |
| API tariff risk from China supply concentration | −0.5% | North America-wide | Medium term (2-4 years) |
| Litigation over pancreatitis & thyroid C-cell tumors | −0.3% | United States jurisdiction | Long term (≥ 4 years) |
| Rising state drug price-cap legislation | −0.4% | United States state-level variations | Medium term (2-4 years) |
| Source: Mordor Intelligence | |||
Payer prior-authorization throttles GLP-1 volumes
US payers continue to impose multi-step therapy rules that delay or deny GLP-1 initiation despite favorable clinical profiles, leading to patient drop-out and slower overall market penetration. Medicare Advantage plans remain especially cautious in approving weight-management uses, preserving utilization caps that curb early growth.
API tariff risk from China supply concentration
Roughly two-thirds of global active pharmaceutical ingredient output for diabetes therapies still originates in China. Any re-imposition of punitive tariffs could elevate input costs and disrupt downstream supply, pressuring North America diabetes drugs market margins until alternative sourcing scales.
*Our forecasts treat driver/restraint impacts as directional, not additive. The impact forecasts reflect baseline growth, mix effects, and variable interactions.
North America Diabetes Drugs Market Segment Analysis
By Drug Class:
Oral dominance defies injectable innovationOral agents secured 67.72% of the North America diabetes drugs market in 2025 and are projected to expand at 4.87% CAGR through 2031, sustaining leadership despite injectable breakthroughs. SGLT-2 inhibitors such as canagliflozin continue to gain based on cardio-renal outcome data and Health Canada labeling updates.
Non-insulin injectables are climbing rapidly on the back of GLP-1, dual GIP/GLP-1, and emerging triple-agonist classes. Triple-mechanism drugs are positioned as premium therapies offering weight, cardiovascular, and renal benefits, thereby lifting value per prescription within the North America diabetes drugs market. Alpha-glucosidase inhibitors retain a niche among geriatric cohorts, and combination pills that merge multiple mechanisms aim to simplify dosing and boost adherence.


By Diabetes Type:
Type 1 innovation accelerates growthTherapies for Type 2 diabetes continue to dominate revenue, yet Type 1 options are showing the strongest incremental gains. Integration of weekly semaglutide with automated insulin delivery lifted time-in-range metrics from 69.4% to 74.2%, a meaningful clinical advance. The resulting enthusiasm is expanding the North America diabetes drugs market size for Type 1 adjuncts. Gene-therapy programs aimed at beta-cell regeneration are still pre-commercial but underscore the pipeline depth.
By Drug Origin:
Biosimilar momentum challenges brand dominanceBranded medications still account for 78.84% of the North America diabetes drugs market share, but the trajectory favors biosimilars. The USD 35 insulin copay cap erodes traditional branding advantages, allowing follow-on manufacturers to compete primarily on availability and service. Federal contract wins and streamlined FDA interchangeability guidelines should accelerate penetration of biosimilar insulin glargine, lispro, and aspart across retail and specialty channels.
By Distribution Channel:
Digital transformation acceleratesRetail pharmacies retained 50.76% share in 2025, yet online channels are scaling at 8.41% CAGR as patients gravitate to subscription refills and home delivery. PBM-owned mail facilities direct a disproportionate volume of high-cost GLP-1 scripts, partially offset by “any willing pharmacy” rules that broaden independent pharmacy participation. The rise of telehealth-linked e-pharmacies is expected to reinforce competition on convenience and copay assistance rather than on sheer geographic presence.
Geography Analysis
United States Diabetes Drugs Market
The United States generated 89.02% of North America diabetes drugs market revenues in 2025, driven by high per-capita healthcare spend and broad insurance coverage. Federal drug-price negotiations could deliver USD 98.5 billion in savings over a decade, with legacy diabetes brands among the first 10 products slated for price ceilings. State price-cap laws introduce patchwork compliance burdens but may spur regional competitive discounts.
Canada Diabetes Drugs Market
Canada’s market is steered by provincial formularies and rigorous health-technology assessments. While dual-agonist GLP-1s are receiving incremental coverage, uptake varies by province, leaving room for branded manufacturers to demonstrate cost-effectiveness through outcomes evidence. Generic adoption remains comparatively high in Ontario and Québec, reinforcing pressure on innovators.
Mexico Diabetes Drugs Market
Mexico is the fastest-growing territory, clocking a forecast 6.18% CAGR through 2031. Expansion of COFEPRIS fast-track approvals and US–Mexico near-shoring of injectable-pen assembly lines are fortifying supply chains, lowering prices, and enhancing local availability. As manufacturing employment grows near border clusters, domestic insurance penetration is widening, further enlarging the addressable population for modern antidiabetic therapies.
Competitive Landscape
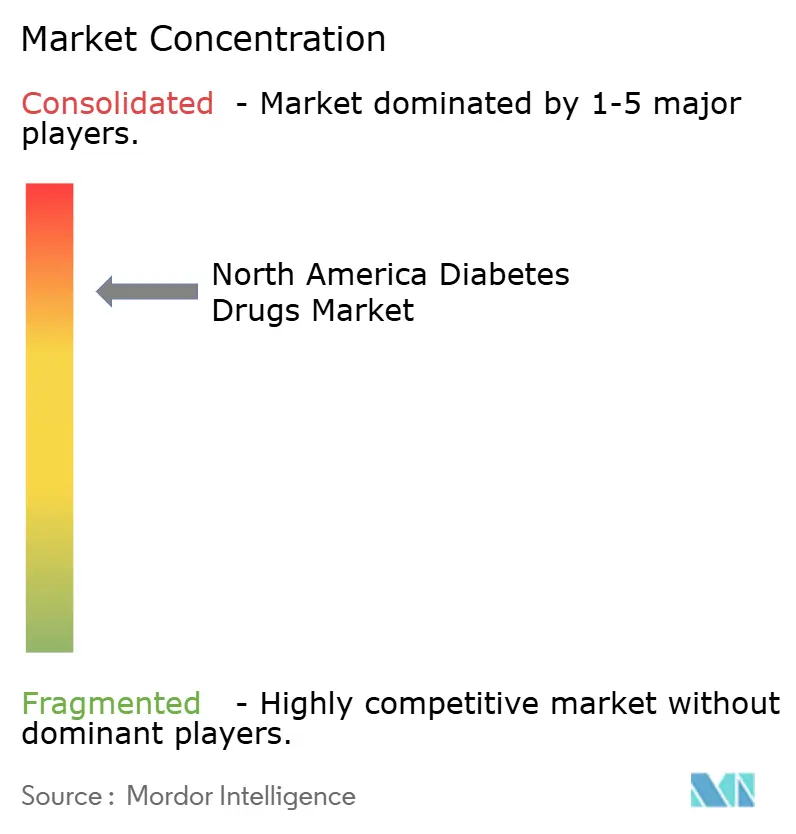
North America’s diabetes arena is moderately concentrated, characterized by a handful of multinational incumbents with broad GLP-1, SGLT-2, and insulin portfolios. Innovators are hedging against biosimilar erosion by pursuing multi-indication data in obesity, heart failure, and chronic kidney disease—strategies that extend exclusivity periods and bolster brand equity. Lilly, Novo Nordisk, and AstraZeneca have each announced eight-figure investments to scale triple-agonist production lines and companion digital-health platforms.
Biosimilar entrants such as Viatris and Teva are leveraging aggressive contracting and expanded fill-finish capacity to challenge share in basal and rapid-acting insulin segments. Simultaneously, digital-first pharmacies like Hims & Hers and Ro are partnering with manufacturers to distribute GLP-1 starter kits bundled with remote monitoring, expanding their footprint in the North America diabetes drugs market.
Strategic licensing between device companies and pharma—exemplified by continuous glucose monitoring data integrations—signals a tightening link between therapeutics and digital diagnostics. Over the medium term, companies capable of offering therapy-device bundles tied to measurable outcomes are positioned to capture premium reimbursement tiers.
North America Diabetes Drugs Industry Leaders
Novo Nordisk
Sanofi
Eli Lilly
Merck
AstraZeneca plc
- *Disclaimer: Major Players sorted in no particular order
North America Diabetes Drugs Market Companies Covered in this Report
- Novo Nordisk
- Eli Lilly and Company
- Sanofi
- AstraZeneca
- Merck
- Boehringer Ingelheim
- Bristol-Myers Squibb
- Pfizer
- Johnson & Johnson
- Takeda Pharmaceuticals
- Teva Pharmaceutical Industries
- Astellas Pharma
- GlaxoSmithKline
- Amgen
- Viatris
- MannKind
- Adocia SA
- Innovent Biologics
- Sun Pharmaceuticals Industries

Recent Industry Developments in North America Diabetes Drugs Market
- February 2025: U.S. FDA cleared Merilog (insulin-aspart-szjj) as a biosimilar to Novolog for pediatric and adult diabetes therapy.
- December 2024: U.S. FDA approved the first generic referencing Victoza (liraglutide injection) 18 mg/3 mL.
- June 2024: AstraZeneca’s Farxiga gained FDA approval for glycemic control in pediatric T2DM patients aged 10 years and older.
- February 2024: Canada introduced Bill C-64 toward universal, single-payer coverage of selected diabetes medicines.


North America Diabetes Drugs Market Report Scope and Research Methodology
Market Definition and Coverage
Our study defines the North America diabetes drugs market as all prescription-grade pharmacologic agents used to treat Type 1 or Type 2 diabetes, including branded and biosimilar insulins, non-insulin injectables (GLP-1, dual or triple incretins, amylin analogues), and oral anti-diabetics such as biguanides, SGLT-2, DPP-4, sulfonylureas, meglitinides, and thiazolidinediones. Value is captured at ex-manufacturer prices before wholesaler or retail mark-ups.
Scope exclusion: devices for blood-glucose monitoring or insulin delivery and nutraceuticals are outside this drug-focused boundary.
Segments Covered in This Report
- By Drug Class
- Insulins
- Basal / Long-acting
- Bolus / Fast-acting
- Traditional Human Insulin
- Biosimilar Insulin
- Non-Insulin Injectables
- GLP-1 Receptor Agonists
- Dual / Triple Agonists (e.g., Tirzepatide, Retatrutide)
- Amylin Analogues
- Oral Anti-Diabetics
- Biguanides
- SGLT-2 Inhibitors
- DPP-4 Inhibitors
- Alpha-Glucosidase Inhibitors
- Sulfonylureas
- Meglitinides
- Thiazolidinediones
- Combination Drugs
- Insulins
- By Diabetes Type
- Type 1 Diabetes
- Type 2 Diabetes
- By Drug Origin
- Branded
- Generic / Biosimilar
- By Distribution Channel
- Hospital Pharmacies
- Retail Pharmacies
- Online Pharmacies
- By Geography
- United States
- Canada
- Mexico
Data Sources, Market Sizing, and Validation
Primary Research
Mordor analysts interviewed endocrinologists, hospital pharmacists, large PBM officers, and regional wholesalers across the United States, Canada, and Mexico. The conversations tested desk-based cost curves, GLP-1 uptake assumptions, and generic insulin discount ranges, while short online surveys with adult patients clarified co-pay elasticity and therapy adherence.
Desk Research
We start with authoritative public datasets, CDC diabetes surveillance, IDF Diabetes Atlas, OECD Health Statistics, FDA Orange Book approvals, and US Customs import codes, which give prevalence, treatment penetration, and shipment flows. Additional context comes from peer-reviewed journals such as Diabetes Care, quarterly 10-K filings, investor decks, American Diabetes Association briefs, and price audit summaries. Where needed, analysts drew on two of Mordor's paid resources, D&B Hoovers for revenue splits and Dow Jones Factiva for real-time news screening. These examples illustrate typical inputs; many further sources supported validation.
Second-pass desk work benchmarks channel prices, formulary shifts, reimbursement rules, and patent cliffs, creating a live factsheet that is shared internally before any modelling begins.
Market-Sizing & Forecasting
A top-down and bottom-up blended model anchors 2024 demand by multiplying diagnosed diabetic population with treated-patient share, average daily dose, and annualized selling price; production and trade data reconstruct parallel supply. We then corroborate totals with selective bottom-up checks, aggregating reported North American revenues of the ten largest manufacturers and sampled ASP × unit volumes from IMS channel audits. Key drivers locked into the multivariate regression forecast include obesity prevalence, GLP-1 prescription growth, biosimilar insulin penetration, payer reimbursement policies, and median therapy cost inflation. Scenario cushions address gaps where hospital or mail-order volumes are opaque.
Data Validation & Update Cycle
Multi-angle triangulation, variance screens, and senior analyst peer reviews precede sign-off. We refresh every twelve months, triggering interim reviews if guideline changes, blockbuster launches, or policy shocks shift the market, and each report is rechecked just before release so clients receive the most current baseline.
How Mordor Intelligence's North America Diabetes Drugs Market Size Compares to Other Published Estimates
Published figures often diverge because firms pick dissimilar geographic splits, drug baskets, or currency bases, and some extrapolate aggressive GLP-1 curves while others freeze prices.
Scope breadth, forecast cadence, and untested assumptions explain most gaps.
Benchmark comparison
| Market Size | Anonymized source | Primary gap driver |
|---|---|---|
| USD 42.08 B (2025) | Mordor Intelligence | |
| USD 44.12 B (2024) | Global Consultancy A | Includes hospital mark-ups and OTC adjuncts, no GLP-1 coupon adjustment |
| USD 37.90 B (2024) | Industry Association B | Uses manufacturer net revenues only, excludes Mexico, applies constant 2023 FX rates |
| USD 29.70 B (2024) | Regional Consultancy C | Limits scope to insulin and SGLT-2, omits injectables other than insulin |
The comparison shows that once definitions, geographic breadth, and price bases align, Mordor's balanced approach, grounded in clear variables, routinely refreshed inputs, and transparent cross-checks, delivers a dependable reference point for strategic decision-makers.


Key Questions Answered in the Report
How big is the North America Diabetes Drugs Market?
The North America Diabetes Drugs Market size is expected to reach USD 44.28 billion in 2026 and grow at a CAGR of 5.22% to reach USD 57.08 billion by 2031.
What is the current size of the North America diabetes drugs market?
The market generated USD 44.28 billion in 2026 and is projected to climb to USD 57.08 billion by 2031 at a 5.22% CAGR.
Which drug class leads the market today?
Oral anti-diabetics hold 67.72% of sales, supported by familiar dosing and lower costs despite rapid growth in GLP-1 injectables
How fast are biosimilars growing in the region?
Generics and biosimilars are forecast to post a 8.63% CAGR through 2031 as patent expirations and Medicare price caps shift demand.
Why are GLP-1 receptor agonists gaining so much traction?
They deliver simultaneous glycemic, weight-loss, cardiovascular, and renal benefits, broadening eligible patient pools beyond traditional diabetes management.
Which country shows the fastest demand growth?
Mexico is on pace for a 6.18% CAGR, buoyed by new manufacturing plants, streamlined COFEPRIS reviews, and improving insurance coverage.
How will Medicare price negotiations affect market dynamics?
Price ceilings on older brands should free payer budgets for newer dual and triple incretins, accelerating transition to advanced therapies while trimming overall system costs.
Page last updated on:


