South America Data Center Construction Market Size and Share
Market Overview
| Study Period | 2020 - 2031 |
|---|---|
| Forecast Data Period | 2026 - 2031 |
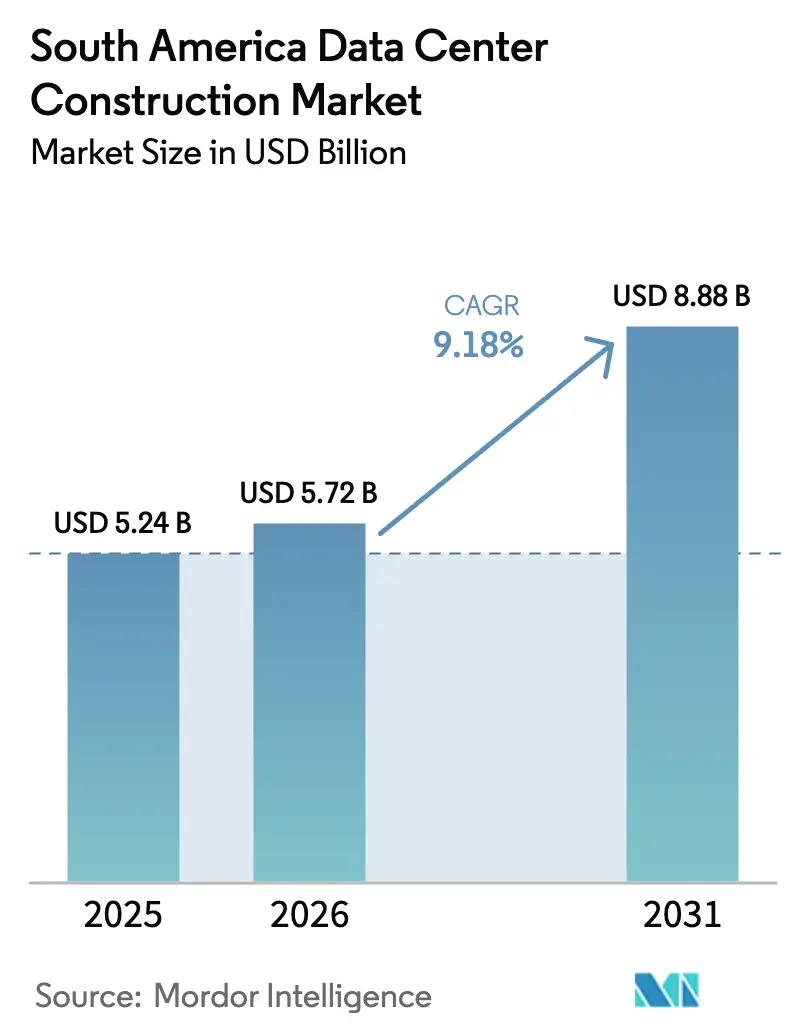
| Base Year Market Size (2025) | USD 5.24 Billion |
| Market Size (2026) | USD 5.72 Billion |
| Market Size (2031) | USD 8.88 Billion |
| Growth Rate (2026 - 2031) | 9.18% CAGR |
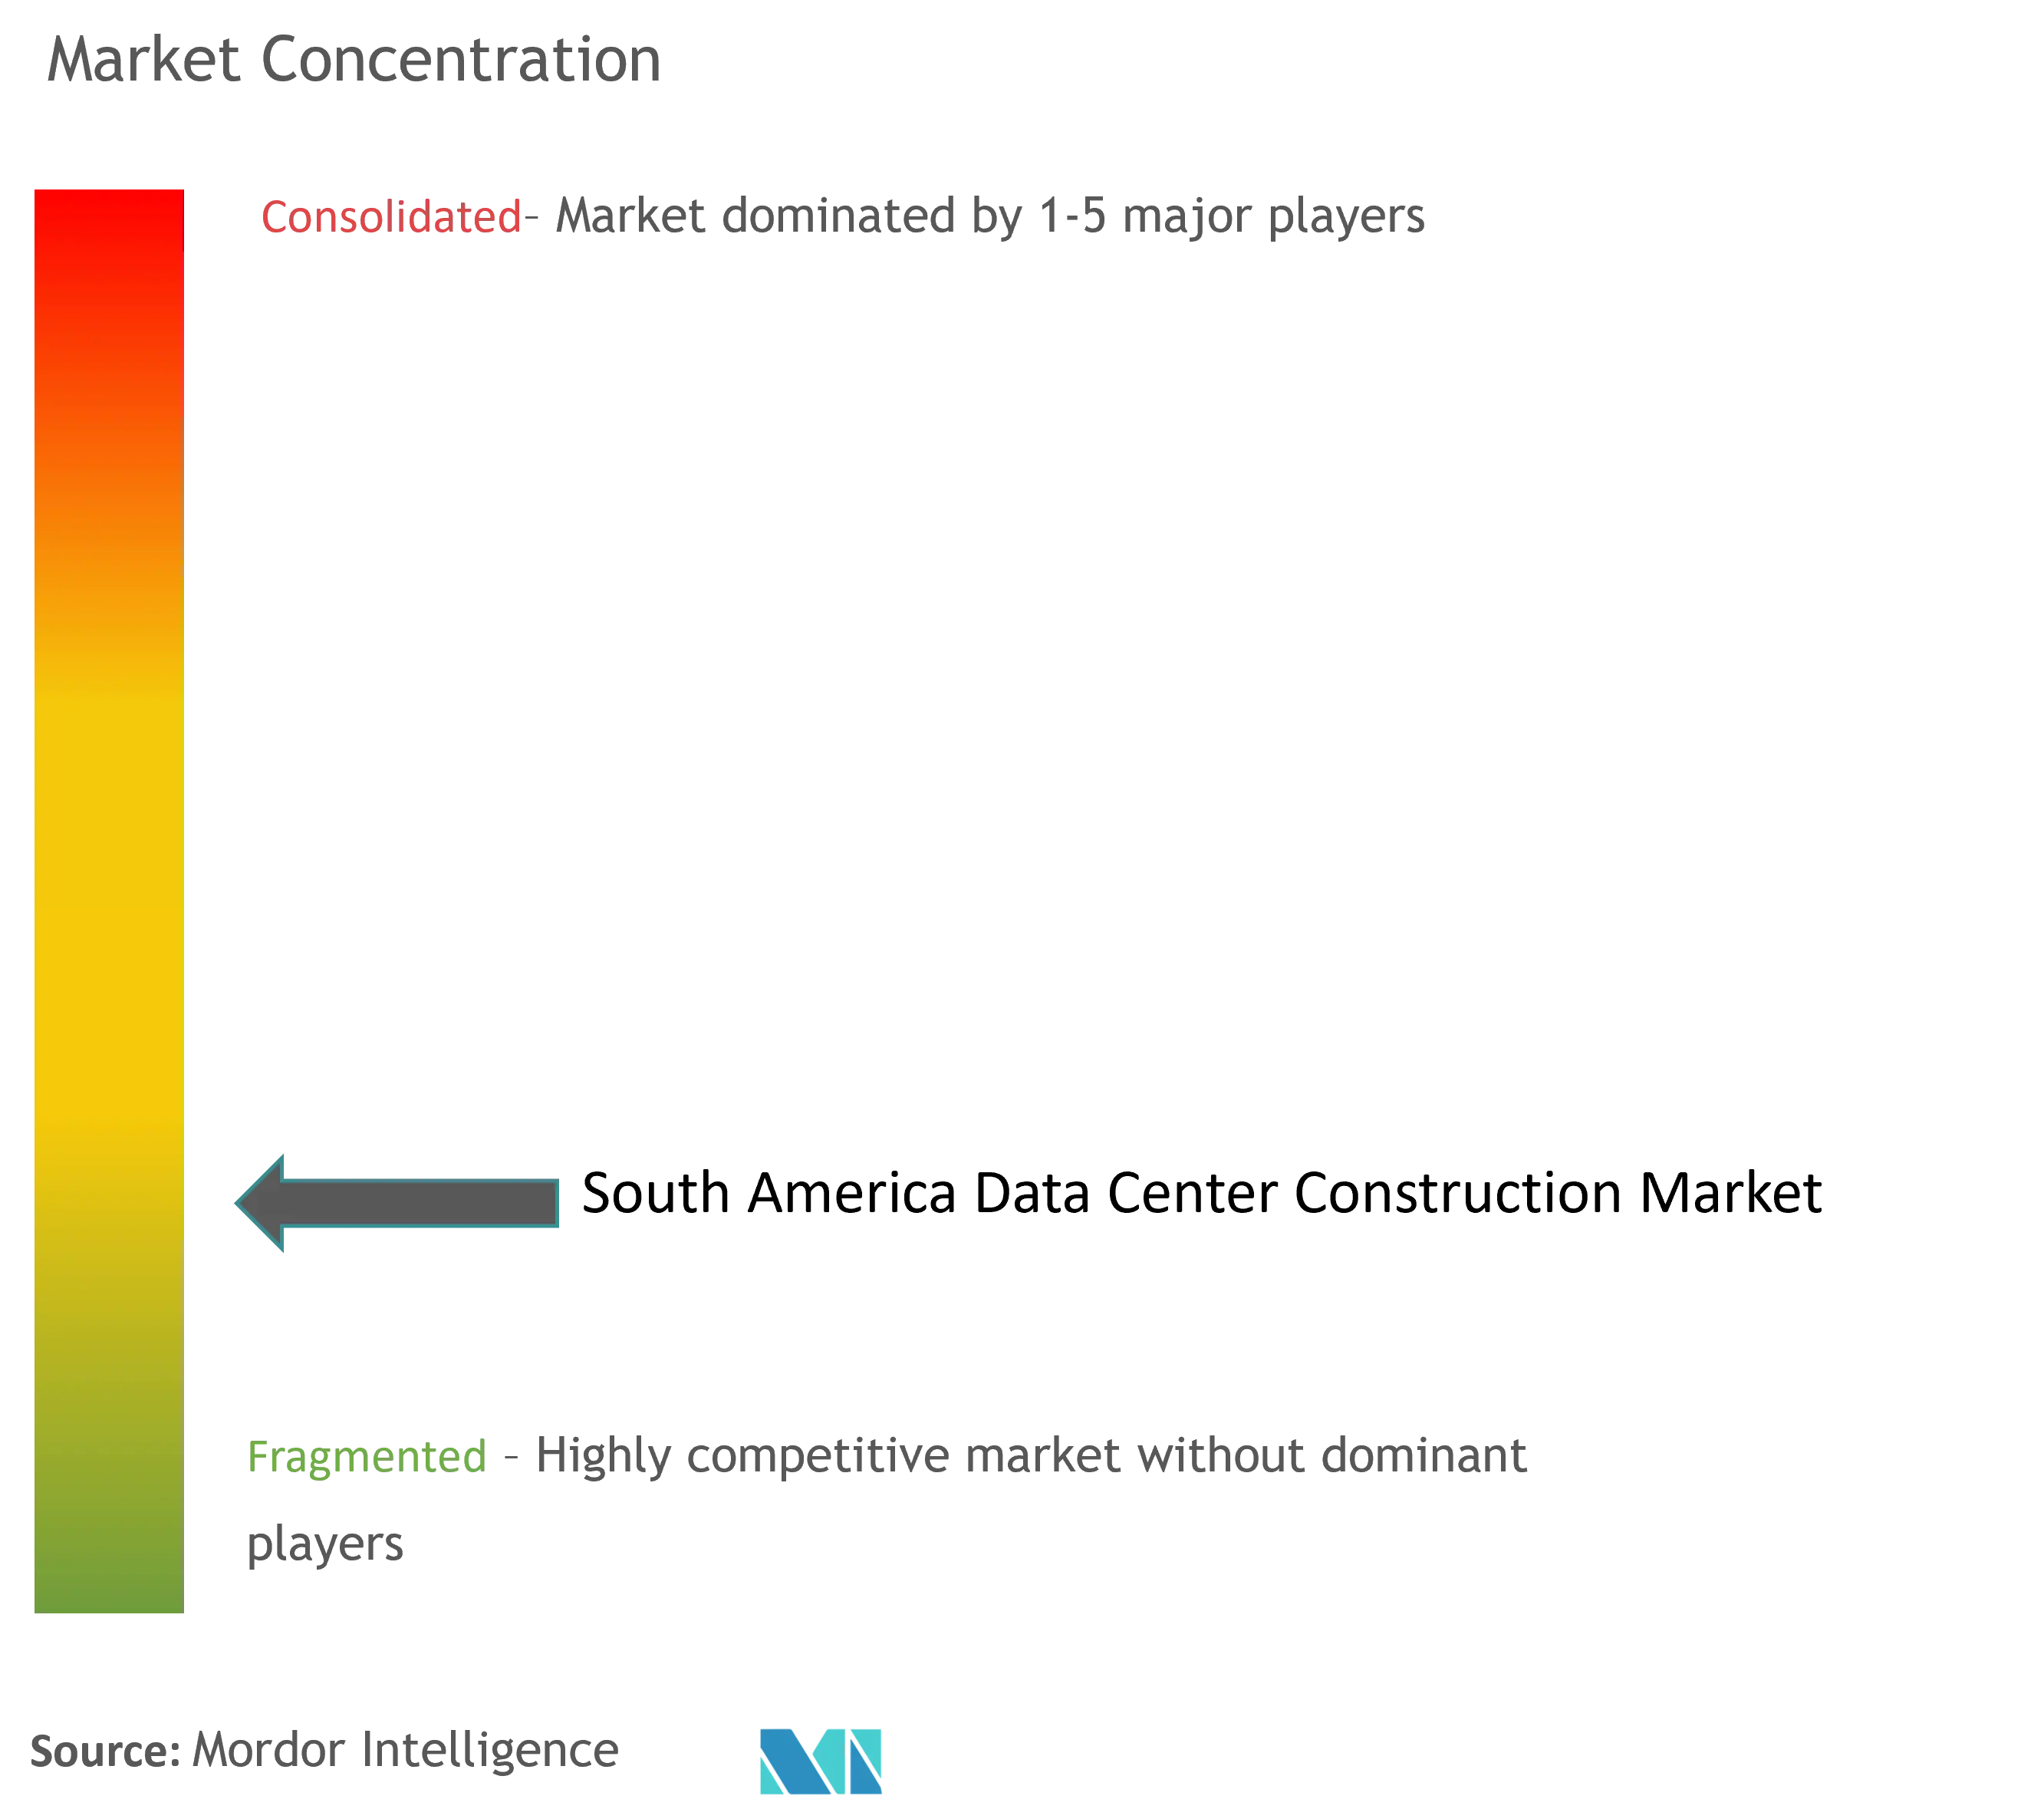
| Market Concentration | Medium |
Major Players *Disclaimer: Major Players sorted in no particular order Image © Mordor Intelligence. Reuse requires attribution under CC BY 4.0. | |
South America Data Center Construction Market Analysis by Mordor Intelligence
South America data center construction market size in 2026 is estimated at USD 5.72 billion, growing from 2025 value of USD 5.24 billion with 2031 projections showing USD 8.88 billion, growing at 9.18% CAGR over 2026-2031. Capacity additions are propelled by cloud-first enterprise strategies, rising AI workloads that demand specialized infrastructure, and strategic tax incentives across Brazil and Chile. Hyperscale and colocation capital expenditure are expected to increase significantly, translating into rapid greenfield builds and expansions in São Paulo, Santiago, and Fortaleza. Tier 3 sites dominate current deployments, yet Tier 4 facilities are growing the fastest as financial services, gaming, and public-sector workloads migrate to mission-critical environments. Intensifying competition among AWS, Microsoft, Google, Scala Data Centers, and regional specialists is amplifying demand for power backup, high-density cooling, and renewable energy procurement. Construction firms are responding with modular designs, prefabricated components, and integrated sustainability features to meet compressed build timelines and evolving regulatory frameworks.
Key Report Takeaways
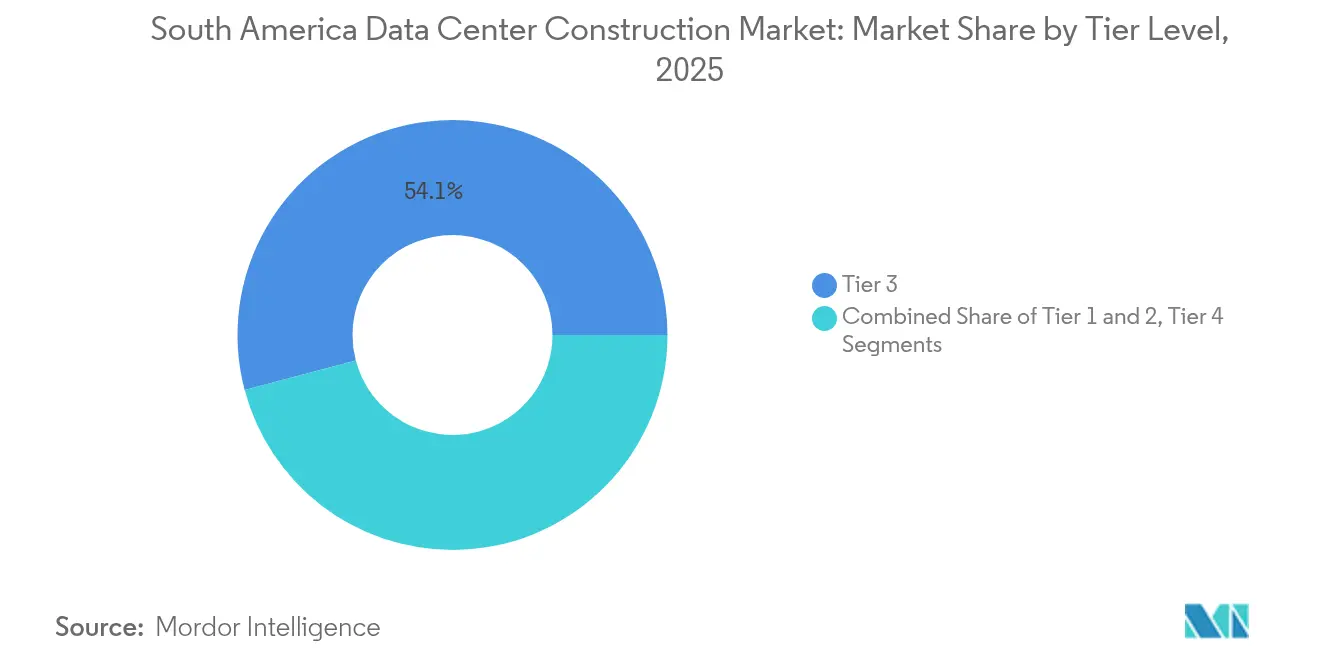
- By tier type, Tier 3 facilities held 54.12% of the South America data center construction market share in 2025, while Tier 4 is projected to expand at an 11.24% CAGR through 2031.
- By data center type, colocation services accounted for 55.63% share of the South America data center construction market size in 2025; self-built hyperscalers record the highest 11.76% CAGR to 2031.
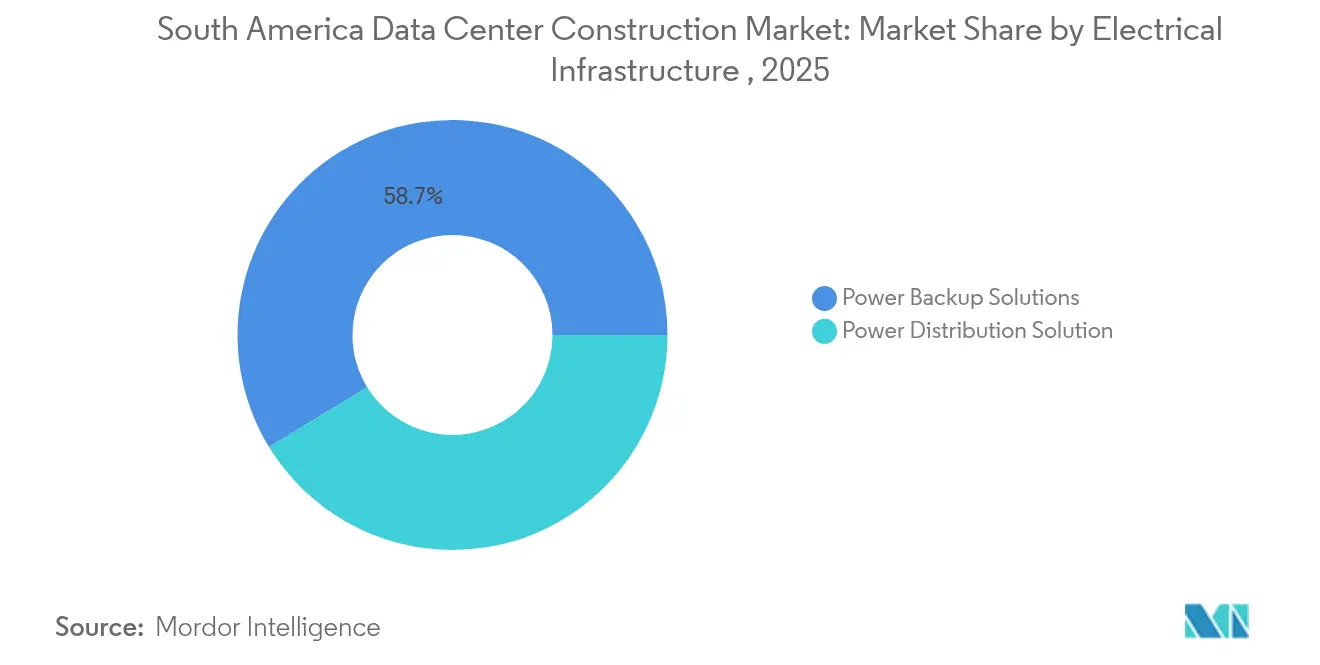
- By electrical infrastructure, power backup solutions led with a 58.73% share in 2025, and power distribution is set to grow at an 11.42% CAGR through 2031.
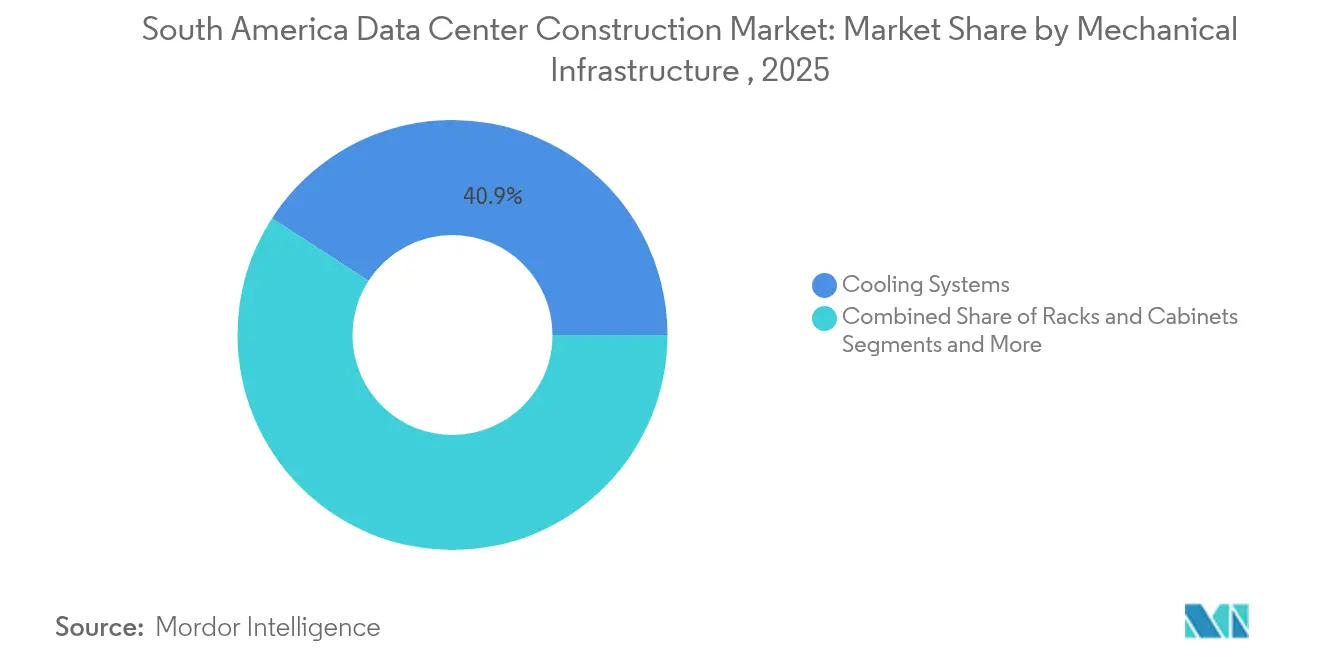
- By mechanical infrastructure, cooling systems captured 40.86% revenue share in 2025, whereas servers and storage show the fastest 9.94% CAGR to 2031.
Note: Market size and forecast figures in this report are generated using Mordor Intelligence’s proprietary estimation framework, updated with the latest available data and insights as of 2026.
South America Data Center Construction Market Trends and Insights
Drivers Impact Analysis*
| Driver | (~)% Impact on CAGR Forecast | Geographic Relevance | Impact Timeline |
|---|---|---|---|
| Cloud-first enterprise digitalization wave | +2.1% | Brazil, Chile, Colombia core markets | Medium term (2-4 years) |
| Hyperscale and colocation capex build-out acceleration | +1.8% | São Paulo, Santiago, Rio de Janeiro primary hubs | Short term (≤ 2 years) |
| AI / GPU-dense workloads driving high-density designs | +1.4% | Global, with Brazil and Chile leading adoption | Long term (≥ 4 years) |
| Government "neutral host" tax incentives in Brazil and Chile | +0.9% | Brazil and Chile national policies | Medium term (2-4 years) |
| Green financing access for Tier III+ energy-efficient builds | +0.7% | Regional, strongest in Chile and Brazil | Long term (≥ 4 years) |
| Sub-1 ms latency demand from fintech and gaming hubs | +0.5% | São Paulo, Santiago, Buenos Aires financial centers | Short term (≤ 2 years) |
| Source: Mordor Intelligence | |||
Cloud-first Enterprise Digitalization Wave
Enterprise adoption of hybrid cloud is reshaping construction priorities as organizations exit legacy on-premises environments. Secondary cities such as Fortaleza have emerged as strategic hubs because sixteen submarine cables deliver global connectivity that rivals major metros. Colombia illustrates the trend, with internet penetration surpassing two-thirds of the population and e-commerce surging, which increases demand for carrier-neutral facilities.[1]World Bank Group, “Digital Economy in Colombia 2025,” worldbank.org Brazil-based Patria committed USD 1 billion to a new platform targeting these enterprise workloads, signalling the scale of opportunity. Data sovereignty rules across the region further accelerate colocation uptake as enterprises seek compliant environments. Providers able to deliver hybrid cloud gateways and robust compliance frameworks are gaining share in the South America data center construction market.
Hyperscale and Colocation Capex Build-out Acceleration
Cloud majors have announced more than USD 8 billion in new sites through 2030, compressing traditional build schedules to as little as 18 months. AWS’s USD 4 billion Chile region and USD 1.8 billion Brazil expansion, along with V.tal’s USD 1 billion Fortaleza campus, are catalyzing regional supply chains. Scala Data Centers’ USD 50 billion AI City proposal targeting 4.7 GW exemplifies superscale ambition. Modular designs and prefabricated power rooms are now mainstream to meet hyperscale timelines. Smaller operators are consolidating or partnering with construction specialists to remain competitive in the South America data center construction market.
AI / GPU-dense Workloads Driving High-density Designs
AI training clusters are lifting rack densities to 40-140 kW, far above the 5-10 kW legacy norm, forcing adoption of direct liquid and immersion cooling. Scala’s AI City is engineered for these workloads with purpose-built cooling and reinforced floors. Contractors with high-density expertise are in demand, while conventional builders face steep learning curves. Samsung C&T has introduced underwater cooling solutions tailored for this market. Vertiv identifies AI enablement and energy efficiency as top transformation themes shaping Latin American data centers. [2]Vertiv, “Two Key Elements in the Transformation of Data Centers in Latin America: Integration of Artificial Intelligence and Energy Efficiency,” vertiv.com
Government “Neutral Host” Tax Incentives in Brazil and Chile
Brazil grants tax exemptions on qualifying data center investments, targeting facilities that meet energy efficiency and local content rules to cement the country’s role as the region’s digital hub. Chile’s National Data Centers Plan launched in December 2024 sets a USD 2.5 billion investment target backed by streamlined construction guides and environmental criteria.[3]UN Trade and Development (UNCTAD), “Chile - Launches National Data Centers Plan | Investment Policy Monitor,” unctad.org Argentina’s new RIGI framework encourages projects above USD 200 million, with Cirion planning a 20 MW Buenos Aires site. These incentives lower development costs and favor Tier III and Tier IV builds that incorporate renewable energy.
Restraints Impact Analysis*
| Restraint | (~) % Impact on CAGR Forecast | Geographic Relevance | Impact Timeline |
|---|---|---|---|
| Escalating power and real-estate costs | -1.2% | São Paulo, Santiago, Rio de Janeiro | Short term (≤ 2 years) |
| Long lead-time for utility grid interconnects | -0.9% | Brazil, Argentina | Medium term (2-4 years) |
| Skilled labor shortages for complex MEP installations | -0.7% | Brazil, Chile, Colombia | Long term (≥ 4 years) |
| Water-stress regulations limiting evaporative cooling | -0.5% | Chile, northeastern Brazil | Medium term (2-4 years) |
| Source: Mordor Intelligence | |||
Escalating Power and Real-estate Costs
Land suitable for hyperscale campuses in São Paulo now commands premium valuations, pushing developers toward secondary zones such as Campinas that offer larger parcels and improved power headroom. Brazil sources 85% of its electricity from renewables, yet drought cycles reduce hydropower output and raise electricity prices, affecting facility operating costs. Public concern about grid stress has grown as citizens fear data centers may jeopardize the residential supply. Developers respond with on-site solar, battery storage, and power purchase agreements that shape construction blueprints in the South America data center construction market.
Long Lead-time for Utility Grid Interconnects
Securing new grid connections can stretch construction timelines by up to seven years, particularly for 100 MW-plus campuses. Developers mitigate risk by funding transmission upgrades and building private substations; Scala’s 560 MW substation in São Paulo underscores this capital commitment. Sites with existing high-voltage infrastructure gain a competitive advantage during site selection across the South America data center construction market.
*Our forecasts treat driver/restraint impacts as directional, not additive. The impact forecasts reflect baseline growth, mix effects, and variable interactions.
Segment Analysis
By Tier Type: Mission-Critical Drives Premium Growth
Tier 3 sites captured 54.12% of overall revenue in 2025, reflecting enterprise preference for resilient yet cost-balanced designs. Within this category, banks and digital-first retailers account for the majority of spend on redundant power trains and multi-path fibre. The South America data center construction market size for Tier 3 facilities is projected to expand steadily as cloud regions seek adjacent interconnection space. Tier 4 capacity, while smaller today, shows an 11.24% CAGR through 2031 as AI model training, government public-cloud mandates, and fintech platforms demand 99.995% uptime. The South America data center construction market share associated with Tier 4 builds is therefore positioned to rise, intensifying competition for contractors able to deliver concurrent maintainability and fault tolerance.
Higher tiers require dual utility feeds, active-active power architectures, and stringent certification audits that lengthen commissioning cycles. Contractors specialising in complex mechanical, electrical, and plumbing systems thus command price premiums. HostDime’s ISO 27701 achievement in Brazil illustrates how compliance certifications intersect with tiering decisions


By Data Center Type: Hyperscaler Reshape Market Dynamics
Colocation retained 55.63% of 2025 revenue as enterprises sought scalable alternatives to on-premises servers while maintaining network diversity and regulatory compliance. Carrier-neutral sites in major metros recorded near-full occupancy, pushing new builds toward suburbs and secondary cities. Simultaneously, self-built hyperscale sites register a 11.76% CAGR to 2031, elevating the South America data center construction market size for proprietary campuses. AWS, Microsoft, and Google expand footprints to support cloud regions and edge nodes tuned for sub-1 ms latency critical to gaming and fintech transactions.
Hyperscalers deploy repeatable design templates that compress schedule risk and simplify vendor qualification, leading to bulk procurement of switchgear, generators, and prefabricated modules. This standardisation cascades through local supply chains, incentivising parts manufacturers to align with global specifications. Colocation operators respond with ecosystem-rich campuses offering cross-connect fabrics and cloud on-ramps to differentiate in the South America data center construction market.
By Electrical Infrastructure: Power Systems Drive Complexity
Power backup accounts for 58.73% share because grid volatility necessitates robust uninterruptible architectures. Diesel rotary UPS, lithium-ion battery systems, and static UPS topologies dominate specifications, with renewable integration gaining ground via microgrids and on-site solar arrays. Power distribution sees an 11.42% CAGR as AI racks require innovative busway layouts, intelligent PDUs, and granular power monitoring. South America data center construction market size related to switchgear, transformers, and converged monitoring platforms is therefore increasing in tandem with computational intensity.
Elevated power densities push designers to separate critical and non-critical loads within the data hall, demanding precise coordination between electrical engineers and IT architects. Banrisul’s deployment of Cisco MDS technology highlights the intersection of modern power distribution and a high-performance storage environment. Skilled electricians familiar with medium-voltage interlocks and arc-flash safety standards are in short supply, adding schedule risk to major projects.
By Mechanical Infrastructure: Cooling Innovation Leads Transformation
Cooling systems held 40.86% of mechanical revenue in 2025 as hot-aisle containment, chillers, and CRAH units remained foundational. Immersion and direct liquid solutions move from pilot to production as rack densities rise, which propels the fastest 9.94% CAGR in servers and storage hardware that require tailored enclosures. Mechanical scopes increasingly integrate water-free cooling to comply with Chilean and northeastern Brazilian drought regulations. Samsung C&T’s underwater heat-exchange technology offers alternative pathways to reduce potable water use.
New builds accommodate heavier AI servers by reinforcing raised-floor loading and widening rack spacing for maintenance. Thermal energy storage, heat reuse into district systems, and machine-learning-driven airflow optimisation are emerging differentiators within the South America data center construction market. Alignment between mechanical and electrical teams becomes critical as cooling set points influence power budgets and redundancy levels.
Geography Analysis
Brazil dominates the South America data center construction market with more than 60 active facilities and 46 projects in the pipeline. São Paulo alone houses around 80% of the national capacity, yet land scarcity and grid congestion encourage developers to migrate toward Campinas and Porto Alegre. Microsoft’s USD 2.7 billion commitment and AWS’s USD 1.8 billion expansion underscore Brazil’s central role. The country’s 85% renewable electricity mix offers sustainability benefits, though droughts reduce hydropower output and raise approval hurdles, shaping design choices around on-site generation and energy storage.
Chile is the region’s second major hotspot, backed by the National Data Centers Plan targeting USD 2.5 billion in investment. Amazon’s USD 4 billion Santiago region slated for 2026 leverages abundant solar and wind resources while prioritising water-efficient cooling. Yet water stress prompted Google to pause a USD 200 million Santiago expansion amid environmental scrutiny. Developers now incorporate closed-loop and air-cooled chillers to satisfy strict permitting standards. Santiago’s proximity to subsea cables and its fintech community sustains demand for low-latency hubs.
Competitive Landscape
The competitive profile remains moderately fragmented but is trending toward consolidation as hyperscale cloud providers accelerate direct builds. AWS, Microsoft, and Google collectively account for the bulk of announced capacity, leveraging global procurement leverage to secure generator sets, switchgear, and liquid cooling systems at scale. Scala Data Centers, Ascenty, Equinix, and V.tal expand through greenfield campuses and acquisitions, focusing on interconnection ecosystems and renewable energy procurement. Patria’s USD 1 billion platform signals growing interest from infrastructure investors seeking stable, long-term returns in the South America data center construction market.
Strategic differentiation centres on sustainability, latency, and ecosystem depth. Scala’s partnership with Serena Energia secures wind power, reducing exposure to grid emission factors. Equinix expands Rio de Janeiro footprint, adding metro interconnect capacity for content and gaming clients. Construction firms such as Turner Construction, DPR Construction, and ACECO TI pivot to integrated design-build models, offering prefabricated modules to cut lead times. Smaller regional players increasingly specialise by targeting edge facilities in underserved cities, deploying modular 5 MW blocks that align with local demand profiles and utility constraints.
South America Data Center Construction Industry Leaders
AECOM
Turner Construction Company
Jacobs Solutions Inc.
DPR Construction
Fluor Corporation
- *Disclaimer: Major Players sorted in no particular order

Recent Industry Developments
- May 2025: Patria launched a USD 1 billion data center platform to serve enterprise transformation across Brazil.
- May 2025: Amazon committed USD 4 billion to a Chile cloud region slated for 2026
- January 2025: V.tal’s Tecto subsidiary secured land for a 200 MW hyperscale campus in São Paulo.
- January 2025: Equinix invested USD 94 million in its third Rio de Janeiro facility.


Research Methodology Framework and Report Scope
Market Definitions and Key Coverage
Our study defines the South America data center construction market as the yearly spending on new, purpose-built facilities where electrical, mechanical, and general building shells are delivered to an operational "ready-for-rack" state across Brazil, Chile, Colombia, Argentina, and the wider region. Projects commissioned by cloud hyperscalers, colocation providers, and enterprise owners are all counted.
Scope Exclusion: Refurbishment or expansion of existing halls, modular edge pods below 250 kW, and land-only transactions are outside scope.
Segmentation Overview
- By Tier Type
- Tier 1 and 2
- Tier 3
- Tier 4
- By Data Center Type
- Colocation
- Self-build Hyperscalers (CSPs)
- Enterprise and Edge
- By Infrastructure
- By Electrical Infrastructure
- Power Distribution Solution
- Power Backup Solutions
- By Mechanical Infrastructure
- Cooling Systems
- Racks and Cabinets
- Servers and Storage
- Other Mechanical Infrastructure
- General Construction
- Service - Design and Consulting, Integration, Support and Maintenance
- By Electrical Infrastructure
- Tier 1 and 2
Detailed Research Methodology and Data Validation
Primary Research
Mordor analysts next conduct confidential calls with EPC contractors, specialist brokers, and facility operators across Brazil, Chile, and Colombia. These interviews test utilization factors, reveal turnkey $/MW rates, and flag permitting bottlenecks that rarely surface in documents.
Desk Research
We begin with structured desk work that screens federal budget bills, building-permit portals, Anatel and Subtel capacity filings, UN Comtrade codes for UPS and CRAC imports, and white papers from the Latin American Cloud & Data Center Association. Company filings via D&B Hoovers and news flows on Dow Jones Factiva add pipeline values and contract signals that anchor the baseline. The sources named are illustrative; many other public and subscription references feed our evidence stack.
Market-Sizing & Forecasting
A top-down model converts disclosed and permitted IT-load additions into construction spend using country-specific $/MW multipliers. It then corroborates totals with sampled contract roll-ups. Key variables like hyperscale CAPEX announcements, 5G subscriber growth, average rack power density, utility-tariff trends, and PUE improvement curves feed a multivariate regression that projects value through 2030. Volume gaps for smaller countries are bridged by allocating regional spend shares derived from freight manifests and contractor insight.
Data Validation & Update Cycle
Outputs face two filters: anomaly checks against independent indicators like imported generator kVA and announced submarine-cable landings, followed by peer review within the analyst team before sign-off. Models refresh annually; interim updates trigger when pipeline changes exceed 10% or any single deal tops USD 500 million.
Why Mordor's South America Data Center Construction Baseline Earns Trust
Published figures often differ because firms slice geography differently, treat refurbishments as new builds, or freeze exchange rates at varying points.
Benchmark comparison
| Market Size | Anonymized source | Primary gap driver |
|---|---|---|
| USD 5.24 Bn (2025) | Mordor Intelligence | - |
| USD 4.80 Bn (2025) | Regional Consultancy A | Omits Chile projects announced after Q1 2025 |
| USD 4.00 Bn (2024) | Global Consultancy B | Excludes hyperscale self-builds and relies on 2022 cost benchmarks |
The comparison shows that narrower scopes or older baselines naturally pull numbers down, whereas Mordor's disciplined inclusion rules, yearly refresh, and double-sourced variables give decision-makers a balanced, reproducible foundation.


Key Questions Answered in the Report
What is the current value of the South America data center construction market?
The market stands at USD 5.72 billion in 2026 and is projected to rise to USD 8.88 billion by 2031.
Why are Tier 4 facilities growing faster than other tiers?
Financial services, government workloads, and AI training clusters demand 99.995% uptime, driving an 11.24% CAGR for Tier 4 builds through 2031.
How are power constraints influencing project locations?
High land and electricity costs in São Paulo and Santiago push developers toward secondary sites like Campinas and Fortaleza where grid headroom and land availability are greater.
What cooling technologies are gaining traction in the region?
Direct liquid and immersion cooling, as well as emerging underwater heat-exchange systems, are being adopted to support rack densities of up to 140 kW.
Page last updated on:


