
Market Overview
| Study Period | 2020 - 2031 |
|---|---|
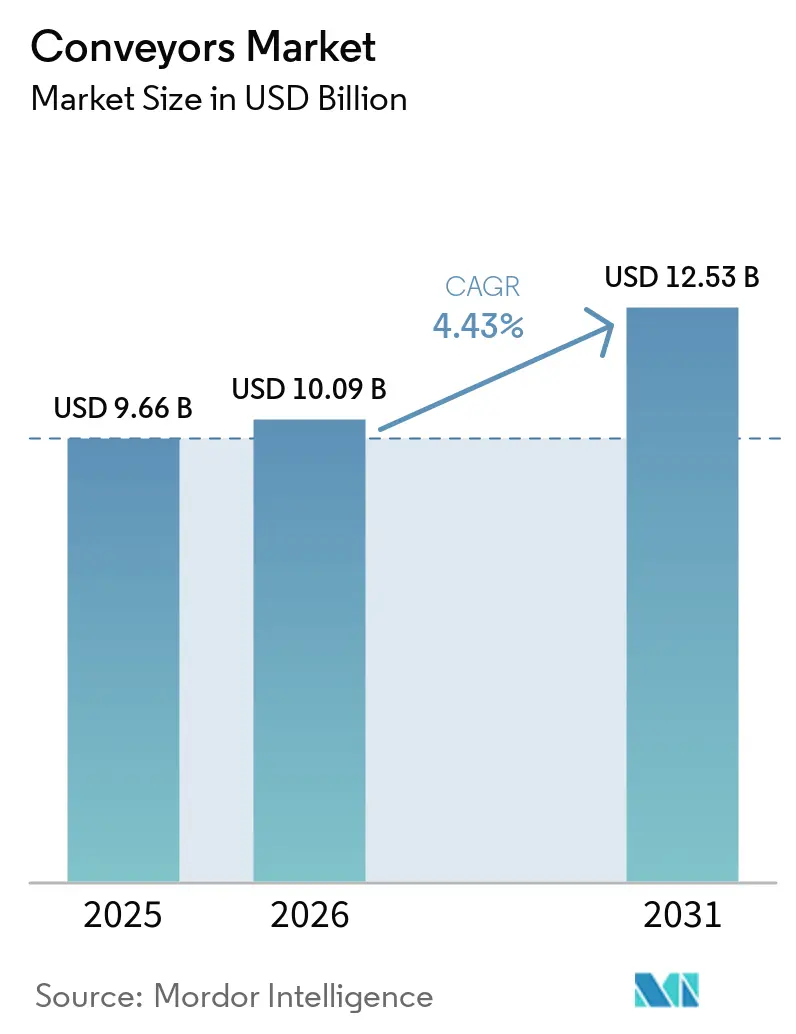
| Market Size (2026) | USD 10.09 Billion |
| Market Size (2031) | USD 12.53 Billion |
| Growth Rate (2026 - 2031) | 4.43 % |
| Fastest Growing Market | Asia Pacific |
| Largest Market | Asia Pacific |
| Market Concentration | Medium |
Major Players *Disclaimer: Major Players sorted in no particular order Image © Mordor Intelligence. Reuse requires attribution under CC BY 4.0. | |
Conveyors Market Analysis by Mordor Intelligence
Conveyors market size in 2026 is estimated at USD 10.09 billion, growing from the 2025 value of USD 9.66 billion, with 2031 projections showing USD 12.53 billion, growing at 4.43% CAGR over 2026-2031. The outlook is shaped by rapid e-commerce fulfillment growth, Industry 4.0 investment, and the search for energy efficiency that pushes regenerative-drive adoption capable of 37-39% power savings in downhill duty cycles.[1]Exploring the Economic Hypothetical for Downhill Belt Conveyors Equipped with Three-Phase Active Front-End Load Converters, Technologies, mdpi.com Asia-Pacific leads demand, while the Middle East records the fastest expansion as large logistics parks come online. Belt technology retains a plurality of installations, but overhead designs are scaling fastest because factories want floor-space relief. Software-driven predictive maintenance is emerging as the strongest component growth area, cutting unplanned downtime by up to 30% and extending asset life. At the same time, capital-spending hesitancy among smaller enterprises tempers the pace of high-end upgrades, and AGV/AMR substitution places added pressure on traditional fixed lines.
Key Report Takeaways
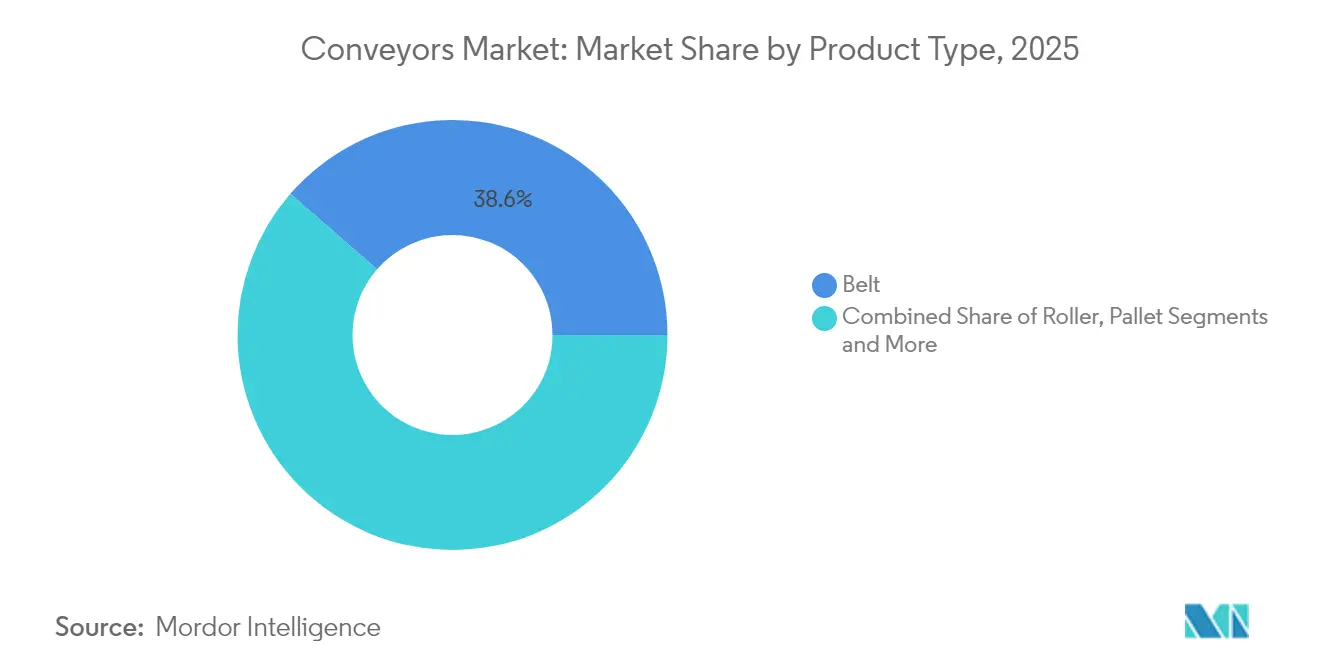
- By product type, belt conveyors led with 38.60% revenue share in 2025; overhead conveyors are projected to expand at an 5.16% CAGR to 2031.
- By load type, unit handling captured 63.55% of the conveyor systems market share in 2025, while bulk handling is forecast to grow at an 8.32% CAGR through 2031.
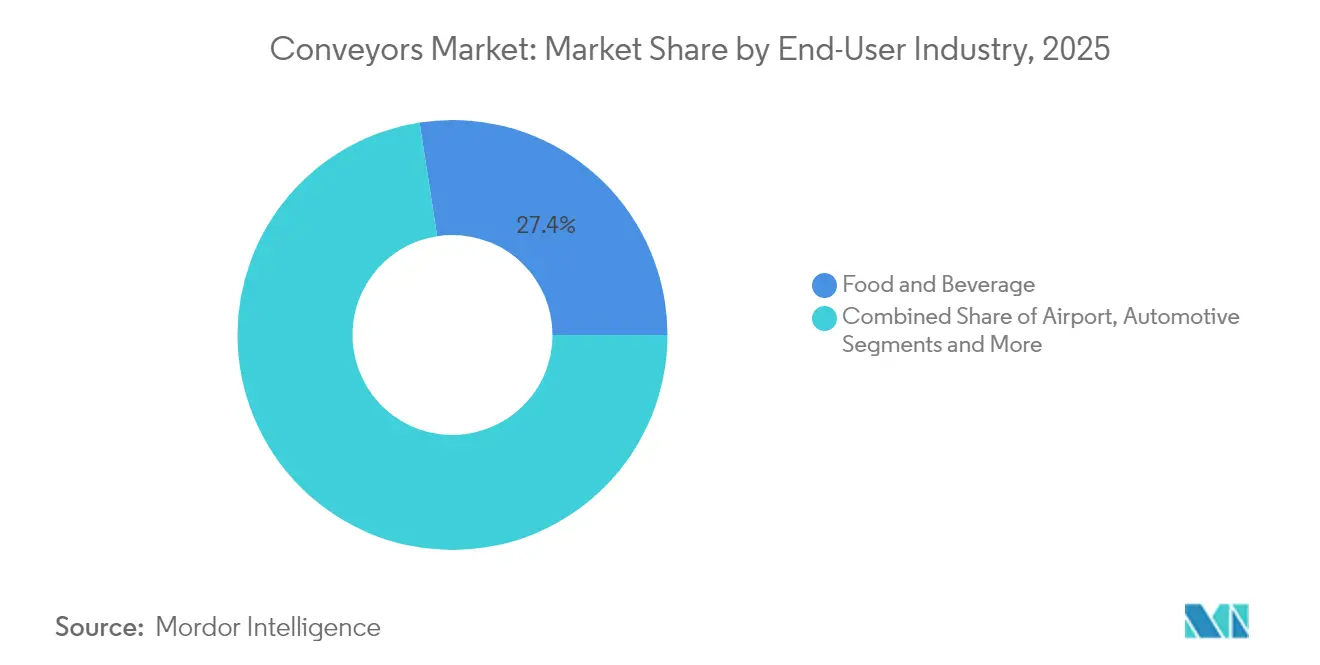
- By end-user industry, food and beverage held 27.45% share of the conveyor systems market size in 2025, and airport applications are advancing at a 8.74% CAGR to 2031.
- By system configuration, fixed/linear accounted for 58.95% share in 2025; modular/flexible configurations are expanding at a 9.12% CAGR to 2031.
- By component, conveying equipment represented 61.70% share in 2025, and software and analytics are growing at a 9.98% CAGR through 2031.
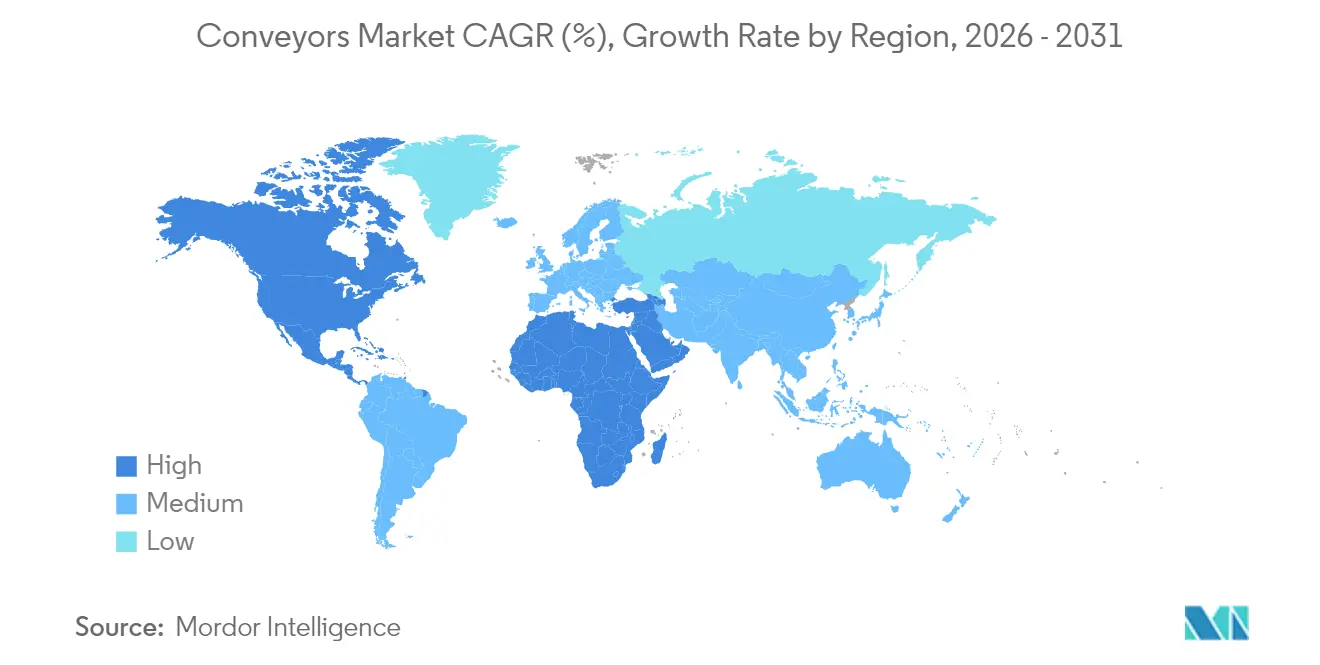
- By geography, Asia-Pacific commanded 37.65% share in 2025, while the Middle East records the fastest 8.55% CAGR during the forecast period.
Note: Market size and forecast figures in this report are generated using Mordor Intelligence’s proprietary estimation framework, updated with the latest available data and insights as of 2026.
Global Conveyors Market Trends and Insights
Drivers Impact Analysis*
| Driver | (~) % Impact on CAGR Forecast | Geographic Relevance | Impact Timeline |
|---|---|---|---|
| Rapid growth of e-commerce fulfillment centres | + 1.8% | Global, with concentration in North America, Europe, and APAC | Medium term (2-4 years) |
| Increasing demand for automated handling in food and beverage plants | +1.2% | Global, particularly strong in Europe and North America | Long term (≥ 4 years) |
| Rising airport passenger volumes boosting baggage-handling conveyors | +0.9% | Global, with recovery focus in Europe, North America, and APAC | Short term (≤ 2 years) |
| Government incentives for Industry 4.0 modernisation | +0.8% | APAC core, spill-over to Europe and North America | Medium term (2-4 years) |
| Urban micro-fulfillment requires compact modular conveyors | + 0.7% | North America and Europe, expanding to APAC urban centers | Medium term (2-4 years) |
| Energy-regenerative conveyor drives support ESG targets | +0.6% | Global, with early adoption in Europe and North America | Long term (≥ 4 years) |
| Source: Mordor Intelligence | |||
Rapid growth of e-commerce fulfillment centres
Urban micro-fulfillment nodes now need conveyor platforms that sort more than 7,200 boxes per hour while occupying minimal floor area. Café Amazon’s Thailand hub shows the model, handling 20,000 boxes a day across 4,000 outlets via a modular Interroll system.[2]Café Amazon success story | Interroll solutions, interroll.com High-throughput crossbelt sorters keep same-day delivery promises, and vertical layouts maximize cubic throughput in space-restricted Asian megacities. Developers specify plug-and-play conveyor modules so that facilities can be re-arranged without civil works. These requirements sustain robust equipment replacement cycles and reinforce the conveyor systems market as a backbone of last-mile logistics.
Increasing demand for automated handling in food and beverage plants
Processors move beyond hygiene compliance toward end-to-end throughput optimization. Balaji Wafers reached zero unplanned downtime by shifting to Activated Roller Belt lines that maintain gentle product handling.[3]Back-end automation that's future ready, Intralox, intralox.com Vision-equipped conveyors conduct real-time defect checks, shrinking manual inspection. In high-volume snack packaging, DirectDrive spirals now run for 48 hours straight at Diversified Foods, eliminating historic mechanical failures. Modular plastic belting extends service life, and emerging plant-based product lines require adaptable layouts able to process fragile items with varying moisture profiles.
Rising airport passenger volumes boosting baggage-handling conveyors
Stansted Airport invested USD 70 million to install 2.4 km of belts plus 180 autonomous carts, raising its baggage throughput and service reliability.[4]Bags of Innovation: Automated Baggage Handling, Airport Industry Review, airport.nridigital.com IoT sensors now tag bags from check-in to carousel, and Power Stow loader belts reduce ground-crew strain at more than 400 sites. Larger aircraft fleets amplify peak loads, so airports demand conveyors that sustain high duty cycles while integrating with automated screening.
Government incentives for Industry 4.0 modernisation
India’s SAMARTH Udyog Bharat 4.0 centers and the U.S. Department of Energy’s USD 400 million grant pool subsidize smart-factory retrofits, including data-driven conveyor upgrades. Funding offsets upfront cost barriers and accelerates adoption of regenerative-drive and cybersecure controls. Incentive structures vary regionally, creating location-based competitive advantages for equipment suppliers.
Restraints Impact Analysis*
| Restraint | (~) % Impact on CAGR Forecast | Geographic Relevance | Impact Timeline |
|---|---|---|---|
| High upfront CAPEX and long ROI periods | -1.4% | Global, particularly impacting SMEs in developing markets | Medium term (2-4 years) |
| Retrofit integration risk causing production downtime | -0.8% | Global, with higher impact in mature manufacturing regions | Short term (≤ 2 years) |
| AMRs and AGVs emerging as substitute technologies | -0.6% | North America and Europe, expanding to APAC | Medium term (2-4 years) |
| OT-IT cyber-vulnerabilities in conveyor control networks | -0.4% | Global, with heightened concern in critical infrastructure | Long term (≥ 4 years) |
| Source: Mordor Intelligence | |||
High upfront CAPEX and long ROI periods
Even with 15% internal rates of return, energy-regenerative drives need six years to recoup capital, a hurdle for cash-constrained firms. Steel price swings between USD 870-950 per ton complicate budgeting. Leasing models exist, yet adoption lags in regions with tight credit markets. This cost tension restrains premium equipment penetration within the conveyor systems market.
AMRs and AGVs emerging as substitute technologies
Mobile robots recorded 17% demand growth and reach ROI inside eight months in warehouses, undercutting traditional lines priced at EUR 79,200 (USD 91,400) versus EUR 49,000 (USD 56,500) for AGV solutions. Conveyors remain superior for continuous high-throughput flows, yet buyers evaluate flexibility gains when deciding capital projects, creating incremental share loss for fixed systems.
*Our forecasts treat driver/restraint impacts as directional, not additive. The impact forecasts reflect baseline growth, mix effects, and variable interactions.
Segment Analysis
By Product Type: Belt dominance faces overhead innovation
Belt conveyors retained 38.60% share in 2025, a cornerstone of mining, food, and general manufacturing lines. The Dune Express in Texas proves belt scale, moving 13 million tons annually across 42 miles and removing 25,000 truck trips. Overhead variants lift at an 5.16% CAGR as factories open floor space and improve worker safety. Roller systems benefit from modular frames suited to reconfigurable assembly, while pallet lines serve precision automotive tasks. Across categories, smart sensors push predictive maintenance accuracy above 95%.
The conveyor systems market size for belt solutions is projected to expand alongside sustainable mining and bulk logistics projects, whereas overhead designs capture incremental share by maximizing cubic utilization. Overhead conveyor market size for type segmentation shows monorail systems capturing 34.75% revenue in 2025, but power & free designs are outpacing at a 6.32% CAGR. Energy-efficient vibratory designs need only 20% of the traditional drive force, reflecting cross-segment innovation. Slat and chain lines remain embedded in heavy vehicle production, yet their growth is tempered by rising demand for flexible alternatives.



By Load Type: Unit handling leads bulk processing
Unit handling represented 63.55% of 2025 demand, driven by e-commerce and discrete manufacturing workflows that value gentle product control and zero-pressure accumulation. Systems with vision-assisted defect detection now handle classification tasks while improving safety. Bulk handling, though smaller, will outpace unit growth at 8.32% CAGR, keyed to commodities growth and agriculture modernisation. Hybrid installations blur boundaries as plants seek infrastructure able to switch between pallets and granular feed.
In mining, TAKRAF’s Collahuasi project underlines heavy-duty bulk capacity requirements. Pharmaceutical cleanrooms depend on vacuum conveyors transferring more than 11,100 liters per hour while preserving sterility. These dual paths sustain diversified revenue streams within the conveyor systems market.
By End-User Industry: Food processing drives airport growth
Food and beverage plants held 27.45% share in 2025, propelled by strict hygiene and scalable demand. Conveyor lines designed for wash-down and modular belting dominate this arena. Airport systems post the fastest 8.74% CAGR, aligned with passenger traffic rebound and new terminal projects requiring IoT-enabled baggage tracking. Automotive manufacturers transition to EV battery handling, using pallet-less belting that boosts throughput and safety.
Manufacturing applications diversify across electronics, pharmaceuticals, and heavy machinery. Mining operations remain belt-centred but push regenerative technology to curb emissions, supporting ESG commitments. Retail and parcel segments integrate omnichannel strategies, leveraging sortation conveyors to bridge store and online channels. This diversity cushions the conveyor systems market against cyclical swings in any single vertical.
By System Configuration: Modular flexibility challenges fixed systems
Fixed/linear lines retained 58.95% share in 2025, favored where 24/7 throughput trumps layout changeability. Japan’s 310-mile freight conveyor between Tokyo and Osaka illustrates large-scale fixed efficiency. Modular/flexible systems outpace at 9.12% CAGR, prized for rapid reconfiguration in consumer goods and micro-fulfillment settings. Plug-and-play electrics and standardized interfaces trim component variants by 85%.
The conveyor systems market size for modular platforms grows as omnichannel retailers scale pop-up hubs. Fixed assets remain critical in high-capacity mines and process plants, but hybrid blueprints now stitch modular branches onto fixed trunks, giving operators best-of-both performance.
By Component: Software analytics outpaces hardware growth
Conveying equipment stayed the largest slice at 61.70% in 2025. Yet software and analytics enjoys a 9.98% CAGR as predictive-maintenance dashboards cut field visits and lifted output by 0.6%, worth USD 1.12 million annually for a Flexco deployment. Drives and controls welcome regenerative designs that slash energy use by up to 39%.
Across components, artificial-intelligence algorithms optimize motor magnetics in real time, lowering consumption without throughput sacrifice. Edge computation embedded in controllers minimizes latency and cloud reliance, reinforcing cyber-secure architectures within the conveyor systems market.
Geography Analysis
Asia-Pacific accounted for 37.65% of the conveyor systems market in 2025, anchored by expanding manufacturing clusters in China, India, and Southeast Asia. Daifuku’s new Indian factory underscores rising local demand from automotive and electronics verticals. China continues to install heavy-duty bulk belts in mining and port infrastructure, while India leverages SAMARTH Udyog facilities to accelerate smart-factory retrofits. Cleanroom conveyor demand rises with semiconductor investment, and Japan’s 310-mile freight line spotlights megaproject ambition.
The Middle East, growing at an 8.55% CAGR, benefits from logistics diversification agendas. Saudi Vision 2030 dedicates USD 106.6 billion to freight corridors such as Oxagon, driving need for high-capacity sortation and port conveyors. The UAE logistics market, valued at USD 20.03 billion in 2025, underpins warehouse automation outlays forecast at USD 1.6 billion by 2025.
North America and Europe continue to modernize legacy installations, spurred by DOE energy-efficiency grants and EU carbon regulations. Regenerative drives see early uptake, especially in Europe where green mandates elevate ROI calculations. South America and Africa show pockets of growth tied to mining and port projects, yet capital constraints slow adoption of analytics-heavy systems.

Regulatory Landscape
Conveyor system design and operation are governed by workplace safety rules and consensus standards that shape guarding, controls, and installation practices. In the United States, OSHA requirements apply to conveyors in construction settings (for example, 29 CFR 1926.555), and compliance programs commonly reference ASME B20.1 as a safety benchmark. The 2024 edition (ASME B20.1-2024) updates the consensus baseline used by many owners, integrators, and inspectors when specifying or auditing conveyor installations.
In Europe, the regulatory trajectory is moving beyond mechanical safety toward digital resilience as conveyors increasingly embed sensors, networking, and AI-enabled functions. The EU Machinery Regulation (Regulation (EU) 2023/1230) becomes applicable on January 20, 2027, adding essential health and safety requirements that explicitly address cybersecurity and digital instructions, while the EU AI Act (Regulation (EU) 2024/1689) introduces compliance obligations for high-risk AI systems that can overlap with safety-related conveyor applications. Separately, supply chain and pricing for conveyor equipment and components can be influenced by trade policy actions, including the US Department of Commerce initiating a Section 232 investigation into robotics and industrial machinery on September 2, 2025, which adds uncertainty to sourcing decisions for imported industrial machinery categories.
Competitive Landscape
The conveyor systems market shows moderate fragmentation with a strengthening tilt toward scale players leveraging M&A. Pacteon’s acquisition of Descon expands its end-of-line portfolio for food and beverage clients. Traditional manufacturers face substitution risk from AGV/AMR vendors, prompting alliances such as Siemens teaming with SuperTrak to embed smart conveyance in the TIA platform.
White-space remains in regenerative mining conveyors and pharmaceutical cleanroom mobility, where Stäubli’s Sterimove robot breaks new ground. Competitive edge increasingly hinges on AI-driven diagnostics that exceed 95% fault-prediction accuracy. Vendors that package hardware robustness with lifecycle analytics gain preference as buyers elevate total cost-of-ownership metrics over sticker price.
Conveyors Industry Leaders
Daifuku Co. Ltd
SSI Schaefer AG
Murata Machinery Ltd
BEUMER Group GmbH & Co. KG
Honeywell Intelligrated Inc.
- *Disclaimer: Major Players sorted in no particular order


Market Opportunities and Future Outlook
A key opportunity is shifting conveyors from largely mechanical assets to software-instrumented, cyber-aware systems that integrate with warehouse execution and plant automation platforms, especially where throughput and uptime requirements outweigh the flexibility advantages of AMRs and AGVs. This aligns with customer demand for higher-performance distribution and manufacturing conveyance, alongside vendor roadmaps emphasizing controls, diagnostics, and AI-enabled operation, reinforcing the report segmentation where software and analytics is the fastest-growing component category. Programs that subsidize smart-factory retrofits, including India’s SAMARTH Udyog Bharat 4.0 centers and the US Department of Energy’s USD 400 million grant pool, also create near-term whitespace for upgrades that combine energy-regenerative drives with secure OT-IT connectivity.
Capacity localization and broader solution coverage are another investable whitespace, as integrators and OEMs expand regional footprints to reduce lead times and support end-to-end projects across automotive, semiconductors, and logistics. Daifuku’s moves provide a concrete marker of this direction, including its April 2026 decision to acquire Eisenmann GmbH to deepen European automotive production systems capabilities and its May 2026 plan to invest about 52 billion yen during 2026-2029 to expand production capacity and pursue M&A, tied to specific sites (Shiga and Komaki) and the Eisenmann transaction. In bulk-heavy applications, Atlas Energy Solutions’ Dune Express deployment (a 42-mile system with first commercial delivery completed in March 2025) highlights demand for high-duty-cycle, energy-optimized conveyance, where regenerative drives and predictive maintenance can be bundled as lifecycle performance offers rather than one-off hardware sales.
Recent Industry Developments
- June 2026: Daifuku Intralogistics America launched the AutoRoll+ S motorized roller conveyor aimed at higher-performance distribution and manufacturing applications. The release highlights continued product investment in unit-handling conveyance as operators push for throughput, reliability, and easier integration into automated material flow.
- April 2026: American Industrial Partners signed a definitive agreement to acquire Honeywell’s Warehouse and Workflow Solutions business, including Intelligrated. The transaction sharpens competitive dynamics in warehouse automation by separating a major conveyor and sortation integrator from a diversified industrial parent and positioning it for portfolio and investment changes under new ownership.
- December 2024: Siemens partnered with SuperTrak CONVEYANCE to integrate Horizon3 smart transport technology with Siemens TIA Portal. This strengthens the OT-IT integration layer around intelligent conveyance, supporting a market shift toward controls, diagnostics, and software-centered differentiation.


Research Methodology Framework and Report Scope
Market Definition and Coverage
For this study, the conveyors market is defined as revenue generated from conveyor systems and related equipment used to move materials or goods within a facility, covering common mechanical types and the controls that make them operate safely and reliably.
Scope exclusions: We exclude broad material handling items that do not perform conveying, such as standalone lifting equipment and general warehousing furniture. We also exclude on-site installation labor when it is billed as a separate construction service.
Segmentation Overview
- By Product Type
- Belt
- Roller
- Pallet
- Overhead
- Slat / Chain
- Screw and Pneumatic
- By Load Type
- Unit Handling
- Bulk Handling
- By End-User Industry
- Airport
- Retail and E-commerce
- Automotive
- Food and Beverage
- Pharmaceuticals
- Mining and Quarrying
- Manufacturing (Discrete and Process)
- Others
- By System Configuration
- Fixed / Linear
- Modular / Flexible
- By Component
- Conveying Equipment
- Drives and Controls
- Software and Analytics
- By Region
- North America
- United States
- Canada
- Mexico
- South America
- Brazil
- Argentina
- Rest of South America
- Europe
- Germany
- France
- Italy
- United Kingdom
- Spain
- Rest of Europe
- Asia-Pacific
- China
- Japan
- India
- South Korea
- Australia
- Rest of Asia-Pacific
- Middle East
- Saudi Arabia
- United Arab Emirates
- Turkey
- Israel
- Rest of Middle East
- Africa
- South Africa
- Egypt
- Rest of Africa
- North America
Data Sources, Market Sizing, and Validation
Desk Research
Desk work starts by mapping what is being bought and where demand shows up, so the market boundary stays consistent across industries like manufacturing, airports, mining, and warehousing. We used public sources such as the US Census Bureau and Bureau of Labor Statistics for industrial activity signals, UN Comtrade for trade flows tied to machinery categories, and World Bank and OECD indicators for production and investment cycles.
To keep the model realistic at the product level, we also reviewed standards and safety references such as the International Organization for Standardization, plus USITC and national customs portals for import duties and classification notes that affect what gets counted as a conveyor. Company annual reports, earnings decks, and reputable press releases were reviewed to understand capacity additions, plant automation priorities, and pricing narratives. In a few steps, our analysts also checked paid subscriptions for company financials and patent databases to understand supplier exposure and technology direction. These sources are illustrative only, and we reviewed many other public materials to collect and validate data points.
Primary Interviews and Surveys
Primary work was used to confirm what portion of conveyor demand is replacement versus new projects, and to sanity check typical order sizes across end users including food processing, automotive plants, parcel hubs, and bulk handling sites. We spoke with manufacturers, component suppliers, system integrators, distributors, and large buyers across major regions, so gaps from desk inputs could be closed and the final assumptions could be cross-checked.
Distribution of primary research fieldwork respondents
| Company type | Respondent position | Region |
|---|---|---|
| Top tier: 28% | CXOs: 14% | APAC: 45% |
| Mid tier: 50% | Functional/Unit leaders: 40% | EMEA: 33% |
| Smaller Players: 22% | Managers: 46% | Americas: 22% |
Market-Sizing & Forecasting
Sizing uses top-down and bottom-up logic in a practical way. The top-down path reconstructs demand from industrial output and capital spending signals, then applies conveyor adoption patterns by facility type, before the totals are translated into value using typical price bands by conveyor type and automation level. After that, the outputs are corroborated with selective bottom-up approximations, such as sampled project values from integrator channels and a check of supplier revenue exposure to conveying. This step helps adjust for undercounting in fragmented buyer groups.
Inputs that mattered for this market included factory automation and warehouse buildout rates, manufacturing PMI direction, mining and bulk commodity throughput activity, airport baggage handling upgrades, and replacement cycles tied to uptime and safety compliance. Average selling price movement was handled by separating simple mechanical conveyors from more automated systems, including controls, drives, and monitoring. We then applied a measured inflation and mix shift rather than a single blanket uplift. For forecasting, scenario analysis was used around industrial investment and logistics expansion, and those scenarios were aligned to what interviewees expected for lead times, project pipelines, and procurement behavior. Where bottom-up visibility was weaker in smaller projects, a coverage factor was applied based on channel feedback and then rechecked against trade and production signals.
Data Validation & Update Cycle
Validation is done through several passes so results do not depend on one assumption. We compare the model output against independent signals such as machinery trade direction, industrial production trends, and the implied spend per automated facility, then investigate outliers before any number is finalized. If a region or end use shows an unusual jump, we recheck the underlying drivers, and when needed, we re-contact respondents to confirm what changed.
Every report is refreshed annually, and interim updates are made when material events occur, such as sharp shifts in industrial investment, supply chain disruptions, or major regulation changes affecting equipment upgrades. Before delivery, a final review pass is completed so clients receive an updated view with the latest available data.
Mordor Intelligence's Conveyors Market Size Versus Other Published Estimates
Published market values for conveyors can vary a lot, even when the topic name looks the same, because the counting rules are not always aligned. Differences usually come from what is included as a conveyor system, what years are used as the base, and how price and mix changes are handled over the forecast.
Key gap drivers in this market are whether the estimate includes only conveyor systems or also folds in broader conveying equipment, parts, and adjacent material handling categories, plus whether installation services are bundled into the number. Currency conversion timing also matters when regions are combined, and so does the refresh cadence when industrial capex trends move quickly. Trade flows, industrial production signals, and interview-based checks on replacement cycles are also not treated the same way across publishers, which changes the implied volume and average selling price math.
Benchmark comparison
| Source | Market Size | Gaps in Research Methodology |
|---|---|---|
| Mordor Intelligence | USD 10.09 B (2026) | |
| Global Research Publisher A | USD 9.66 B (2025) | Uses an earlier base year and can compress the current-year value if recent automation capex and warehouse buildouts are not fully reflected in the base. Scope may also emphasize conveyor systems for industrial automation, which can shift mix assumptions by end use. |
| Industry Publisher B | USD 7.25 B (2025) | May apply a narrower revenue boundary by focusing on core conveyor types and excluding higher-value automation layers like controls and monitoring, and it may use conservative price progression over time, which lowers the reported value. |
The table shows that year selection and scope boundaries explain most of the spread. Trade and production indicators, paired with buyer and channel feedback on project pipelines, are the checks that keep Mordor Intelligence tied to a defined conveyor demand pool and a realistic price mix. Because the steps are traceable to clear signals, the final number stays repeatable even when assumptions are re-tested.


Key Questions Answered in the Report
What is the current value of the conveyor systems market?
The conveyor systems market is worth USD 10.09 billion in 2026.
How fast is the conveyor systems market expected to grow?
It is forecast to register a 4.43% CAGR and reach USD 12.53 billion by 2031.
Which region leads the conveyor systems market?
Asia-Pacific leads with a 37.65% share in 2025 due to manufacturing and logistics investments.
Which segment of the conveyor systems market is growing fastest?
Software and analytics shows the highest growth at a 9.98% CAGR owing to predictive maintenance adoption.
Why are energy-regenerative conveyors gaining traction?
They cut energy use by up to 39% and meet ESG targets, achieving payback in six years for downhill operations.
How do AGVs affect the conveyor systems market?
AGV and AMR solutions provide flexible alternatives, shortening ROI to eight months in warehouses and challenging traditional fixed-line installations.
Page last updated on:


 Your data is secure and never sold or shared.


