Market Overview
| Study Period | 2021 - 2031 |
|---|---|
| Forecast Data Period | 2026 - 2031 |
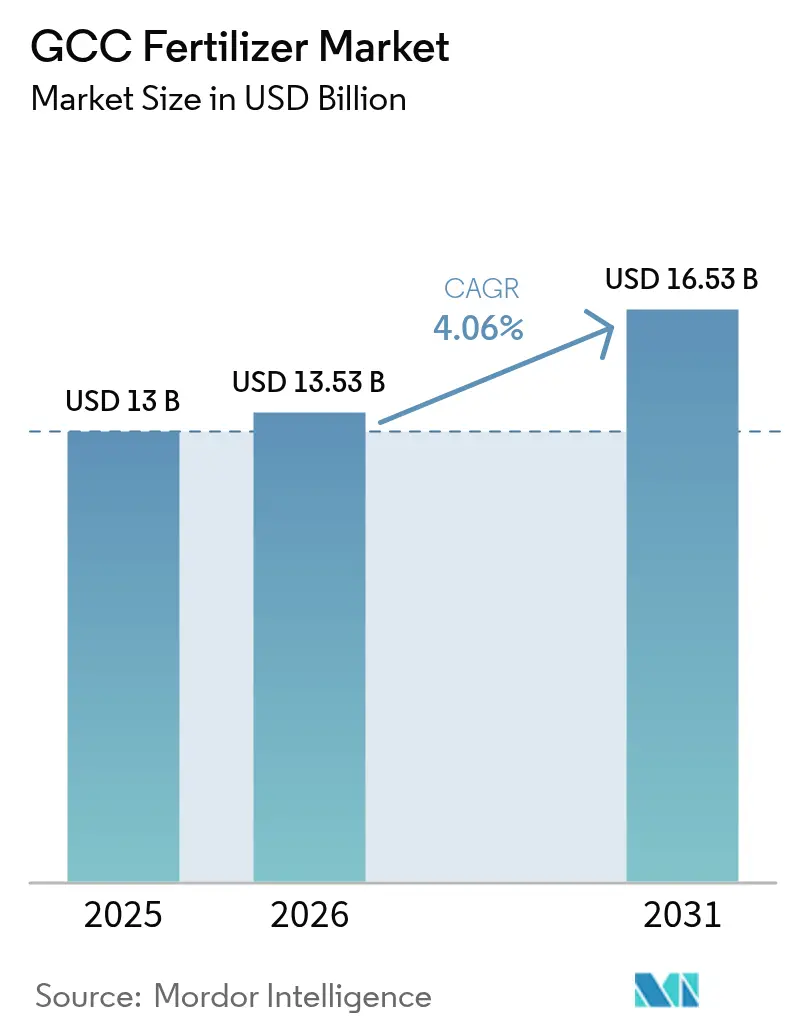
| Base Year Market Size (2025) | USD 13.0 Billion |
| Market Size (2026) | USD 13.53 Billion |
| Market Size (2031) | USD 16.53 Billion |
| Growth Rate (2026 - 2031) | 4.06% CAGR |
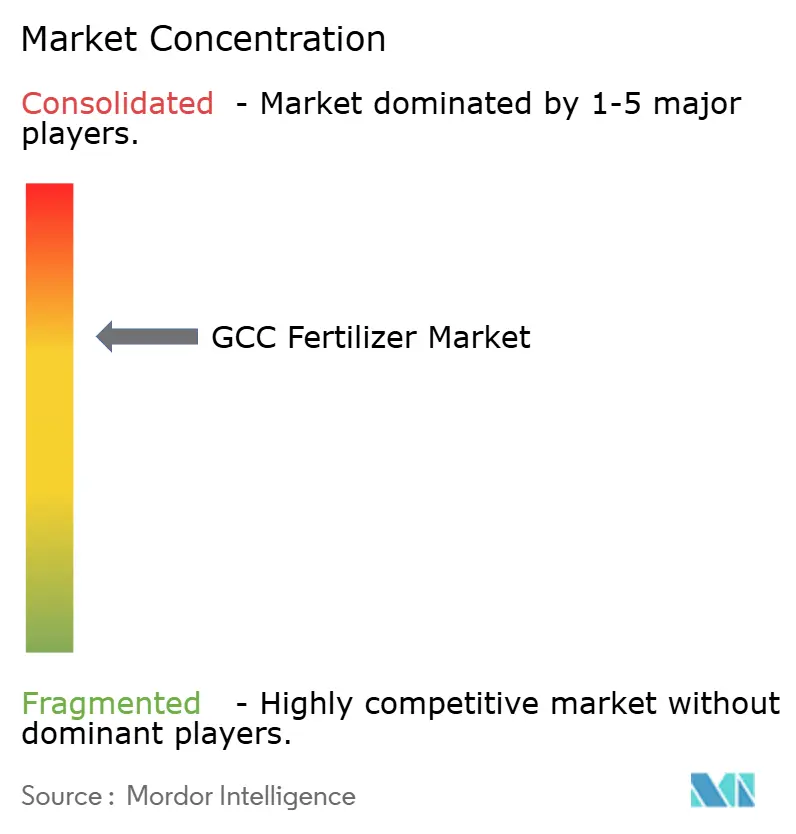
| Market Concentration | Medium |
Major Players *Disclaimer: Major Players sorted in no particular order Image © Mordor Intelligence. Reuse requires attribution under CC BY 4.0. | |
GCC Fertilizer Market Analysis by Mordor Intelligence
The GCC fertilizer market size is expected to grow from USD 13.0 billion in 2025 to USD 13.53 billion in 2026 and is forecast to reach USD 16.53 billion by 2031 at 4.06% CAGR over 2026-2031. The market growth is supported by readily available natural gas feedstock, government-led diversification initiatives, and increasing blue and green ammonia production capacity. Consistent demand from India, Brazil, and Southeast Asia, combined with regional subsidies supporting export-oriented production, maintains market momentum and enables profitable margins for producers. According to the Food and Agriculture Organization Corporate Statistical Database, Oman's vegetable production increased from 10.5 million metric tons in 2022 to 11.1 million metric tons in 2023, driving higher fertilizer demand during the forecast period. Saudi Arabia's integrated operations strengthen the GCC's position as a global fertilizer export hub, Qatar's nitrogen production facilities, and the United Arab Emirates' efficient logistics infrastructure. The market presents long-term opportunities in premium low-carbon products, while facing near-term challenges from feedstock price volatility, port congestion, and stricter environmental regulations that increase operational costs.
Key Report Takeaways
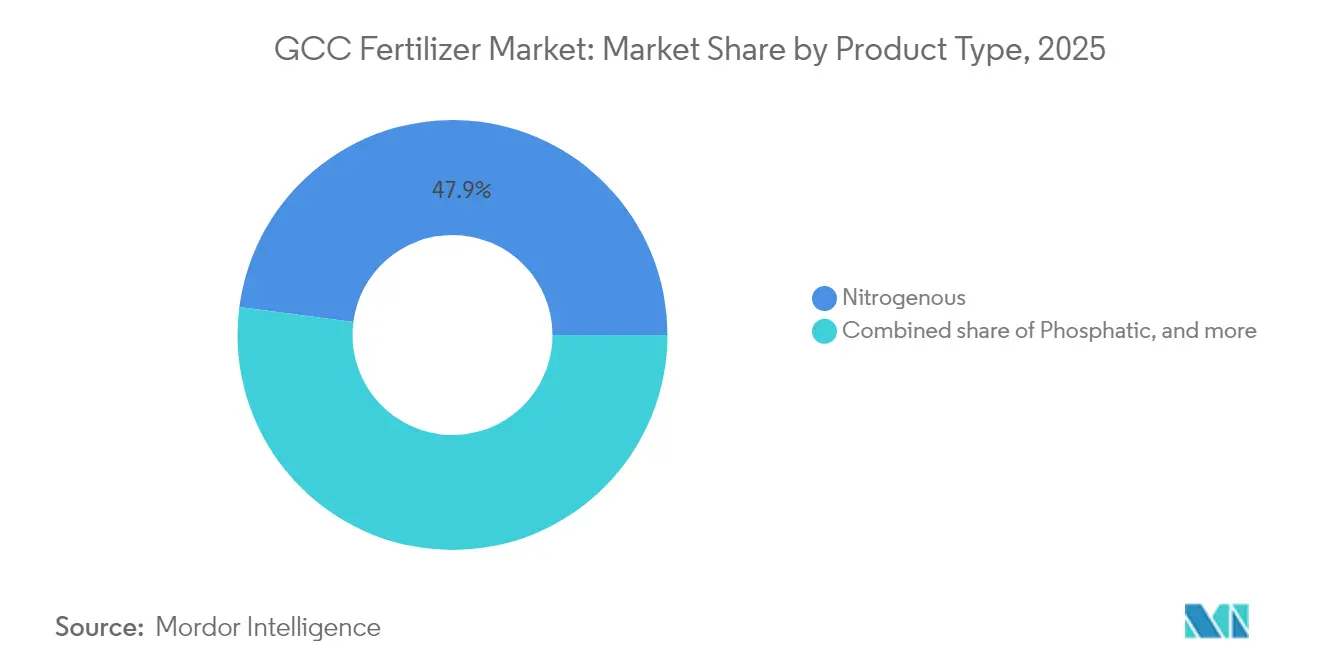
- By product type, nitrogenous fertilizers captured 47.92% of the GCC fertilizer market share in 2025, while micronutrient fertilizers are projected to expand at a 7.78% CAGR through 2031.
- By application, grains and cereals accounted for 42.12% of the GCC fertilizer market size in 2025, while fruits and vegetables are forecast to grow at a 7.46% CAGR to 2031.
- By country, Saudi Arabia accounted for 42.83% of the market share in 2025, while Oman is forecast to grow at a CAGR of 6.08% through 2031.
- Market concentration is moderate, with the top five companies, SABIC Agri-Nutrients (Saudi Basic Industries Corporation), Qatar Fertilizer Company, Saudi Arabian Mining Company – Ma’aden, Gulf Petrochemical Industries Company (B.S.C.), and Oman Indian Fertilizer Company (OMIFCO), collectively holding the majority of the market share in 2024.
Note: Market size and forecast figures in this report are generated using Mordor Intelligence’s proprietary estimation framework, updated with the latest available data and insights as of 2026.
GCC Fertilizer Market Trends and Insights
Drivers Impact Analysis*
| Driver | (~) % Impact on CAGR Forecast | Geographic Relevance | Impact Timeline |
|---|---|---|---|
| Rising global food security pressure | +1.2% | Global, with concentrated demand from India, Brazil, and Southeast Asia | Medium term (2-4 years) |
| Expansion of natural-gas-based ammonia capacity in GCC | +0.8% | Saudi Arabia, the United Arab Emirates, and Qatar are leading regional production | Long term (≥ 4 years) |
| Government subsidies for export-oriented production | +0.6% | Saudi Arabia, United Arab Emirate, and Qatar, with state-backed initiatives | Medium term (2-4 years) |
| Blue/green ammonia export hubs enabling premium pricing | +0.7% | United Arab Emirate and Saudi Arabiaare targeting European and Asian markets | Long term (≥ 4 years) |
| Carbon-capture mandates driving demand for low-carbon urea | +0.5% | Global, with Europe Carbon Border Adjustment Mechanism compliance requirements | Medium term (2-4 years) |
| Digital agronomy platforms boosting localized fertilizer usage | +0.4% | Saudi Arabia and the United Arab Emirates with smart agriculture initiatives | Short term (≤ 2 years) |
| Source: Mordor Intelligence | |||
Rising Global Food Security Pressure
Heightened concerns over food availability keep the GCC fertilizer market tightly linked to the procurement cycles of large importing countries. India’s postponed tenders in early 2024 prompted temporary price softness, but demand rebounded when Brazil booked USD 530.4 million of Qatari urea later in the year, underscoring the region’s importance in stabilizing global grain supplies[1]Source: World Bank, “Urea exports by country 2022,” wits.worldbank.org. Importers rely on consistent GCC output to safeguard wheat, rice, and maize harvests that feed nearly 3 billion people, pushing exporters to maintain robust shipment schedules even during price troughs. Saudi exporters plan to increase urea export volumes between 2019 and 2026 through long-term supply contracts that protect buyers from supply disruptions[2]Source: MDPI, “Saudi Fertilizers and Their Impact on Global Food Security 2023,” mdpi.com. Higher baseline consumption supports healthy utilization rates across regional plants and incentivizes further capacity additions in nitrogen and specialty blends.
Expansion of Natural-Gas-Based Ammonia Capacity in GCC
Low-cost gas remains the competitive bedrock of the GCC fertilizer market. In 2024, SABIC Agri-Nutrients secured feedstock for a 1.2 million metric tons-per-year blue-ammonia project in Jubail, while Ta’ziz in the United Arab Emirates allotted USD 2 billion to build infrastructure capable of exporting 1 million metric tons of low-carbon ammonia by 2027. Qatar’s Qafco-7 unit, set to start in 2026, reinforces the country’s nitrogen leadership through a QR 10.8 billion (USD 2.97 billion) five-year investment plan. Although spot ammonia prices softened to USD 400–420 per metric ton in late 2024, GCC producers with integrated gas supply maintain margin resilience and stand ready to displace higher-cost peers when prices tighten again. Consolidation remains likely because scale and energy efficiency determine long-run survival.
Government Subsidies for Export-Oriented Production
Fiscal incentives remain central to the GCC fertilizer industry. Saudi Arabia’s Vision 2030 channels Agricultural Development Fund capital toward manufacturing infrastructure, aligning fertilizer capacity with a non-oil GDP target of SAR 2.6 trillion (USD 699 billion) by decade-end. Similar industrial support in the UAE, enabled by a USD 536.8 billion economy projected to expand 4.2% in 2024, underwrites feedstock agreements and discounted logistics fees that enhance export competitiveness. Oman directs Vision 2040 funds into biofertilizer research to reduce nutrient import dependence and foster climate-resilient farming. Subsidies ensure that regional plants operate near nameplate capacity even during demand downturns, anchoring the GCC fertilizer market against macro shocks.
Blue and Green Ammonia Export Hubs Enabling Premium Pricing
European and Asian decarbonization mandates raise appetite for verified low-carbon nutrients, and the GCC is moving quickly to supply them. ADNOC’s AED 13.28 billion (USD 3.62 billion) acquisition of OCI’s Fertiglobe stake consolidates control over the world’s largest seaborne platform for urea and ammonia. Mitsui’s joint venture in Al Ruwais will ship 1 million metric tons of clean ammonia annually starting in 2027, leveraging the United Arab Emirates’s emerging 5 million metric tons per year carbon-capture network. Buyers are willing to pay green premia of USD 30–60 per metric ton, offsetting higher capital intensity. The strategic shift positions the GCC fertilizer market to monetize sustainability requirements while preserving its feedstock advantage.
Restraints Impact Analysis*
| Restraint | (~) % Impact on CAGR Forecast | Geographic Relevance | Impact Timeline |
|---|---|---|---|
| Volatility in natural-gas feedstock prices | -0.9% | Saudi Arabia, the United Arab Emirates, and Qatar are gas-dependent production | Short term (≤ 2 years) |
| Stringent global environmental regulations on nitrogen runoff | -0.6% | Global, with Europe CBAM and water quality standards | Medium term (2-4 years) |
| Shipping bottlenecks at Arabian Gulf ports | -0.4% | United Arab Emirates, Saudi Arabia, and Qatar export infrastructure | Short term (≤ 2 years) |
| Accelerating adoption of crop nutrition alternatives | -0.3% | GCC wide, with advanced markets leading adoption | Long term (≥ 4 years) |
| Source: Mordor Intelligence | |||
Volatility in Natural-Gas Feedstock Prices
Despite privileged access to associated gas, regional producers are not immune to global price gyrations that tighten spreads and erode EBITDA. Fertiglobe’s H1 2024 earnings fell as higher gas transfer costs compressed margins, even though revenue topped USD 1 billion. A drop in ammonia spot prices to USD 400 per metric tons forced smaller plants to curtail output, exposing a structural divide between integrated giants and merchant operators. Saudi Aramco’s upstream dominance cushions domestic suppliers, but subsidy outlays escalate when international benchmarks spike. Persistent volatility complicates capital-planning cycles for brownfield debottlenecking across the GCC fertilizer market.
Stringent Global Environmental Regulations on Nitrogen Runoff
Groundwater nitrate readings of up to 380 mg/L in eastern Saudi Arabia spotlight ecological costs tied to excessive nitrogen use. The European directives on nutrient runoff are narrowing acceptable thresholds, and the Emission Trading System now recognizes permanent CO₂ binding criteria that influence fertilizer classifications[3]Source: European Commission, “C(2024)5294 – EN,” europa.eu. Exporters must certify both product and process emissions, pushing operational expenditures higher. The compliance burden risks diverting capex away from incremental capacity and toward mitigation equipment, dampening the long-run growth rate of the GCC fertilizer market.
*Our forecasts treat driver/restraint impacts as directional, not additive. The impact forecasts reflect baseline growth, mix effects, and variable interactions.
Segment Analysis
By Product Type: Nitrogen Leadership and Micronutrient Momentum
Nitrogenous fertilizers captured 47.92% of the GCC fertilizer market share in 2025, underlining feedstock-driven cost leadership and entrenched export corridors into Asia. In contrast, phosphatic volumes grow more modestly as Ma’aden’s USD 921 million Phosphate 3 plant elevates nameplate capacity by 3 million metric tons per year. Potassic imports into Oman, valued at USD 9.63 million, highlight regional supply gaps that encourage intra-GCC trade to balance nutrient portfolios.
Micronutrient fertilizers are projected to expand at an 7.78% CAGR, the fastest among all products, spurred by research that shows zinc-enriched NPK regimes can raise wheat yields in arid soils. Specialty producers utilize digital soil mapping to pinpoint deficiency clusters, enabling targeted blends that command price premiums compared to bulk commodities. Ma’aden, Yara, and private Omani mixers scale chelated-iron and boron products to serve high-value horticulture in the UAE’s greenhouse complexes. Higher gross margins in micronutrients offset smaller tons, reinforcing their strategic importance within the GCC fertilizer market.


By Application: Grains and Cereals Dominate, Fruits and Vegetables Accelerate
Grains and cereals accounted for 42.12% of the GCC fertilizer market share in 2025 as wheat, rice, and maize underpin both domestic food stability and outbound shipments to net-importing countries. Saudi agriculture programs deploy NPK and sulfur-coated urea to lift cereal yields, while Qatar’s hydroponic wheat trials evaluate nutrient-solution recycling to cut application rates. Balanced nutrient practices guard against soil salinity and nitrogen leaching, which remain critical constraints in desert farming.
Fruits and vegetables represent the fastest-growing end use, posting a 7.46% CAGR to 2031 as controlled-environment farms proliferate across Dubai’s Jebel Ali Free Zone and Doha’s peri-urban belt. Precision fertigation systems deliver micronutrient solutions that optimize Brix levels and shelf life, enabling growers to meet premium supermarket specifications. Nano-zinc foliar sprays in the Jizan mango belt improve vitamin C and beta-carotene concentrations under heat stress, illustrating advanced crop-nutrition adoption. Pulse and oilseed rotations widen root-zone biodiversity, reinforcing soil health and sustaining demand for secondary nutrient blends rich in calcium and magnesium.

Geography Analysis
Saudi Arabia commands a 42.83% of the GCC fertilizer market share in 2025, with 2,793 metric tons of urea capacity that generated USD 3.7 billion in exports during 2024, surpassing Iran and Egypt. The country maintains its cost advantage through feedstock integration with Aramco's Master Gas System and an upcoming 1.2 million metric ton blue ammonia project, despite increasing Carbon Border Adjustment Mechanism pressures. Ma'aden's third phosphate production line will increase Saudi output to 9 million metric tons by 2027, establishing its position among the top three global phosphate suppliers.
Oman projects the fastest growth rate at 6.08% CAGR during 2026-2031, utilizing deep-water ports at Sohar and Duqm to export urea to India and Brazil. The country's Vision 2040 research initiatives focus on developing bacterial inoculants adapted to saline soils. Qatar maintains its market position through Industries Qatar, whose QR 10.8 billion (USD 2.9 billion) capital expenditure plan ensures Qafco-7 begins operations in 2026, reinforcing Doha's position as a reliable nitrogen supplier. Kuwait and Bahrain utilize shared export infrastructure to contribute to regional competitiveness while serving specific markets in Africa and South Asia.
The United Arab Emirates serves as the logistics center of the GCC fertilizer market. With 4.2% GDP growth projected for 2024, the country's fiscal position enables state entities to invest in storage, transshipment, and clean-ammonia facilities. ADNOC's expanded presence in Fertiglobe combines upstream gas, midstream terminals, and downstream marketing, ensuring consistent throughput for Jebel Ali and KIZAD port complexes.
Regulatory Landscape
Fertilizer market access across the GCC is shaped by national agricultural-input controls and GCC-wide standard coordination. In Saudi Arabia, the Ministry of Environment, Water and Agriculture (MEWA) enforces the Agricultural Fertilizer Law (Royal Decree M/4, 2002), requiring registration and licensing for imported and locally manufactured fertilizers and soil improvers. In parallel, the Saudi Standards, Metrology and Quality Organization (SASO) manages chemical-import conformity via the SABER platform, which typically requires a Product Certificate of Conformity (PCoC) and Shipment Certificate of Conformity (SCoC) for compliant imports.
In the United Arab Emirates, the Ministry of Climate Change and Environment (MOCCAE), alongside the Emirates Drug Establishment (EDE), governs fertilizer registration and related licensing under Ministerial Decree No. (784) of 2015. This includes documentation such as ISO/IEC 17025-accredited lab analysis and origin authorizations, while registration certificates are issued with defined validity periods (commonly five years) and renewal requirements. At the regional level, the Gulf Standardization Organization (GSO) coordinates standards across member states, but compliance and enforcement remain primarily national, increasing the importance of country-specific registration, labeling, and quality-management processes for producers and traders operating across multiple GCC markets.
Competitive Landscape
The market demonstrates moderate consolidation, with five companies controlling a significant portion of the GCC fertilizer market share in 2024 which include SABIC Agri-Nutrients (Saudi Basic Industries Corporation), Qatar Fertilizer Company, Saudi Arabian Mining Company – Ma'aden, Gulf Petrochemical Industries Company (B.S.C.), and Oman Indian Fertilizer Company (OMIFCO). ADNOC's USD 3.62 billion acquisition of OCI's Fertiglobe stake indicates increased regional consolidation, allowing for unified marketing, coordinated maintenance cycles, and shared R&D in low-carbon technologies. International companies, including Yara International ASA, Nutrien Ltd., and ICL Group Ltd., supplement regional supply through their micronutrient expertise and global distribution networks.
SABIC and Ma'aden implement carbon-capture systems to reduce Scope 1 emissions while maintaining production levels. Fertiglobe aims to achieve USD 100 million in additional EBITDA by 2025 through its Manufacturing Improvement Plan, focusing on predictive-maintenance analytics, similar to Qatar Fertilizer Company's digital initiatives. Yara and ICL increase their investments in biostimulants through acquisitions, preparing for potential changes in synthetic nitrogen demand and expanding their crop nutrition portfolios.
Producers concentrate along the Arabian Gulf coast to access feedstock pipelines and blue-ammonia corridors, while service providers gather in Emirati free zones for specialized storage, blending, and packaging operations. The implementation of the European Carbon Border Adjustment Mechanism and similar regulations makes carbon accounting transparency essential for market access, benefiting producers with established Environmental, Social, and Governance reporting systems.
GCC Fertilizer Industry Leaders
SABIC Agri-Nutrients (Saudi Basic Industries Corporation)
Qatar Fertilizer Company
Saudi Arabian Mining Company – Ma’aden
Gulf Petrochemical Industries Company (B.S.C.)
Oman Indian Fertilizer Company (OMIFCO)
- *Disclaimer: Major Players sorted in no particular order

Market Opportunities and Future Outlook
Large, feedstock-backed capacity approvals in Saudi Arabia and Oman are expanding the project pipeline for conventional nitrogen and integrated phosphate value chains, which in turn tightens the link between GCC supply additions and export corridors into India, Brazil, and Southeast Asia. In March 2026, SABIC Agri-Nutrients received Ministry of Energy approval for feedstock allocation for its 7th plant in Jubail Industrial City, designed to produce 1.2 MMTA of ammonia and 2.6 MMTA of urea. This reinforces the region's scale advantage in urea-led exports and supports demand for port storage, bagging, and trading capabilities around key Gulf logistics nodes.
On the phosphate side, Ma'aden's Ministry of Energy feedstock approval (December 2025) for the Fourth Phosphate Project, targeting 1.1 million tons per year of ammonia and an additional 2.5 million tons per year of phosphate and specialty fertilizers, supports further downstream specialization beyond bulk nutrients. Parallel upstream moves, such as OMIFCO commissioning Nexant (June 2026) for a pre-feasibility study for a third train in Sur, also point to engineering services, debottlenecking, reliability programs, and procurement ecosystems that can shorten project cycles. At the product level, the report's fastest-growing segments (micronutrients and fruits and vegetables applications) align with increasing use of controlled-environment agriculture and precision fertigation in the UAE and Qatar, creating room for localized blending, chelation, and agronomy-advisory platforms that complement the GCC's export-led commodity base while meeting tighter sustainability and documentation requirements in destination markets.
Recent Industry Developments
- March 2026: SABIC Agri-Nutrients received Ministry of Energy approval for feedstock allocation to build its 7th production plant in Jubail Industrial City, designed for 1.2 MMTA of ammonia and 2.6 MMTA of urea. The approval strengthens the near-term project pipeline for conventional nitrogen in Saudi Arabia and supports higher integration across gas-based ammonia to downstream urea exports.
- December 2025: Saudi Arabian Mining Company (Ma'aden) disclosed that it received Ministry of Energy approval for feedstock allocation to develop the Fourth Phosphate Project, targeting 1.1 million tons per year of ammonia and an added 2.5 million tons per year of phosphate and specialty fertilizer production. The move underpins a larger domestic phosphate-and-ammonia complex and raises the competitive bar for specialty phosphate fertilizers supplied from within the GCC.
- June 2024: Mitsui and Co., Ltd. partnered with TA'ZIZ, Fertiglobe, and GS Energy Corporation to advance an ammonia production facility in Al Ruwais, United Arab Emirates. The collaboration supports the build-out of an export-oriented ammonia hub and reinforces the UAE's role as a logistics and marketing platform for seaborne ammonia and downstream nitrogen products.


Research Methodology Framework and Report Scope
Market Definition and Coverage
This market covers the value of fertilizer products consumed in GCC countries, counted at prevailing market prices across the supply chain, and used mainly for crop nutrition and yield improvement in agriculture.
Scope exclusions: We exclude non-fertilizer soil conditioners and standalone crop protection chemicals that are not sold as nutrient products.
Segmentation Overview
- By Product Type
- Nitrogenous
- Urea
- Ammonium Nitrate
- Ammonium Sulfate
- Ammonia
- Calcium Ammonium Nitrate (CAN)
- Other Nitrogenous Fertilizers
- Phosphatic
- Mono-ammonium Phosphate (MAP)
- Di-ammonium Phosphate (DAP)
- Triple Superphosphate (TSP)
- Other Phosphatic Fertilizers
- Potassic
- Muriate of Potash (MOP)
- Sulfate of Potash (SOP)
- Secondary Nutrient Fertilizers
- Micronutrient Fertilizers
- Nitrogenous
- By Application
- Grains and Cereals
- Pulses and Oil Seeds
- Fruits and Vegetables
- Commercial Crops
- Turfs and Ornamentals
- By Country
- Saudi Arabia
- United Arab Emirates
- Qatar
- Oman
- Kuwait
- Bahrain
Data Sources, Market Sizing, and Validation
Desk Research
To set a starting point, we mapped the GCC nutrient demand picture using public data series that are stable year to year. This included FAOSTAT for fertilizer use indicators, UN Comtrade for trade flows, and World Bank and IMF macro series for currency and inflation context. For cropping area and policy signals, we also reviewed agriculture ministries and statistics centers across GCC countries.
We then filled the market model using practical references such as company annual reports, investor presentations, port and customs releases, association websites, and reputable press coverage on capacity additions and supply tightness. Where shipment and financial clues were not clear in public materials, we also used licensed datasets for company financials, patent lookups, and shipment level import-export checks to reduce guesswork. These desk sources are illustrative, and we reviewed many other public documents for data collection, validation, and clarification.
Primary Interviews and Surveys
Primary work was used to confirm how volumes convert into value across product types, and to test pricing and channel assumptions that drive the total market. We spoke with producers, importers, distributors, and large end users, and cross-checked responses across Saudi Arabia, the UAE, Qatar, Oman, and the rest of GCC so that one country did not over-influence the final view.
Distribution of primary research fieldwork respondents
| Company type | Respondent position | Region |
|---|---|---|
| Top tier: 34% | CXOs: 22% | |
| Mid tier: 44% | Functional/Unit leaders: 35% | |
| Smaller Players: 22% | Managers: 43% |
Market-Sizing & Forecasting
Sizing started from a top-down demand pool build, where cropped area by crop group and typical nutrient application intensity were used to reconstruct consumption by nutrient category. That consumption was then converted into value using observed price bands for key products. We checked the result with selective bottom-up approximations, mainly through supplier and importer revenue signals, distributor channel checks, and sampled price times volume calculations for major fertilizer groups.
In the GCC context, inputs we tracked closely included shifts in the cropping mix toward fruits, vegetables, and other commercial crops, import dependency versus local production by nutrient type, seasonal buying tied to planting cycles, movements in key feedstocks and international benchmark prices, and currency timing for converting import values into USD. If a data point was missing for a smaller GCC country or a thinner product line, we used proxy indicators such as trade volumes, cultivated area, and expert-validated price ranges, then reviewed the impact before accepting it.
For forecasting, we ran scenario analysis so pricing and volume could move separately under realistic conditions. The selected scenario was then aligned to what industry participants expect for demand, supply additions, and policy support. The final forecast also remained consistent with observable signals, including trade direction, crop area trends, and announced production or logistics changes.
Data Validation & Update Cycle
We validated outputs through repeated cross-checks between value, volume, and price logic, then ran variance testing across countries and product types to catch outliers. When the model showed sudden jumps, we rechecked the input series and revisited assumptions with primary respondents to confirm the direction reflected market events rather than model noise.
Before sign-off, the work follows a multi-step analyst review to keep definitions, conversions, and calculations consistent. The report is refreshed annually, and interim updates are made when material events occur, such as policy shifts, large capacity changes, or major price disruptions. A final pass is completed before delivery so the view reflects the most recent updates.
Mordor Intelligence's Fertilizer Market Gcc Market Estimate Compared With Other Published Estimates
Published numbers for this market do not always match because each publisher draws the scope line differently and uses different price references, time windows, and country coverage rules. Differences can also come from how imports are treated, whether the model is consumption-based or production-based, and how inflation and FX are handled when converting figures to USD.
The table shows a noticeable spread even for nearby years, and in Mordor Intelligence's model the value is tied to GCC consumption across fertilizer product types and crop applications, with pricing aligned to the study year rather than a multi-year average that can smooth out peaks and dips.
Benchmark comparison
| Source | Market Size | Gaps in Research Methodology |
|---|---|---|
| Mordor Intelligence | USD 13.0 B (2025) | |
| Regional Consultancy A | USD 13.5 B (2025) | Uses a broader channel value assumption and mixes form-based categories that can double count blended products when they move through multiple trade layers. |
| Global Publisher B | USD 18.82 B (2024) | Anchors the value on a different base year and applies higher average pricing and wider included scope, which can pull in adjacent agrifood inputs beyond core nutrient fertilizers. |
Looking across the three figures, the gap is best explained by the pricing basis and what is counted as in-scope revenue, rather than a single demand driver. By keeping the sizing steps traceable to cropped area, application intensity, trade signals, and realistic price bands, the final number stays repeatable and easier to audit when assumptions are updated.


Key Questions Answered in the Report
What is the 2026 valuation of the GCC fertilizer market?
The GCC fertilizer market size stands at USD 13.53 billion in 2026 with a projected value of USD 16.53 billion by 2031.
Which product segment leads regional sales?
Nitrogenous fertilizers, primarily urea, hold 47.92% of sales, driven by low-cost gas feedstock and entrenched export routes.
Which application is expanding the fastest?
Fertilizer use in fruits and vegetables shows the highest growth, advancing at a 7.46% CAGR through 2031 due to controlled-environment agriculture expansion.
How are GCC producers addressing carbon regulations?
Companies are investing in blue and green ammonia plants coupled with carbon-capture units to align with EU CBAM and similar policies.
Which country is the largest exporter within the bloc?
Saudi Arabia leads with 2,793 metric tons of urea exports, generating USD 3.7 billion in 2024 and additional capacity in the pipeline.
Page last updated on:


