Market Overview
| Study Period | 2021 - 2031 |
|---|---|
| Forecast Data Period | 2026 - 2031 |
| Historical Data Period | 2021 - 2024 |
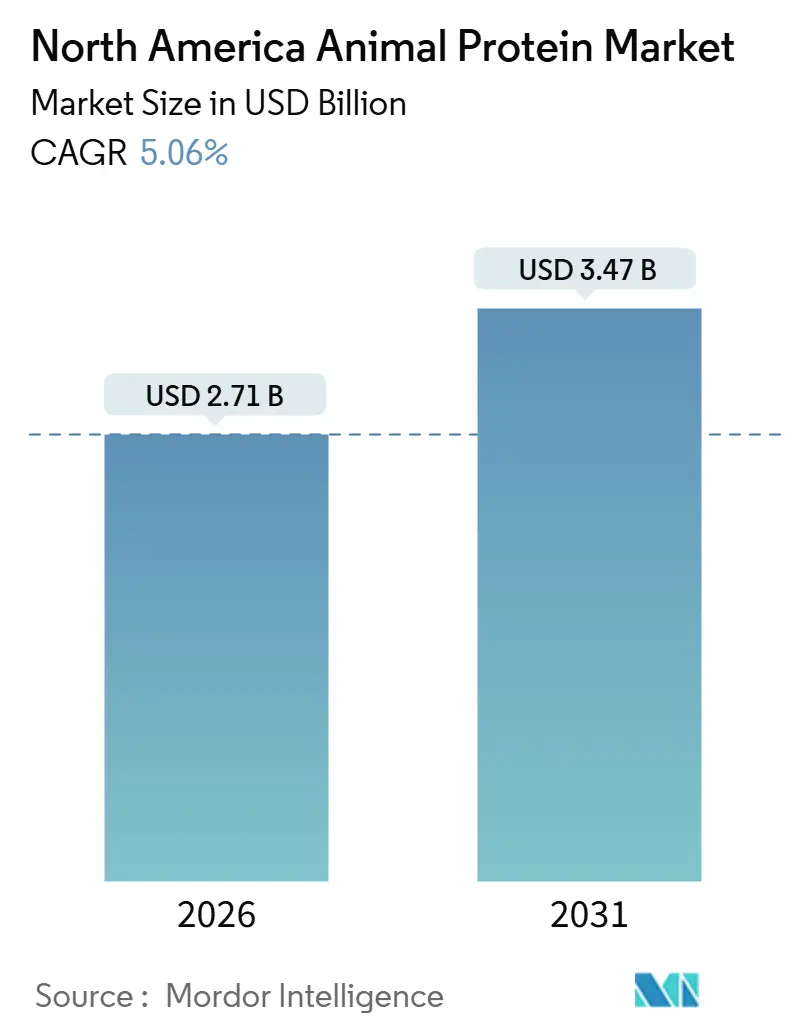
| Market Size (2026) | USD 2.71 Billion |
| Market Size (2031) | USD 3.47 Billion |
| Growth Rate (2026 - 2031) | 5.06% CAGR |
| Market Concentration | Medium |
Major Players
*Disclaimer: Major Players sorted in no particular order Image © Mordor Intelligence. Reuse requires attribution under CC BY 4.0. |
|
North America Animal Protein Market Analysis by Mordor Intelligence
The North American animal protein market is projected to grow from USD 2.71 billion in 2026 to USD 3.47 billion by 2031, registering a CAGR of 5.06%. This growth reflects a transition from volume-driven expansion to a focus on efficiency, functionality, and value creation. The market's progress is driven by advancements in farming and processing practices, an increasing emphasis on high-quality and bioavailable protein, and ongoing innovation in protein refinement and enhancement technologies. Additionally, the industry is adapting to stricter regulatory requirements, environmental accountability, and biosecurity standards, leading to a greater emphasis on sustainable production models and resilient supply chains. The rising role of animal protein in fitness-oriented nutrition, preventive health, and functional wellness further supports the market's growth by strengthening baseline demand.
Key Report Takeaways
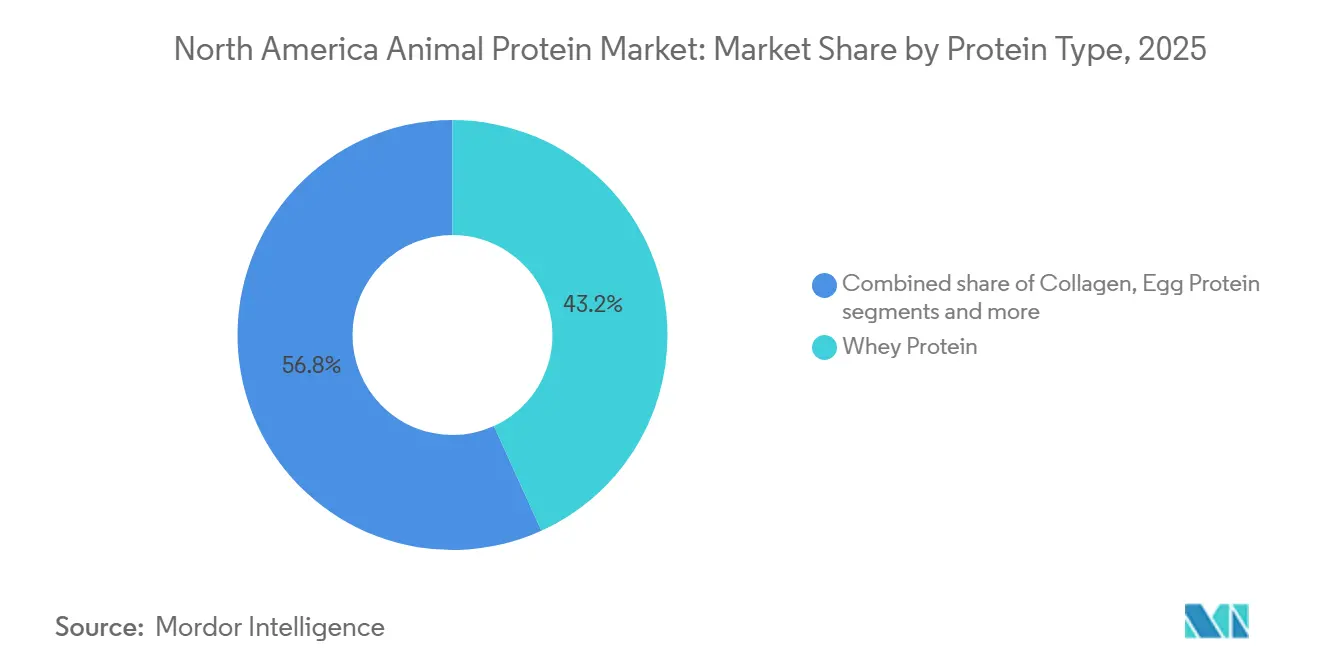
- By protein type, whey protein led with 43.21% revenue share in 2025, while collagen is projected to post the fastest 6.31% CAGR through 2031.
- By category, conventional formats captured 75.62% of the North American animal protein market share in 2025, whereas organic variants are expected to expand at a 5.76% CAGR to 2031.
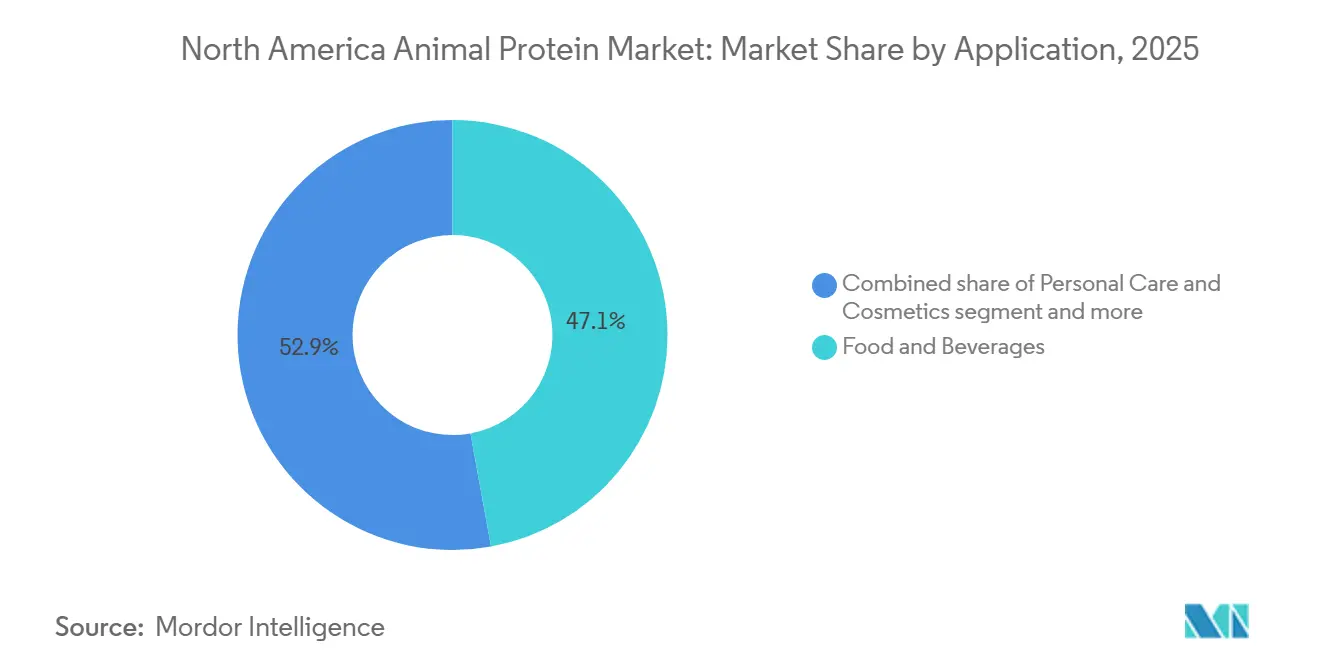
- By application, food and beverages held 47.13% of the North America animal protein market size in 2025, and personal care and cosmetics are advancing at a 6.58% CAGR through 2031.
- By geography, the United States accounted for 79.65% of revenue in 2025, while Mexico is set to grow at a 5.89% CAGR between 2026 and 2031.
Note: Market size and forecast figures in this report are generated using Mordor Intelligence’s proprietary estimation framework, updated with the latest available data and insights as of January 2026.
North America Animal Protein Market Trends and Insights
Drivers Impact Analysis*
| Driver | (~) % Impact on CAGR Forecast | Geographic Relevance | Impact Timeline |
|---|---|---|---|
| Growing fitness culture driving protein demand | +1.4% | United States, Canada, with spillover to urban Mexico | Medium term (2-4 years) |
| Improvements in farming techniques is driving the market | +1.1% | United States dairy belt, Canadian prairies, northern Mexico | Long term (≥ 4 years) |
| Product innovation is supporting the market growth | +1.3% | North America-wide, concentrated in Research and Development hubs | Short term (≤ 2 years) |
| Expansion of value-added and processed protein products | +1.0% | United States, Canada, emerging in Mexico's premium retail channels | Medium term (2-4 years) |
| Rising focus on functional and fortified animal protein products | +0.9% | United States, Canada, with early adoption in health-conscious urban markets | Medium term (2-4 years) |
| Shift toward premium and specialty protein segments | +0.8% | United States coastal markets, Canadian urban centers | Medium term (2-4 years) |
| Source: Mordor Intelligence | |||
Growing fitness culture driving protein demand
The strong culture of sports, fitness, and active lifestyles serves as a key demand driver for the North America animal protein market, supporting sustained and varied protein consumption across the region. According to the Health & Fitness Association, approximately 77 million Americans utilized fitness facilities in 2024, highlighting the widespread adoption of fitness-oriented lifestyles in the United States [1]Source: Health & Fitness Association, "2025 US Health & Fitness Consumer Report" healthandfitness.org. This extensive participation has significantly heightened awareness of protein intake as a critical nutritional component for muscle development, strength maintenance, recovery, and overall physical performance. As fitness engagement expands beyond professional athletes to include recreational gym-goers, endurance enthusiasts, and aging individuals focused on mobility and strength retention, animal protein continues to be recognized as a highly effective, complete, and bioavailable protein source. Its ability to cater to diverse nutritional requirements across various demographic groups further reinforces its importance in supporting active and health-conscious lifestyles.
Improvements in farming techniques is driving the market
Advancements in farming techniques are significantly driving growth in the North American animal protein market by improving productivity, resilience, and sustainability in livestock systems. Developments in precision agriculture, regenerative farming practices, enhanced feed efficiency, and data-driven farm management are enabling producers to achieve higher yields while minimizing environmental impact and reducing input inefficiencies. Robust institutional support is accelerating this transformation. For instance, the United States Department of Agriculture (USDA) launched a USD 700 million Regenerative Pilot Program in December 2025 to assist American farmers in adopting practices that improve soil health, enhance water quality, and boost long-term productivity [2]Source: United States Department of Agriculture (USDA), "USDA Launches New Regenerative Pilot Program to Lower Farmer Production Costs and Advance MAHA Agenda", usda.gov. These initiatives provide direct benefits to livestock producers by improving forage quality, stabilizing feed supply, and strengthening ecosystem resilience, which collectively enhance animal health and ensure consistent protein output.
Product Innovation is supporting the market growth
Advancements in processing and fractionation technologies are significantly transforming protein functionality and value creation. The development of enzyme-hydrolyzed protein formats enables manufacturers to offer proteins with enhanced solubility, lower molecular weight, reduced allergenicity, and faster digestion profiles. These innovations cater to consumers with sensitive gastrointestinal systems and increased absorption needs. Additionally, these formats provide greater formulation flexibility and consistent performance, reinforcing the role of animal proteins as high-functionality ingredients rather than basic commodities. Simultaneously, manufacturers are investing in advanced membrane-filtration and separation technologies to isolate specific peptide fractions with targeted bioactive properties. Examples include collagen tripeptides, which support joint and connective tissue health, and casein phosphopeptides, which improve mineral absorption and bioavailability.
Expansion of value-added and processed protein products
The growth of value-added and processed protein products is a key factor driving the animal protein market. This trend highlights the industry's transition from bulk commodity proteins to higher-margin, functionality-focused offerings. Manufacturers are increasingly processing, refining, fortifying, and customizing animal proteins to enhance attributes such as texture, stability, digestibility, and nutritional density. These advancements enable protein suppliers to provide consistent performance, extended shelf life, and improved handling characteristics, which are essential for large-scale production environments. Value addition further supports differentiation through methods like protein concentration, hydrolysis, blending, and functional enhancement, transforming animal proteins into specialized ingredients rather than generic raw materials. The development of processed protein formats contributes to market growth by enabling new applications, improving supply chain efficiency, and supporting premium product positioning.
Restraints Impact Analysis*
| Restraint | (~) % Impact on CAGR Forecast | Geographic Relevance | Impact Timeline |
|---|---|---|---|
| Animal disease outbreaks and biosecurity risks | -0.9% | United States poultry belt, dairy regions; sporadic in Canada and Mexico | Short term (≤ 2 years) |
| Regulatory limitations on antibiotic usage | -0.6% | United States, Canada, with FDA and Health Canada oversight | Medium term (2-4 years) |
| Stringent environmental compliance requirements | -0.5% | United States (California, Northeast), Canada (Ontario, Quebec) | Long term (≥ 4 years) |
| Volatility in feed ingredient quality and availability | -0.7% | Corn Belt states, Canadian prairies, northern Mexico | Short term (≤ 2 years) |
| Source: Mordor Intelligence | |||
Animal disease outbreaks and biosecurity risks
Animal disease outbreaks and biosecurity risks pose significant challenges to the North American animal protein market, creating structural volatility in production, supply chains, and trade flows. The 2024–2025 H5N1 avian influenza outbreak underscored the region's vulnerability to highly pathogenic animal diseases. Measures such as large-scale culling, movement restrictions, and emergency containment efforts disrupted poultry production cycles, reduced raw material availability, and heightened operational uncertainty throughout the protein value chain. In addition to immediate supply disruptions, the outbreak led to increased regulatory scrutiny, stricter surveillance requirements, and higher compliance costs, adding pressure on producers and processors. These biosecurity risks hinder market growth by destabilizing production, delaying capacity utilization, and raising risk premiums for animal protein operations. Furthermore, disease outbreaks compromise export reliability, as trading partners enforce temporary bans or stricter inspection protocols, exacerbating market uncertainty. In response, producers are required to adapt to these evolving challenges.
Regulatory limitations on antibiotic usage
Regulatory restrictions on antibiotic usage pose a significant challenge to the North America animal protein market, altering livestock management practices and increasing operational complexities across the value chain. Stricter regulations limiting the use of antibiotics for growth promotion and preventive purposes have compelled producers to adopt alternative health management strategies, including enhanced biosecurity measures, vaccination programs, and specialized feed additives. While these approaches contribute to improved long-term animal health outcomes, they often result in higher costs, extended adjustment periods, and elevated production risks, particularly during disease-prone cycles. These regulatory limitations can lead to increased morbidity rates, reduced feed efficiency, and slower growth performance, especially in intensive farming systems that have traditionally relied on antibiotics to maintain consistency and scale.
*Our forecasts treat driver/restraint impacts as directional, not additive. The impact forecasts reflect baseline growth, mix effects, and variable interactions.
Segment Analysis
By Protein Type: Collagen Outpaces Traditional Dairy Formats
Whey protein accounted for a 43.21% share of the North America animal protein market in 2025 and continues to dominate due to its nutritional benefits, versatility, and strong demand across various end-use industries. It is widely recognized for its complete amino acid profile, high biological value, and rapid digestibility, making it a preferred protein source for sports nutrition, active lifestyle consumers, and clinical nutrition applications. Its association with muscle protein synthesis, recovery, and satiety has driven consistent demand from athletes, aging populations focused on muscle maintenance, and weight-management consumers. Additionally, the increasing adoption of whey protein in functional food and beverage formulations further strengthens its market position.
Collagen protein, projected to grow at a robust 6.31% CAGR through 2031, is emerging as the fastest-growing protein type in the North America animal protein market. Collagen is increasingly valued for its role in improving skin elasticity, joint mobility, bone strength, and connective tissue health, making it particularly appealing to aging consumers, women, and wellness-focused individuals. Its high bioavailability in hydrolyzed form, neutral taste profile, and ease of formulation enable its seamless incorporation into functional foods, beverages, soups, coffees, and snack products, expanding its consumer base beyond traditional supplement users. Furthermore, the rising trend of clean-label and natural ingredients in food products has amplified the demand for collagen protein, as it aligns with consumer preferences for health and wellness.


By Category: Organic Gains Share Despite Price Premium
Conventional animal protein is projected to hold a dominant 75.62% share of the North American animal protein market in 2025, underscoring its established role in mainstream food manufacturing. This dominance is driven by structural scale, operational efficiency, and extensive value-chain integration. Conventional protein systems benefit from standardized production practices, advanced livestock genetics, optimized feed regimes, and well-developed processing infrastructure. These factors collectively ensure consistent quality, high-volume output, and reliable performance. Additionally, this category benefits from strong regulatory familiarity and long-standing industry acceptance, reducing compliance uncertainties and enabling manufacturers to operate at scale with minimal formulation or sourcing risks.
Organic animal protein, with a projected CAGR of 5.76%, reflects a structural shift in the North America animal protein market, driven by evolving production philosophies, sourcing standards, and value-chain alignment. The segment's growth is primarily fueled by increasing consumer and retailer demands for transparency, traceability, and input integrity. Organic protein is positioned as a differentiated category, emphasizing certified feed inputs, controlled antibiotic usage, and audited farming practices. These practices enhance consumer trust and support long-term brand credibility. Advances in organic livestock management, feed optimization, and certification harmonization are gradually addressing supply inconsistencies, enabling broader commercial scalability.
By Application: Personal Care Emerges as Growth Engine
Food and beverages accounted for 47.13% of the North America animal protein market in 2025, representing the largest and most structurally dominant application segment. This dominance is driven by the central role of animal protein in everyday diets and industrial food systems. The integration of animal proteins into core food manufacturing value chains highlights their importance as essential nutritional, structural, and functional inputs. Food and beverage manufacturers depend on animal proteins for their high bioavailability, complete amino acid profile, and consistent performance, ensuring reliable product quality in large-scale production. Additionally, the growing demand for high-protein diets and the increasing popularity of protein-enriched food products further bolster the significance of this segment.
The personal care and cosmetics segment is projected to expand at a strong CAGR of 6.58% through 2031, making it one of the fastest-growing application segments within the North America animal protein market. This growth is driven by the increasing convergence of beauty, wellness, and bio-functional ingredients. Animal-derived proteins are valued for their film-forming, moisturizing, strengthening, and anti-aging properties, which enhance product performance and sensory appeal. Innovations in protein hydrolysis and purification technologies have further supported this growth by enabling the development of high-purity, bioavailable protein ingredients. These advancements make it easier to incorporate such proteins into modern cosmetic formulations while maintaining stability and efficacy. Furthermore, the rising consumer preference for natural and functional ingredients in personal care products is accelerating the adoption of animal-derived proteins in this segment.
Geography Analysis
The United States, holding a 79.65% market share in 2025, remains the dominant player in the North American animal protein market, supported by its extensive dairy processing infrastructure. States such as Wisconsin, California, and New York host advanced whey and casein production facilities that meet significant domestic demand while also driving a strong export presence. According to the Observatory of Economic Complexity (OEC), between September 2025 and October 2025, the United States' whey exports increased from USD 50.8 million to USD 59.1 million, highlighting sustained international demand and reinforcing the country's position as a key exporter of whey protein products [3]Source: Observatory of Economic Complexity (OEC), "Whey in United States Trade" oec.world. The country's leadership in this market is further bolstered by its ability to innovate in dairy processing technologies and maintain stringent quality standards, ensuring its competitive edge in both domestic and international markets.
Mexico, projected to achieve a 5.89% compound annual growth rate (CAGR) through 2031, is emerging as the region's growth leader due to rapid urbanization and changing dietary preferences. The expanding middle-income population is increasingly adopting higher-protein diets, driving a shift in consumption patterns toward greater animal protein intake. Enhanced logistics, rising investments in food manufacturing, and improved availability of protein ingredients are further strengthening Mexico's role in the regional market, positioning it as one of the fastest-growing markets in North America. Additionally, government initiatives aimed at improving food security and promoting domestic production are expected to support the market's growth trajectory in the coming years.
Canada maintains a stable but slower growth trajectory in the North American animal protein market. Its dairy sector operates under a supply management system that uses production quotas, administered pricing, and import controls to balance domestic supply with demand and stabilize farm economics. While this system ensures consistent quality and minimizes production volatility, it also limits expansion capacity and reduces export competitiveness compared to the United States market. However, Canada's focus on sustainable farming practices and its reputation for high-quality dairy products continue to provide opportunities for niche market growth and premium product positioning.

Competitive Landscape
The North American animal protein market demonstrates moderate concentration, marked by the presence of vertically integrated incumbents, innovation-driven global specialists, and emerging disruptors. Large dairy cooperatives, such as Dairy Farmers of America and Agropur, dominate the market through comprehensive control over milk procurement, processing, and ingredient commercialization. This vertical integration allows these players to capture margins across multiple stages of the value chain, ensure consistent raw material quality, and maintain reliable supply at scale. Their structural advantages, including farmer ownership, long-term sourcing contracts, and processing scale, create significant entry barriers and reinforce their leadership in key animal protein segments.
In addition to cooperatives, global ingredient specialists like Kerry Group and Glanbia compete by focusing on innovation-led differentiation rather than volume dominance. These companies utilize advanced Research and Development (R&D) capabilities to create proprietary protein formats, such as clear whey isolates, enzyme-modified caseins, and tailored peptide systems. These innovations aim to enhance functionality, digestibility, and formulation performance. Competitive advantage in this segment increasingly depends on technology adoption, with leading players investing in membrane-filtration cascades, next-generation spray-drying systems, and real-time quality analytics. These technologies improve yield efficiency, product consistency, and cost control, signaling a shift from commodity protein supply to high-specification, value-added protein solutions.
Smaller and emerging players are establishing positions in underserved and technically complex niches, such as insect protein and marine collagen. These segments are often overlooked by incumbents due to regulatory uncertainties, supply chain fragmentation, and higher commercialization risks. However, they present first-mover advantages for agile entrants willing to invest in pilot-scale production, sourcing innovation, and consumer education. As sustainability narratives, functional nutrition, and alternative sourcing gain prominence, these disruptors are reshaping competitive dynamics at the periphery of the market.
North America Animal Protein Industry Leaders
-
Agropur Dairy Cooperative
-
Arla Foods amba
-
Glanbia PLC
-
Groupe Lactalis S.A.
-
Kerry Group PLC
- *Disclaimer: Major Players sorted in no particular order

Recent Industry Developments
- December 2025: FrieslandCampina has completed its acquisition of United States-based Wisconsin Whey Protein to enhance its B2B ingredients portfolio and strengthen its presence in the North American market.
- March 2025: Vivici has introduced ViviteinTM BLG to the United States market. ViviteinTM BLG is a dairy protein (beta-lactoglobulin) produced through precision fermentation, without the involvement of animals in the production process.
- November 2024: Arla Foods Ingredients has introduced a new whey protein hydrolysate designed to offer an improved taste profile compared to similar ingredients used in peptide-based medical nutrition.


North America Animal Protein Market Report Scope
Animal protein refers to proteins obtained from natural sources, including meat, eggs, milk, fish, and insects, which are widely used in various industries. The North American animal protein market is segmented based on the protein type, category, application, and geography. Based on protein type, the market is segmented into casein and caseinates, collagen, egg protein, gelatin, insect protein, milk protein, whey protein, and other animal protein. Based on category, the market is segmented into conventional and organic. Based on the application, the market is segmented into animal feed, personal care and cosmetics, food and beverages, and supplements. The food and beverages segment is further segmented into bakery, beverages, breakfast cereals, condiments/sauces, confectionery, dairy and dairy alternative products, RTE/RTC food products, and others. Based on geography, the market is segmented into the United States, Canada, Mexico, and the rest of North America. The report provides market size and forecasts in both value (USD) and volume (tons) for all the mentioned segments.
By Protein Type
| Casein and Caseinates |
| Collagen |
| Egg Protein |
| Gelatin |
| Insect Protein |
| Milk Protein |
| Whey Protein |
| Other Animal Protein |
By Category
| Conventional |
| Organic |
By Application
| Animal Feed | |
| Personal Care and Cosmetics | |
| Food and Beverages | Bakery |
| Beverages | |
| Breakfast Cereals | |
| Condiments/Sauces | |
| Confectionery | |
| Dairy and Dairy Alternatives Products | |
| RTE/RTC Food Products | |
| Others | |
| Supplements |
By Geography
| United States |
| Canada |
| Mexico |
| Rest of North America |
| By Protein Type | Casein and Caseinates | |
| Collagen | ||
| Egg Protein | ||
| Gelatin | ||
| Insect Protein | ||
| Milk Protein | ||
| Whey Protein | ||
| Other Animal Protein | ||
| By Category | Conventional | |
| Organic | ||
| By Application | Animal Feed | |
| Personal Care and Cosmetics | ||
| Food and Beverages | Bakery | |
| Beverages | ||
| Breakfast Cereals | ||
| Condiments/Sauces | ||
| Confectionery | ||
| Dairy and Dairy Alternatives Products | ||
| RTE/RTC Food Products | ||
| Others | ||
| Supplements | ||
| By Geography | United States | |
| Canada | ||
| Mexico | ||
| Rest of North America | ||


Market Definition
- End User - The Protein Ingredients Market operates on a B2B basis. Food, Beverages, Supplements, Animal Feed, and Personal Care & Cosmetic manufacturers are considered to be end-consumers in the market studied. The scope excludes manufacturers buying liquid/dry whey to be used for application as a binding agent or thickener or other non-protein applications.
- Penetration Rate - Penetration Rate is defined as the percentage of Protein-Fortified End User Market Volume in the Overall End User Market Volume.
- Average Protein Content - Average protein content is the average protein content present per 100 g of product manufactured by all end-user companies considered under the scope of this report.
- End User Market Volume - End-user market volume is the consolidated volume of all types and forms of end-user products in the country or region.
| Keyword | Definition |
|---|---|
| Alpha-lactalbumin (α-Lactalbumin) | It is a protein that regulates the production of lactose in the milk of almost all mammalian species. |
| Amino acid | It is an organic compound that contains both amino and carboxylic acid functional groups, which are required for the synthesis of body protein and other important nitrogen-containing compounds, such as creatine, peptide hormones, and some neurotransmitters. |
| Blanching | It is the process of briefly heating vegetables with steam or boiling water. |
| BRC | British Retail Consortium |
| Bread improver | It is a flour-based blend of several components with specific functional properties designed to modify dough characteristics and give quality attributes to bread. |
| BSF | Black Soldier Fly |
| Caseinate | It is a substance produced by adding an alkali to acid casein, a derivative of casein. |
| Celiac disease | Celiac disease is an immune reaction to eating gluten, a protein found in wheat, barley, and rye. |
| Colostrum | It is a milky fluid that’s released by mammals that have recently given birth before breast milk production begins. |
| Concentrate | It is the least processed form of protein and has a protein content ranging from 40-90% by weight. |
| Dry protein basis | It refers to the percentage of "pure protein" present in a supplement after the water in it is completely removed through heat. |
| Dry whey | It is the product resulting from drying fresh whey which has been pasteurized and to which nothing has been added as a preservative. |
| Egg protein | It is a mixture of individual proteins, including ovalbumin, ovomucoid, ovoglobulin, conalbumin, vitellin, and vitellenin. |
| Emulsifier | It is a food additive that facilitates the blending of foods that are immiscible with one another, such as oil and water. |
| Enrichment | It is the process of addition of micronutrients that are lost during the processing of the product. |
| ERS | Economic Research Service of the USDA |
| Extrusion | It is the process of forcing soft mixed ingredients through an opening in a perforated plate or die designed to produce the required shape. The extruded food is then cut to a specific size by blades. |
| Fava | Also known as Faba, it is another word for yellow split beans. |
| FDA | Food and Drug Administration |
| Flaking | It is a process in which typically a cereal grain (like corn, wheat, or rice) is broken down into grits, cooked with flavors and syrups, and then pressed into flakes between cooled rollers. |
| Foaming agent | It is a food ingredient that makes it possible to form or maintain a uniform dispersion of a gaseous phase in a liquid or solid food. |
| Foodservice | It refers to the part of the food industry which includes businesses, institutions, and companies which prepare meals outside the home. It includes restaurants, school and hospital cafeterias, catering operations, and many other formats. |
| Fortification | It is the deliberate addition of micronutrients that are not found in them naturally or which are lost during processing, to improve a food product's nutritional value. |
| FSANZ | Food Standards Australia New Zealand |
| FSIS | Food Safety and Inspection Service |
| FSSAI | Food Safety and Standards Authority of India |
| Gelling agent | It is an ingredient that functions as a stabilizer and thickener to provide thickening without stiffness through the formation of gel. |
| GHG | Greenhouse Gas |
| Gluten | It is a family of proteins found in grains, including wheat, rye, spelt, and barley. |
| Hemp | It is a botanical class of Cannabis sativa cultivars grown specifically for industrial or medicinal use. |
| Hydrolysate | It is a form of protein manufactured by exposing the protein to enzymes that can partially break the bonds between the protein's amino acids and break down large, complicated proteins into smaller pieces. Its processing makes it easier and quicker to digest. |
| Hypoallergenic | It refers to a substance that causes fewer allergic reactions. |
| Isolate | It is the purest and most processed form of protein which has undergone separation to obtain a pure protein fraction. It typically contains ≥ 90% of protein by weight. |
| Keratin | It is a protein that helps form hair, nails, and the outer layer of skin. |
| Lactalbumin | It is the albumin contained in milk and obtained from whey. |
| Lactoferrin | It is an iron‑binding glycoprotein that is present in the milk of most mammals. |
| Lupin | It is the yellow legume seeds of the genus Lupinus. |
| Millenial | Also known as Generation Y or Gen Y, it refers to the people born from 1981 to 1996. |
| Monogastric | It refers to an animal with a single-compartmented stomach. Examples of monogastric include humans, poultry, pigs, horses, rabbits, dogs, and cats. Most monogastric are generally unable to digest much cellulose food materials such as grasses. |
| MPC | Milk protein concentrate |
| MPI | Milk protein isolate |
| MSPI | Methylated soy protein isolate |
| Mycoprotein | Mycoprotein is a form of single-cell protein, also known as fungal protein, derived from fungi for human consumption. |
| Nutricosmetics | It is a category of products and ingredients that act as nutritional supplements to care for skin, nails, and hair natural beauty. |
| Osteoporosis | It is a medical condition in which the bones become brittle and fragile from loss of tissue, typically as a result of hormonal changes, or deficiency of calcium or vitamin D. |
| PDCAAS | Protein digestibility-corrected amino acid score (PDCAAS) is a method of evaluating the quality of a protein based on both the amino acid requirements of humans and their ability to digest it. |
| Per-capita consumption of animal protein | It is the average amount of animal protein (such as milk, whey, gelatin, collagen, and egg proteins) that is readily available for consumption by each person in an actual population. |
| Per-capita consumption of plant protein | It is the average amount of plant protein (such as soy, wheat, pea, oat, and hemp proteins) that is readily available for consumption by each person in an actual population. |
| Quorn | It is a microbial protein manufactured using mycoprotein as an ingredient, in which the fungus culture is dried and mixed with egg albumen or potato protein, which acts as a binder, and then is adjusted in texture and pressed into various forms. |
| Ready-to-Cook (RTC) | It refers to food products that include all of the ingredients, where some preparation or cooking is required through a process that is given on the package. |
| Ready-to-Eat (RTE) | It refers to a food product prepared or cooked in advance, with no further cooking or preparation required before being eaten. |
| RTD | Ready-to-Drink |
| RTS | Ready-to-Serve |
| Saturated fat | It is a type of fat in which the fatty acid chains have all single bonds. It is generally considered unhealthy. |
| Sausage | It is a meat product made of finely chopped and seasoned meat, which may be fresh, smoked, or pickled and which is then usually stuffed into a casing. |
| Seitan | It is a plant-based meat substitute made out of wheat gluten. |
| Softgel | It is a gelatin-based capsule with a liquid fill. |
| SPC | Soy protein concentrate |
| SPI | Soy protein isolate |
| Spirulina | It is a biomass of cyanobacteria that can be consumed by humans and animals. |
| Stabilizer | It is an ingredient added to food products to help maintain or enhance their original texture, and physical and chemical characteristics. |
| Supplementation | It is the consumption or provision of concentrated sources of nutrients or other substances that are intended to supplement nutrients in the diet and is intended to correct nutritional deficiencies. |
| Texturant | It is a specific type of food ingredient that is used to control and alter the mouthfeel and texture of food and beverage products. |
| Thickener | It is an ingredient that is used to increase the viscosity of a liquid or dough and make it thicker, without substantially changing its other properties. |
| Trans fat | Also called trans-unsaturated fatty acids or trans fatty acids, it is a type of unsaturated fat that naturally occurs in small amounts in meat. |
| TSP | Textured soy protein |
| TVP | Textured vegetable protein |
| WPC | Whey protein concentrate |
| WPI | Whey protein isolate |


Research Methodology
Mordor Intelligence follows a four-step methodology in all our reports.
- Step-1: Identify Key Variables: The quantifiable key variables (industry and extraneous) pertaining to the specific product segment and country are selected from a group of relevant variables & factors based on desk research & literature review; along with primary expert inputs. These variables are further confirmed through regression modeling (wherever required).
- Step-2: Build a Market Model: In order to build a robust forecasting methodology, the variables and factors identified in Step-1 are tested against available historical market numbers. Through an iterative process, the variables required for market forecast are set and the model is built on the basis of these variables.
- Step-3: Validate and Finalize: In this important step, all market numbers, variables and analyst calls are validated through an extensive network of primary research experts from the market studied. The respondents are selected across levels and functions to generate a holistic picture of the market studied.
- Step-4: Research Outputs: Syndicated Reports, Custom Consulting Assignments, Databases & Subscription Platforms


