Market Overview
| Study Period | 2021 - 2031 |
|---|---|
| Forecast Data Period | 2026 - 2031 |
| Historical Data Period | 2021 - 2024 |
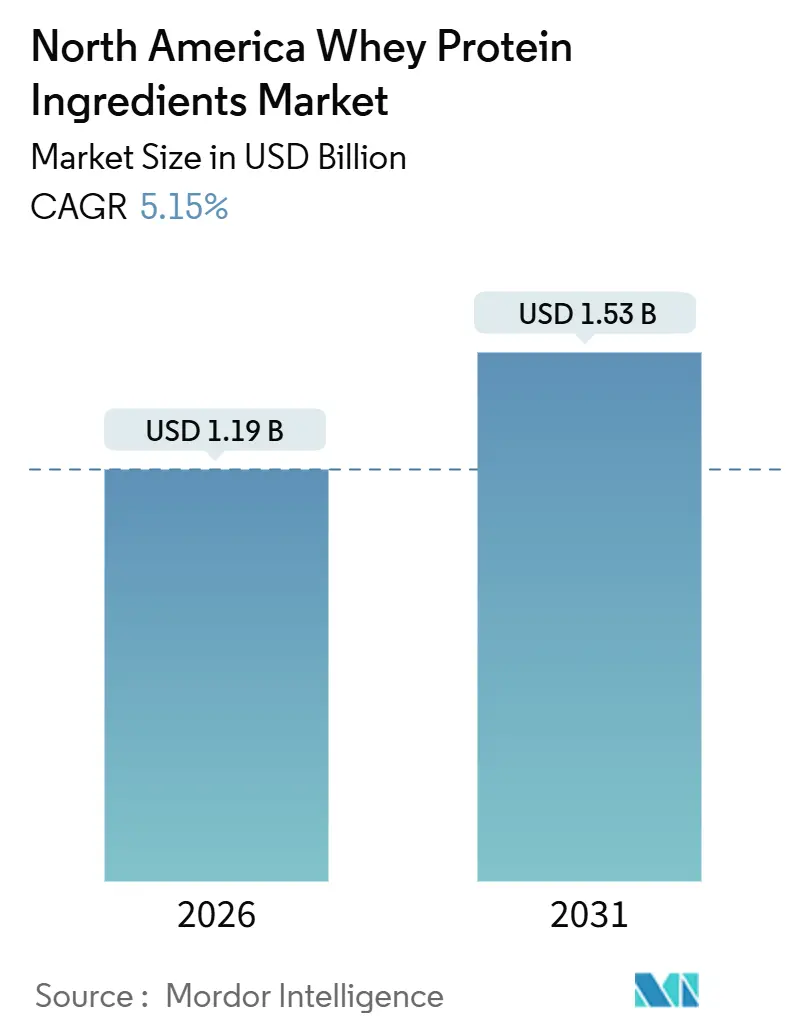
| Market Size (2026) | USD 1.19 Billion |
| Market Size (2030) | USD 1.53 Billion |
| Growth Rate (2026 - 2031) | 5.15% CAGR |
| Market Concentration | Medium |
Major Players
*Disclaimer: Major Players sorted in no particular order Image © Mordor Intelligence. Reuse requires attribution under CC BY 4.0. |
|
North America Whey Protein Ingredients Market Analysis by Mordor Intelligence
The North America whey protein ingredients market is expected to grow from USD 1.19 billion in 2026 to USD 1.53 billion by 2031, registering a CAGR of 5.15% during the forecast period. This growth is primarily driven by increasing consumer awareness about health and wellness, rising demand for clinical nutrition, and the ongoing trend of food fortification. However, competition from plant-based proteins and growing sustainability concerns are expected to slightly limit the market's growth potential. Whey protein concentrates remain the most cost-effective and widely used product type, contributing significantly to market volume. At the same time, hydrolysates are gaining popularity in medical nutrition due to their easy digestibility, while liquid whey protein formats are increasingly being used in ready-to-drink beverages, reshaping the product landscape. The market is moderately consolidated, with key players driving innovation and efficiency to meet evolving consumer demands.
Key Report Takeaways
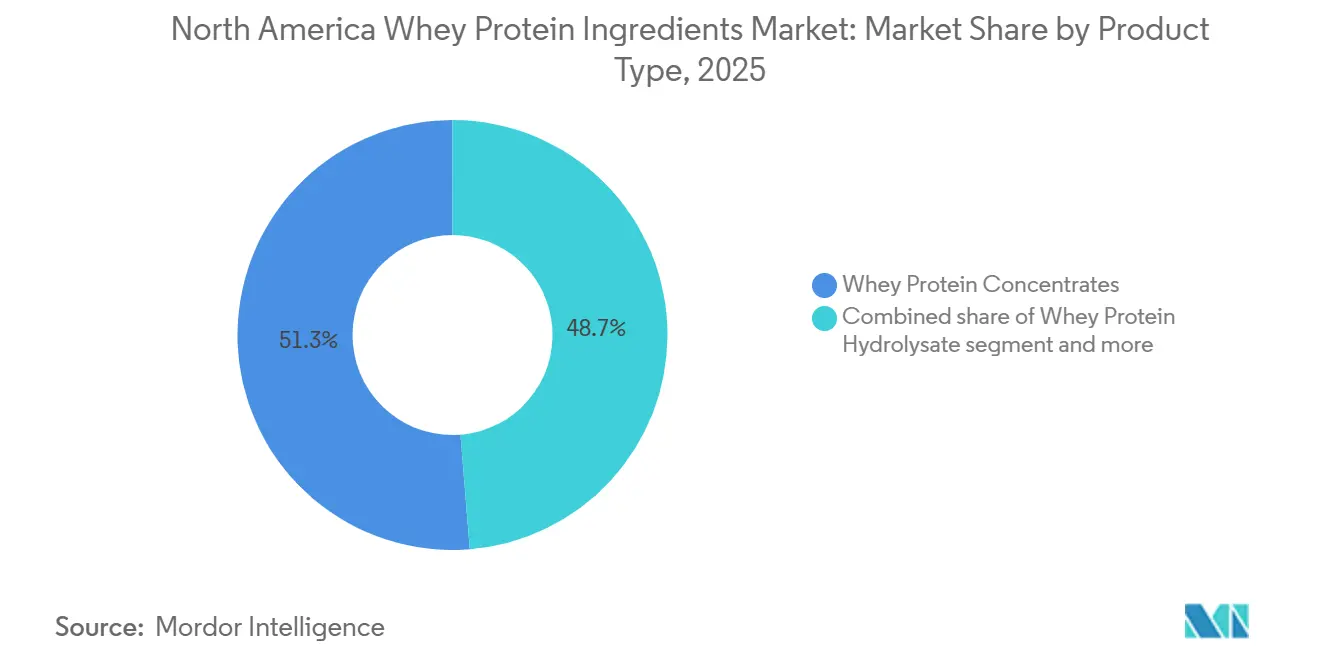
- By product type, concentrates led with 51.27% of the North America whey protein ingredients market share in 2025, while hydrolysates posted the fastest 6.47% CAGR through 2031.
- By form, powder formats commanded 91.48% of the North American whey protein ingredients market in 2025; liquid formats are advancing at a 7.52% CAGR to 2031.
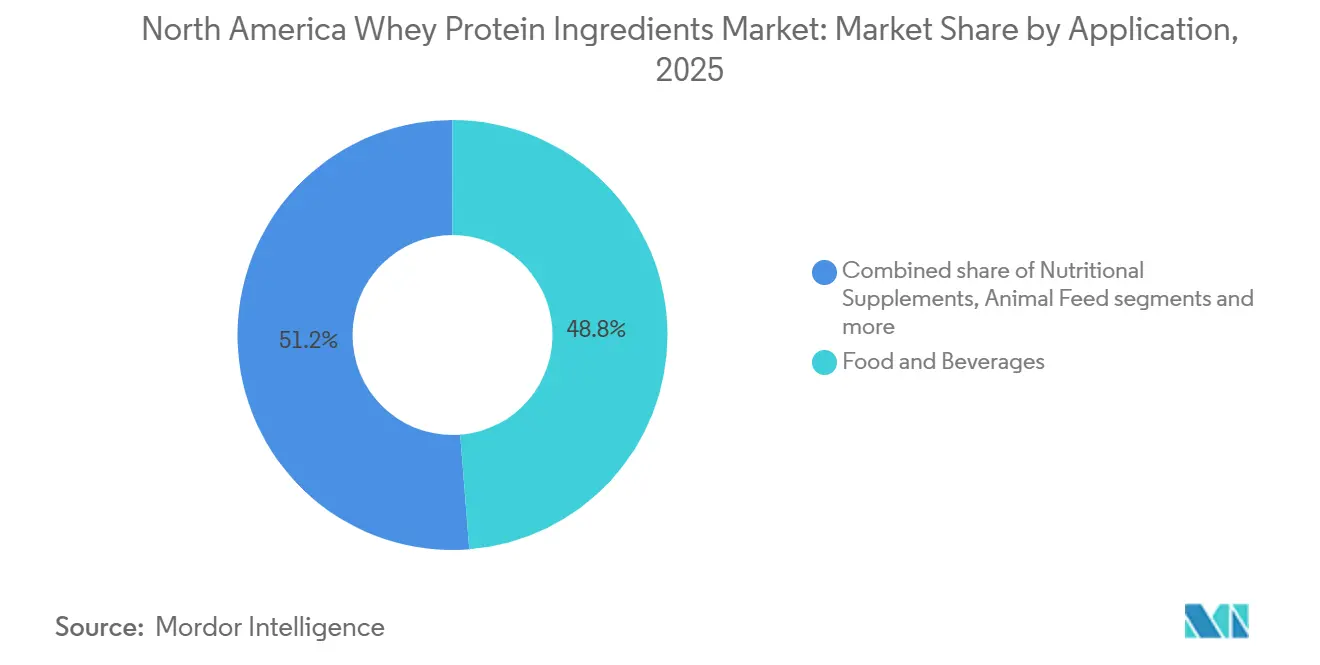
- By application, food and beverages accounted for 48.75% of the North American whey protein ingredients market in 2025, and nutritional supplements are projected to grow at a 6.57% CAGR through 2031.
- By country, the United States accounted for 86.13% of 2025 revenue, whereas Canada is expanding at a 6.11% CAGR through 2031 in the North American whey protein ingredients market.
Note: Market size and forecast figures in this report are generated using Mordor Intelligence’s proprietary estimation framework, updated with the latest available data and insights as of January 2026.
North America Whey Protein Ingredients Market Trends and Insights
Drivers Impact Analysis*
| Driver | (~) % Impact on CAGR Forecast | Geographic Relevance | Impact Timeline |
|---|---|---|---|
| Rising health and fitness awareness increasing demand for high-quality protein ingredients to support muscle growth | +1.2% | United States, Canada, with spillover to Mexico urban centers | Medium term (2-4 years) |
| Expanding use of whey protein in functional foods and beverages | +1.0% | North America-wide, concentrated in United States packaged food hubs | Short term (≤ 2 years) |
| Continued growth of infant nutrition and medical food applications | +0.9% | United States, Canada (regulatory-compliant facilities) | Long term (≥ 4 years) |
| Increased focus on healthy aging supporting demand for whey protein in clinical nutrition and senior nutrition products | +0.8% | United States, Canada, tracking 65+ population growth | Long term (≥ 4 years) |
| Product innovation including clean-label formulations, flavored proteins, low-lactose variants, and ready-to-drink formats | +0.7% | United States, Canada, Mexico metropolitan markets | Medium term (2-4 years) |
| Increasing protein fortification across everyday food categories such as bakery, dairy, snacks, and cereals | +0.6% | North America-wide, led by United States food manufacturers | Short term (≤ 2 years) |
| Source: Mordor Intelligence | |||


Rising health and fitness awareness is increasing demand for high-quality protein ingredients to support muscle growth
The demand for whey protein in North America is steadily increasing as awareness of health and fitness grows. According to the 2024 Food and Health Survey conducted by the International Food Information Council, 71% of Americans were actively trying to increase their protein intake[1]Source: International Food Information Council, "2024 IFIC Food and Health Survey", ific.org. This indicates that protein has become as critical as calorie content when making food purchase decisions. The trend is further supported by the rising use of GLP-1 weight-loss drugs, which encourage higher protein consumption to preserve lean muscle mass. The popularity of fitness apps that help users track their daily macronutrient intake has normalized regular protein consumption. These factors are driving consumers toward premium whey protein products, as they are willing to pay higher prices for products that offer proven benefits, such as improved bioavailability and muscle support.
Increased focus on healthy aging is supporting demand for whey protein in clinical nutrition and senior nutrition products
The growing focus on healthy aging is driving the demand for whey protein in North America, as older adults increasingly prioritize maintaining muscle strength, mobility, and overall immune health. In 2024, individuals aged 65 and above make up approximately 18% of the United States population, according to the World Bank[2]Source: World Bank, "Population Ages 65 and Above (% of Total Population) - United States", worldbank.org. This equates to nearly 10,000 Americans entering this age group daily. Whey protein is particularly beneficial for seniors due to its quick digestion and high leucine content, which helps prevent muscle loss associated with aging. As a result, it is widely used in senior-focused nutrition products, including ready-to-drink protein shakes, fortified foods, and convenient options like high-protein soups. The growing elderly population provides a consistent, long-term demand for whey protein products, offering stability to the North American whey protein ingredients market even amid fluctuations in short-term fitness trends.
Increasing protein fortification across everyday food categories such as bakery, dairy, snacks, and cereals
Protein fortification is making it easier for people to include whey protein in their daily diets by adding it to common foods and turning them into functional nutrition options. Everyday items like breads, yogurts, cereals, and snacks now offer around 8 to 20 grams of protein per serving. This has been made possible by advancements in processing techniques, such as ultrafiltration, which allow dairy brands to pack up to 20 grams of protein into a 150-gram yogurt cup without affecting its taste or texture. The growing trend of frequent snacking supports this shift. According to the 2024 Food and Health Survey by the International Food Information Council, nearly 75% of Americans snack at least once a day[3]Source: International Food Information Council, "2024 IFIC Food and Health Survey", ific.org. By incorporating whey protein into regular meals and snacks, rather than limiting it to fitness-related products, the North American whey protein ingredients market is expanding its reach.
Continued growth of infant nutrition and medical food applications
Infant nutrition and medical food applications create a steady and long-term demand for whey protein ingredients in North America. Recent updates to 21 CFR Part 107 by the United States Food and Drug Administration have introduced stricter compliance and quality standards. These changes have led to a shift in production toward large dairy processors that already have advanced, pharmaceutical-grade systems in place. Hypoallergenic infant formulas, which are designed to minimize allergic reactions, rely heavily on whey hydrolysates. Similarly, clinical and hospital enteral nutrition products use high-purity whey isolates to meet patients' specific dietary needs. Many institutional customers, such as hospitals and healthcare providers, operate under multi-year supply contracts. This ensures consistent demand and provides reliable revenue streams, contributing to the long-term stability of the North American whey protein ingredients market.
Restraints Impact Analysis*
| Restraint | (~) % Impact on CAGR Forecast | Geographic Relevance | Impact Timeline |
|---|---|---|---|
| Regulatory complexity for infant nutrition and medical food application | -0.6% | United States, Canada (Food and Drug Administration and Health Canada jurisdictions) | Long term (≥ 4 years) |
| Rising popularity of plant-based and alternative proteins | -0.8% | United States, Canada, Mexico urban centers | Medium term (2-4 years) |
| Lactose intolerance and dairy sensitivity among a portion of the population | -0.4% | United States, Canada, with higher impact in Hispanic and Asian American communities | Short term (≤ 2 years) |
| Increasing scrutiny around animal agriculture and sustainability concerns | -0.5% | United States, Canada, concentrated in coastal urban markets | Long term (≥ 4 years) |
| Source: Mordor Intelligence | |||
Rising popularity of plant-based and alternative proteins
The increasing popularity of plant-based and alternative proteins is limiting growth in the North American whey protein ingredients market. Proteins derived from sources such as pea, soy, and the emerging fava bean are growing rapidly, with double-digit expansion rates expected in 2024 and 2025. This growth is largely driven by their sustainability benefits, such as lower greenhouse gas emissions and reduced water usage, which appeal to environmentally conscious consumers. While these plant-based proteins generally have lower leucine content compared to whey, they are gaining traction, especially among younger consumers who prioritize climate-friendly choices. The market is seeing a rise in hybrid products combining whey and plant-based proteins, reflecting a partial shift in consumer preferences. Food and beverage manufacturers are also diversifying their protein sources to reduce supply chain risks and meet environmental, social, and governance (ESG) goals.
Increasing scrutiny around animal agriculture and sustainability concerns
Increasing concerns about sustainability are creating challenges for the North American whey protein ingredients market, as the dairy industry faces growing criticism over its environmental impact. Regulators and advocacy groups are focusing on issues such as greenhouse gas emissions, particularly methane, and the high water usage associated with dairy farming. The United States Environmental Protection Agency has highlighted these concerns, emphasizing the need for better resource management and emission control. While initiatives like the United States Dairy's Net Zero Initiative demonstrate the industry's commitment to addressing these issues, implementing such measures requires significant investments in areas such as improved animal feed, waste management systems, and water conservation practices. In regions experiencing water scarcity, retailers are increasingly demanding detailed sustainability reports and life-cycle assessments from suppliers.
*Our forecasts treat driver/restraint impacts as directional, not additive. The impact forecasts reflect baseline growth, mix effects, and variable interactions.
Segment Analysis
By Product Type: Hydrolysates Gain Medical Traction Despite Concentrate Dominance
Whey protein concentrates are expected to hold a significant 51.27% share of the North America whey protein ingredients market in 2025, making them the primary driver of market volume. These concentrates are popular for their affordability and versatility, making them suitable for a wide range of applications, including bakery items, snacks, and beverages. Manufacturers in the food and beverage industry prefer whey protein concentrates for protein fortification in mass-market products because they provide substantial protein content without significantly increasing production costs. As more consumers seek protein-enriched everyday foods, whey protein concentrates continue to dominate the market demand.
Whey protein hydrolysates, while representing a smaller portion of the market, are experiencing rapid growth, with a projected CAGR of 6.47% through 2031. These hydrolysates are highly valued for their rapid absorption and ease of digestion, making them ideal for specialized applications such as infant formula, medical nutrition, and premium sports nutrition products. Their superior performance benefits allow them to command higher prices and profit margins. As clinical and specialized nutrition applications expand, the role of whey protein hydrolysates in the market is steadily increasing, contributing to their growing importance in the overall whey protein ingredients market.


By Form: Liquid Whey Gains Momentum in Ready-to-Drink Applications
Powder formats were the leading segment in the North American whey protein ingredients market in 2025, with 91.48% market share. Their popularity stems from their long shelf life, ease of transportation, and adaptability across various food and beverage applications. Manufacturers rely on powders for large-scale production in industries such as bakery, snacks, and supplements because they enable precise measurements, maintain consistent protein levels, and reduce shipping costs. These benefits make powders the go-to choice for both industrial use and consumer products, ensuring their continued dominance in the market.
Liquid whey formats, although a smaller segment, are growing steadily at a projected 7.52%. This growth is supported by advancements in processing and packaging technologies, which have improved the shelf life and convenience of liquid whey products. Ready-to-drink protein beverages and portable options, such as grab-and-go formats, are becoming increasingly popular among consumers. These products cater to the rising demand for convenience and on-the-go consumption, helping liquid whey establish a niche as a high-value alternative to traditional powder formats.
By Application: Nutritional Supplements Accelerate as E-Commerce Democratizes Access
In 2025, food and beverage applications accounted for 48.75% of the North America whey protein ingredients market, highlighting whey’s widespread use in everyday products. Items like bakery goods, dairy products, beverages, and snacks increasingly incorporate whey protein to boost nutritional value while preserving taste and texture. The high demand for these products, coupled with frequent consumer purchases, ensures steady growth in this segment. Additionally, manufacturers are reformulating products to include higher protein content, further strengthening this category's dominance in the market.
Although nutritional supplements hold a smaller market share, they are growing faster, with a projected 6.57% growth rate through 2031. Direct-to-consumer brands are driving this growth by offering subscription-based services, personalized nutrition options, and leveraging influencer marketing to attract and retain customers. These strategies not only encourage repeat purchases but also enhance customer loyalty and lifetime value. As more consumers focus on wellness and performance nutrition, the demand for whey protein in supplements is becoming a key driver of market expansion.
Geography Analysis
The United States accounted for 86.13% of revenue in 2025, driven by its well-established dairy and cheese industry, which ensures a steady, reliable supply of whey for processing. The country’s strong emphasis on fitness and health has led to a growing preference for protein-enriched foods and beverages. Consumers are highly familiar with whey-based products, further boosting their popularity. Stricter regulations introduced after the infant formula crisis have favored established companies with Food and Drug Administration registrations, enabling them to maintain consistent supply chains and dominate the market.
Canada is expected to grow at a CAGR of 6.11% through 2031, supported by a stable milk supply system that encourages investment in advanced whey-processing technologies. Urbanization and changing dietary habits are driving demand for high-protein foods and beverages nationwide. Organizations like the Dairy Processors Association of Canada are actively promoting the use of whey in value-added products to maximize its potential. Trade agreements under the United States-Mexico-Canada Agreement are simplifying cross-border trade, while Health Canada’s regulatory framework provides local processors with a competitive advantage in the domestic market.
Mexico and other parts of North America are gradually improving their potential in the whey protein ingredients market. Urban consumers are increasingly adopting protein-enriched drinks and convenient nutrition products, which is driving localized demand. However, traditional dietary preferences and price sensitivity remain challenges for broader market adoption. Upgrades in regional cheese and dairy facilities are enhancing whey recovery, creating new opportunities for ingredient utilization. Additionally, improvements in cold-chain infrastructure and regional trade integration are helping expand market access for whey ingredient suppliers in these regions.
Competitive Landscape
The North American whey protein ingredients market is moderately consolidated, with a few major companies controlling the entire supply chain. Companies like Glanbia, Fonterra, and Arla Foods handle every stage, from sourcing raw milk to producing cheese and processing whey into premium ingredients. This end-to-end control allows them to maintain consistent product quality and quickly introduce new innovations. Their strong partnerships with global brands in the food, beverage, and nutrition industries further strengthen their market position, giving them a significant competitive edge.
Mid-sized companies are carving out their space in the market by focusing on flexibility and meeting specific customer needs. Firms such as Hilmar Cheese and Idaho Milk Products collaborate closely with their clients to deliver customized whey protein formulations and ensure efficient regional supply chains. These companies also stand out by offering unique features like grass-fed whey, organic certifications, and enhanced functional benefits. The rising demand for alternative proteins is pushing these suppliers to invest in research and innovation, helping them showcase the distinct advantages of whey protein and adapt to evolving consumer preferences.
Technology advancements and regulatory compliance are key drivers of competition in the market. Companies are adopting advanced processing technologies, such as improved filtration and drying methods, to produce whey with higher yields, better digestibility, and precise lactose control. This makes whey suitable for specialized applications like medical and infant nutrition. Regulatory compliance remains a critical factor, favoring established players with robust quality systems. Moreover, sustainability is becoming increasingly important, with companies focusing on eco-friendly practices like reducing emissions, improving energy efficiency, and enhancing traceability to meet customer expectations and secure long-term contracts in the North America whey protein ingredients market.
North America Whey Protein Ingredients Industry Leaders
-
Agropur Dairy Cooperative
-
Fonterra Co-operative Group Ltd.
-
Glanbia plc
-
Hilmar Cheese Company Inc.
-
Leprino Foods Company
- *Disclaimer: Major Players sorted in no particular order

Recent Industry Developments
- January 2026: Lactalis United States announced the launch of its Pronativ Native Whey Protein line. The product line was introduced in four distinct flavors – Mellow Chocolate, French Vanilla, Silky Strawberry, and Unflavored.
- December 2025: FrieslandCampina strengthened its global protein position through the planned acquisition of Wisconsin Whey Protein, a United States-based producer specializing in whey protein isolate. This strategic acquisition aimed to significantly expand the company's overall whey protein production capacity, aligning with the growing demand for protein supplementation in the nutritional food and beverage sector.
- August 2025: Silver Star Nutrition previously introduced its Select Proformance Elite Whey Protein Isolate (WPI). This product was specifically formulated for performance-focused individuals and athletes.
- June 2024: TAHA announced its entry into the United States market. The brand aimed to offer United States consumers high-quality nutritional supplements, including flagship offerings such as Whey Protein Concentrate, Whey Protein Isolate, and Colostrum, to cater to the growing demand for sustainable, health-focused nutrition solutions.


North America Whey Protein Ingredients Market Report Scope
The North American whey protein ingredients market is segmented by product type, form, application, and country. Based on product type, the market is classified into whey protein concentrates, whey protein isolates, and whey protein hydrolysate. Based on form, the market is classified into powder and liquid. Based on application, the market is classified into animal feed, food and beverages, personal care and cosmetics, and nutritional supplements. Based on country, the market is segmented into Canada, Mexico, and the United States. The market forecasts are provided in terms of value (USD).
By Product Type
| Whey Protein Concentrates |
| Whey Protein Isolates |
| Whey Protein Hydrolysate |
By Form
| Powder |
| Liquid |
By Application
| Animal Feed | |
| Food and Beverages | Bakery |
| Beverages | |
| Breakfast Cereals | |
| Condiments/Sauces | |
| Dairy and Dairy Alternatives Products | |
| RTE/RTC/ Food Products | |
| Snacks | |
| Personal Care and Cosmetics | |
| Nutritional Supplements | Baby Food and Infant Formula |
| Elderly and Medical Nutrition | |
| Sports/Performance Nutrition |
By Country
| United States |
| Canada |
| Mexico |
| Rest of North America |
| By Product Type | Whey Protein Concentrates | |
| Whey Protein Isolates | ||
| Whey Protein Hydrolysate | ||
| By Form | Powder | |
| Liquid | ||
| By Application | Animal Feed | |
| Food and Beverages | Bakery | |
| Beverages | ||
| Breakfast Cereals | ||
| Condiments/Sauces | ||
| Dairy and Dairy Alternatives Products | ||
| RTE/RTC/ Food Products | ||
| Snacks | ||
| Personal Care and Cosmetics | ||
| Nutritional Supplements | Baby Food and Infant Formula | |
| Elderly and Medical Nutrition | ||
| Sports/Performance Nutrition | ||
| By Country | United States | |
| Canada | ||
| Mexico | ||
| Rest of North America | ||


Market Definition
- End User - The Protein Ingredients Market operates on a B2B basis. Food, Beverages, Supplements, Animal Feed, and Personal Care & Cosmetic manufacturers are considered to be end-consumers in the market studied. The scope excludes manufacturers buying liquid/dry whey to be used for application as a binding agent or thickener or other non-protein applications.
- Penetration Rate - Penetration Rate is defined as the percentage of Protein-Fortified End User Market Volume in the Overall End User Market Volume.
- Average Protein Content - Average protein content is the average protein content present per 100 g of product manufactured by all end-user companies considered under the scope of this report.
- End User Market Volume - End-user market volume is the consolidated volume of all types and forms of end-user products in the country or region.
| Keyword | Definition |
|---|---|
| Alpha-lactalbumin (α-Lactalbumin) | It is a protein that regulates the production of lactose in the milk of almost all mammalian species. |
| Amino acid | It is an organic compound that contains both amino and carboxylic acid functional groups, which are required for the synthesis of body protein and other important nitrogen-containing compounds, such as creatine, peptide hormones, and some neurotransmitters. |
| Blanching | It is the process of briefly heating vegetables with steam or boiling water. |
| BRC | British Retail Consortium |
| Bread improver | It is a flour-based blend of several components with specific functional properties designed to modify dough characteristics and give quality attributes to bread. |
| BSF | Black Soldier Fly |
| Caseinate | It is a substance produced by adding an alkali to acid casein, a derivative of casein. |
| Celiac disease | Celiac disease is an immune reaction to eating gluten, a protein found in wheat, barley, and rye. |
| Colostrum | It is a milky fluid that’s released by mammals that have recently given birth before breast milk production begins. |
| Concentrate | It is the least processed form of protein and has a protein content ranging from 40-90% by weight. |
| Dry protein basis | It refers to the percentage of "pure protein" present in a supplement after the water in it is completely removed through heat. |
| Dry whey | It is the product resulting from drying fresh whey which has been pasteurized and to which nothing has been added as a preservative. |
| Egg protein | It is a mixture of individual proteins, including ovalbumin, ovomucoid, ovoglobulin, conalbumin, vitellin, and vitellenin. |
| Emulsifier | It is a food additive that facilitates the blending of foods that are immiscible with one another, such as oil and water. |
| Enrichment | It is the process of addition of micronutrients that are lost during the processing of the product. |
| ERS | Economic Research Service of the USDA |
| Extrusion | It is the process of forcing soft mixed ingredients through an opening in a perforated plate or die designed to produce the required shape. The extruded food is then cut to a specific size by blades. |
| Fava | Also known as Faba, it is another word for yellow split beans. |
| FDA | Food and Drug Administration |
| Flaking | It is a process in which typically a cereal grain (like corn, wheat, or rice) is broken down into grits, cooked with flavors and syrups, and then pressed into flakes between cooled rollers. |
| Foaming agent | It is a food ingredient that makes it possible to form or maintain a uniform dispersion of a gaseous phase in a liquid or solid food. |
| Foodservice | It refers to the part of the food industry which includes businesses, institutions, and companies which prepare meals outside the home. It includes restaurants, school and hospital cafeterias, catering operations, and many other formats. |
| Fortification | It is the deliberate addition of micronutrients that are not found in them naturally or which are lost during processing, to improve a food product's nutritional value. |
| FSANZ | Food Standards Australia New Zealand |
| FSIS | Food Safety and Inspection Service |
| FSSAI | Food Safety and Standards Authority of India |
| Gelling agent | It is an ingredient that functions as a stabilizer and thickener to provide thickening without stiffness through the formation of gel. |
| GHG | Greenhouse Gas |
| Gluten | It is a family of proteins found in grains, including wheat, rye, spelt, and barley. |
| Hemp | It is a botanical class of Cannabis sativa cultivars grown specifically for industrial or medicinal use. |
| Hydrolysate | It is a form of protein manufactured by exposing the protein to enzymes that can partially break the bonds between the protein's amino acids and break down large, complicated proteins into smaller pieces. Its processing makes it easier and quicker to digest. |
| Hypoallergenic | It refers to a substance that causes fewer allergic reactions. |
| Isolate | It is the purest and most processed form of protein which has undergone separation to obtain a pure protein fraction. It typically contains ≥ 90% of protein by weight. |
| Keratin | It is a protein that helps form hair, nails, and the outer layer of skin. |
| Lactalbumin | It is the albumin contained in milk and obtained from whey. |
| Lactoferrin | It is an iron‑binding glycoprotein that is present in the milk of most mammals. |
| Lupin | It is the yellow legume seeds of the genus Lupinus. |
| Millenial | Also known as Generation Y or Gen Y, it refers to the people born from 1981 to 1996. |
| Monogastric | It refers to an animal with a single-compartmented stomach. Examples of monogastric include humans, poultry, pigs, horses, rabbits, dogs, and cats. Most monogastric are generally unable to digest much cellulose food materials such as grasses. |
| MPC | Milk protein concentrate |
| MPI | Milk protein isolate |
| MSPI | Methylated soy protein isolate |
| Mycoprotein | Mycoprotein is a form of single-cell protein, also known as fungal protein, derived from fungi for human consumption. |
| Nutricosmetics | It is a category of products and ingredients that act as nutritional supplements to care for skin, nails, and hair natural beauty. |
| Osteoporosis | It is a medical condition in which the bones become brittle and fragile from loss of tissue, typically as a result of hormonal changes, or deficiency of calcium or vitamin D. |
| PDCAAS | Protein digestibility-corrected amino acid score (PDCAAS) is a method of evaluating the quality of a protein based on both the amino acid requirements of humans and their ability to digest it. |
| Per-capita consumption of animal protein | It is the average amount of animal protein (such as milk, whey, gelatin, collagen, and egg proteins) that is readily available for consumption by each person in an actual population. |
| Per-capita consumption of plant protein | It is the average amount of plant protein (such as soy, wheat, pea, oat, and hemp proteins) that is readily available for consumption by each person in an actual population. |
| Quorn | It is a microbial protein manufactured using mycoprotein as an ingredient, in which the fungus culture is dried and mixed with egg albumen or potato protein, which acts as a binder, and then is adjusted in texture and pressed into various forms. |
| Ready-to-Cook (RTC) | It refers to food products that include all of the ingredients, where some preparation or cooking is required through a process that is given on the package. |
| Ready-to-Eat (RTE) | It refers to a food product prepared or cooked in advance, with no further cooking or preparation required before being eaten. |
| RTD | Ready-to-Drink |
| RTS | Ready-to-Serve |
| Saturated fat | It is a type of fat in which the fatty acid chains have all single bonds. It is generally considered unhealthy. |
| Sausage | It is a meat product made of finely chopped and seasoned meat, which may be fresh, smoked, or pickled and which is then usually stuffed into a casing. |
| Seitan | It is a plant-based meat substitute made out of wheat gluten. |
| Softgel | It is a gelatin-based capsule with a liquid fill. |
| SPC | Soy protein concentrate |
| SPI | Soy protein isolate |
| Spirulina | It is a biomass of cyanobacteria that can be consumed by humans and animals. |
| Stabilizer | It is an ingredient added to food products to help maintain or enhance their original texture, and physical and chemical characteristics. |
| Supplementation | It is the consumption or provision of concentrated sources of nutrients or other substances that are intended to supplement nutrients in the diet and is intended to correct nutritional deficiencies. |
| Texturant | It is a specific type of food ingredient that is used to control and alter the mouthfeel and texture of food and beverage products. |
| Thickener | It is an ingredient that is used to increase the viscosity of a liquid or dough and make it thicker, without substantially changing its other properties. |
| Trans fat | Also called trans-unsaturated fatty acids or trans fatty acids, it is a type of unsaturated fat that naturally occurs in small amounts in meat. |
| TSP | Textured soy protein |
| TVP | Textured vegetable protein |
| WPC | Whey protein concentrate |
| WPI | Whey protein isolate |


Research Methodology
Mordor Intelligence follows a four-step methodology in all our reports.
- Step-1: Identify Key Variables: The quantifiable key variables (industry and extraneous) pertaining to the specific product segment and country are selected from a group of relevant variables & factors based on desk research & literature review; along with primary expert inputs. These variables are further confirmed through regression modeling (wherever required).
- Step-2: Build a Market Model: In order to build a robust forecasting methodology, the variables and factors identified in Step-1 are tested against available historical market numbers. Through an iterative process, the variables required for market forecast are set and the model is built on the basis of these variables.
- Step-3: Validate and Finalize: In this important step, all market numbers, variables and analyst calls are validated through an extensive network of primary research experts from the market studied. The respondents are selected across levels and functions to generate a holistic picture of the market studied.
- Step-4: Research Outputs: Syndicated Reports, Custom Consulting Assignments, Databases & Subscription Platforms


