Market Overview
| Study Period | 2019 - 2031 |
|---|---|
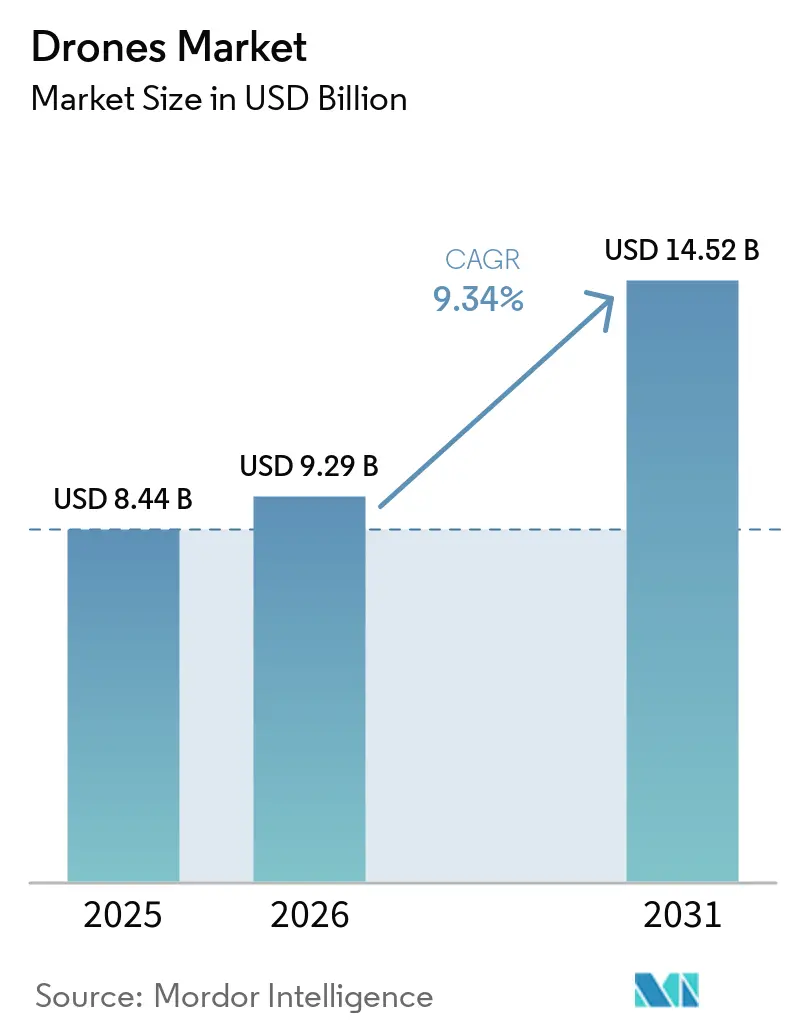
| Market Size (2026) | USD 9.29 Billion |
| Market Size (2031) | USD 14.52 Billion |
| Growth Rate (2026 - 2031) | 9.34% CAGR |
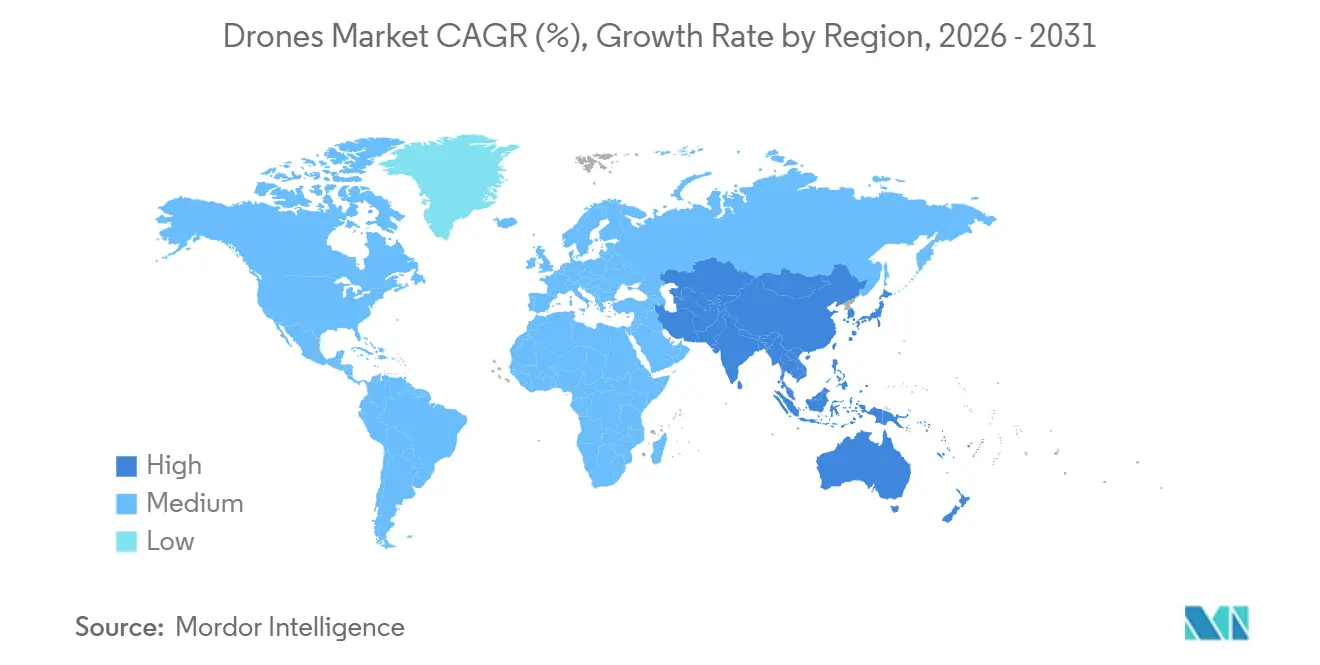
| Fastest Growing Market | Asia Pacific |
| Largest Market | North America |
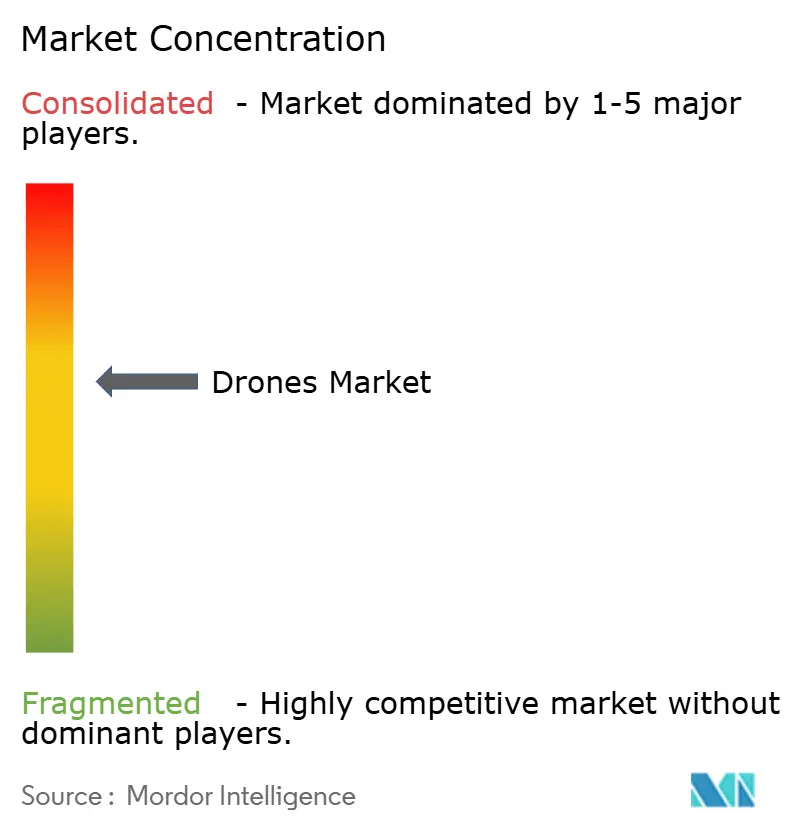
| Market Concentration | Medium |
Major Players
*Disclaimer: Major Players sorted in no particular order Image © Mordor Intelligence. Reuse requires attribution under CC BY 4.0. |
|
Drones Market Analysis by Mordor Intelligence
The drones market size is expected to grow from USD 8.44 billion in 2025 to USD 9.29 billion in 2026 and is forecasted to reach USD 14.52 billion by 2031 at 9.34% CAGR over 2026-2031. Regulatory momentum is reshaping commercialization, with the US FAA’s Beyond Visual Line of Sight framework moving from waivers to standardized operations, shifting thousands of previously waivered flights into routine operations for enterprise operators. Europe is codifying interoperable low-altitude airspace through U-space, which lays the structural foundation for networked autonomous operations and cross-border services that many other regions have not yet harmonized. Autonomy and airworthiness are advancing in parallel, as highlighted by EHang operators receiving Air Operator Certificates from the Civil Aviation Administration of China for pilotless passenger flights, signaling readiness for scaled urban air mobility (UAM) services in select cities. In the US, drone delivery remains limited to a set of Part 135-certificated carriers, though approvals are expanding as regulators refine operational guardrails for routine services at scale. Warehouse and inventory applications have already crossed the proof-of-value threshold for many enterprises, with deployments delivering very high gains in both throughput and accuracy, supporting sustained adoption in logistics workflows.
Key Report Takeaways
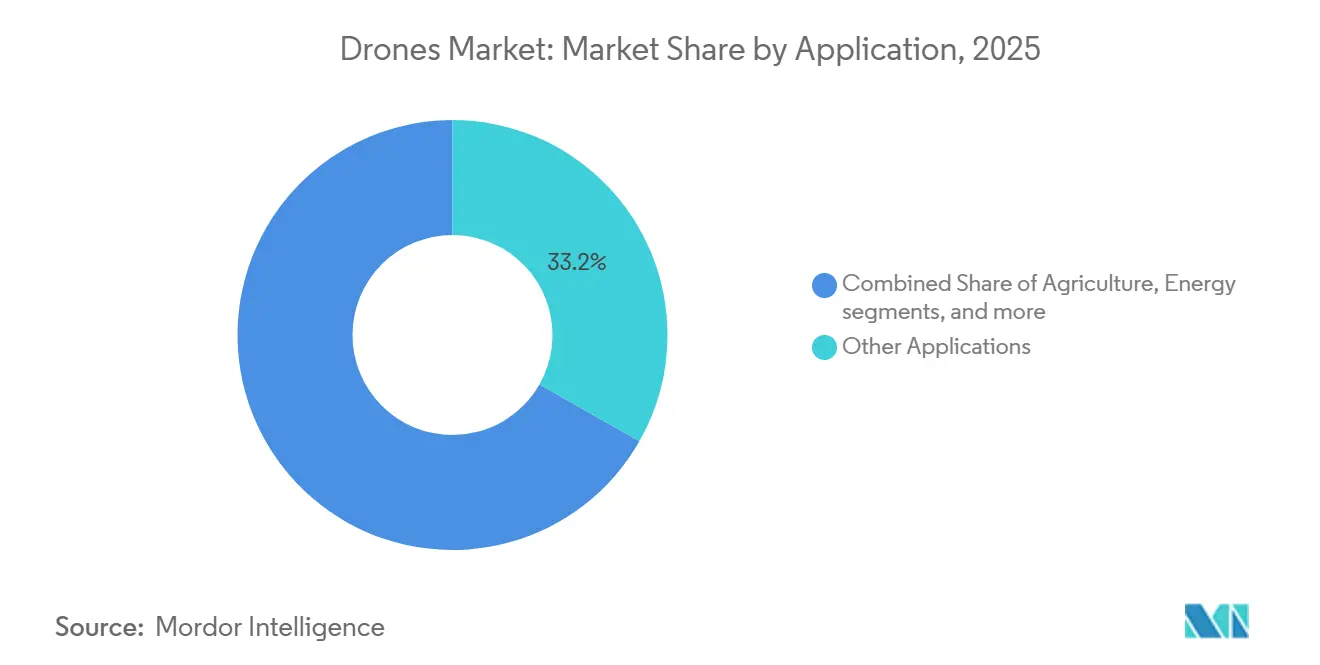
- By application, other applications led with a 33.23% revenue share in 2025, and agriculture is forecast to expand at a 10.28% CAGR to 2031.
- By type, rotary-wing platforms held a 70.25% share in 2025, and they are projected to grow at a 9.92% CAGR through 2031.
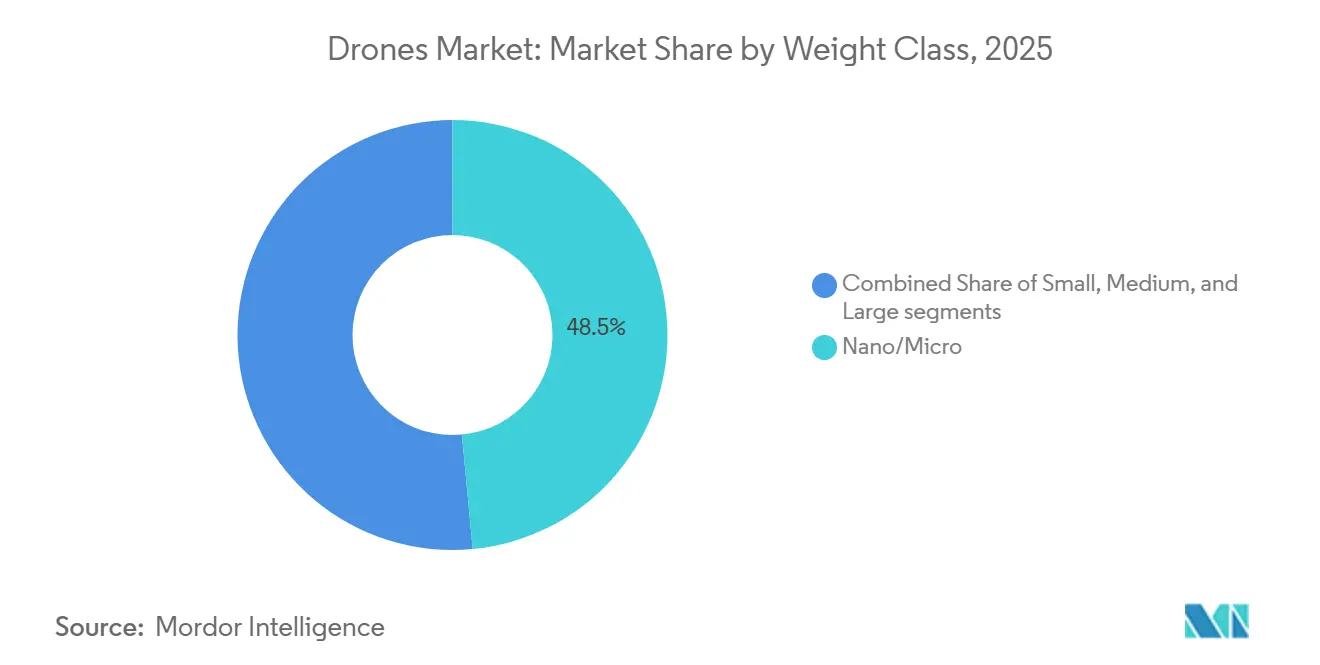
- By weight class, nano- and micro-drones under 2 kg captured a 48.50% share in 2025, and are forecast to grow at a 10.13% CAGR through 2031.
- By mode of operation, remotely piloted systems accounted for 72.50% in 2025, while fully autonomous platforms are projected to grow at a 11.30% CAGR through 2031.
- By end user, commercial and consumer users accounted for 65.30% in 2025 and are forecast to grow at a 10.41% CAGR through 2031.
- By geography, North America held a 37.86% share in 2025, while Asia-Pacific is projected to post a 9.88% CAGR to 2031.
Note: Market size and forecast figures in this report are generated using Mordor Intelligence’s proprietary estimation framework, updated with the latest available data and insights as of January 2026.
Global Drones Market Trends and Insights
Drivers Impact Analysis*
| Driver | (~) % Impact on CAGR Forecast | Geographic Relevance | Impact Timeline |
|---|---|---|---|
| Increasing investment and venture funding in drone startups | + 1.8% | Global, with concentration in North America, Asia-Pacific | Short term (≤ 2 years) |
| Expansion of DIAB and fully autonomous operational models | + 2.1% | North America, Europe core, spillover to Asia-Pacific urban centers | Medium term (2-4 years) |
| Progressive BVLOS and U-space/UTM regulatory advancements | + 1.9% | United States, Europe, early gains in Norway and Germany | Medium term (2-4 years) |
| Scaling of precision agriculture and rural drone service networks | + 2.3% | Global, particularly China, United States, Brazil, India | Short to medium term (≤ 3 years) |
| Integration of drones with enterprise digital-twin and AI ecosystems | + 1.7% | North America, Europe, urban Asia-Pacific | Medium to long term (3-5 years) |
| Rapid maturation of battery, hybrid, and fast charging technologies | + 1.4% | Global, with R&D leadership in United States, China, Europe | Long term (≥ 4 years) |
| Source: Mordor Intelligence | |||
Increasing Investment and Venture Funding in Drone Startups
Funding and scale-up activity in the drones market intensified from 2024 to 2026, with capital increasingly directed to operators and platform providers that can demonstrate repeatable operations and regulatory readiness. Delivery operators advanced by obtaining Part 135 authorizations for commercial package services, aligning investor interest with businesses already demonstrating consistent flight operations under a structured regulatory regime.[1]FAA, “Package Delivery by Drone,” faa.gov Terra Drone’s acquisition of the remaining stake in Aloft Technologies, an FAA-certified UTM provider with a significant share of LAANC authorizations processed in the United States, highlights growing investments in scalable infrastructure and traffic management solutions. Overall, the drones market is attracting significant investments in companies that combine recurring operational capabilities with compliance expertise and robust technology, facilitating the transition from pilot projects to scaled deployments.
Expansion of DIAB and Fully Autonomous Operational Models
The shift from pilot-operated missions to autonomous fleets is accelerating as docking systems, integrated sensors, and certified airworthiness features move into production. DJI and other enterprise vendors promote dock-enabled remote operations that support always-on monitoring and scheduled missions for infrastructure security and inspections across large sites. Autonomy is also advancing in regulated passenger operations, with EHang operators obtaining Air Operator Certificates from the CAAC for pilotless human-carrying flights, which demonstrates that certified UAM can launch under defined corridors and procedures. European U-space rules underpin distributed traffic services that coordinate automated flights with common procedures and data exchange, supporting models like Drone-in-a-Box while managing separation and contingencies. Autopilot advancements are moving into enterprise fleets as well, where security-focused platforms like Parrot emphasize secure elements, encrypted data pipelines, and onboard processing that fit privacy and compliance requirements for sensitive missions.
Progressive BVLOS and U-space/UTM Regulatory Advancements
The US regulators have laid out the pathway from waiver-driven BVLOS operations to consistent rules, with the FAA’s proposed BVLOS rule proceeding toward finalization after an Executive Order timetable and with tens of thousands of prior BVLOS missions under waiver establishing operational precedent. European authorities are harmonizing U-space services across member states so that operators can interface with standardized traffic management functions, a change that supports cross-border services and easier expansion for networked fleets. In the US, growth in package delivery depends on a limited but growing cohort of Part 135 carriers, which puts a premium on regulatory alignment and operational robustness for last-mile models. These policy shifts favor vendor teams with resources to support documentation, safety cases, and ongoing compliance engagement, which allows larger platform providers to scale once the rules take hold in operations. As common services and procedures stabilize, the drones market can move from isolated trials to broader corridors and service networks that operate under established risk frameworks in both the US and Europe.
Scaling of Precision Agriculture and Rural Drone Service Networks
Agricultural operations have advanced from trials to high-volume deployment in several large markets, with research reporting extensive field activity across China and other farming economies that validates the economics of aerial spraying and variable-rate applications. OEMs continue to push platform capacity and duty cycles, as seen with XAG’s P150 Max, which integrates high-flow spraying, broad spreading capacity, field mapping, and expedited recharging to keep utilization high during narrow agronomic windows.[2]XAG, “XAG’s New P150 Max Agricultural Drone Sets a Higher Bar,” xa.com Precision capabilities are maturing in software, with vendors promoting end-to-end workflows that link drones to cloud analytics and field sensors in unified experiences for planning, execution, and reporting. Local financing and subsidy programs also help rural operators extend aerial services across larger acreages, with company-led announcements showing how eligible purchases tie into broader agricultural modernization goals. As these elements combine, the drones market is seeing the most consistent adoption in farming systems, supported by supportive policies, training networks, and service providers that can sustain uptime during peak seasons.
Restraints Impact Analysis*
| Restraint | (~) % Impact on CAGR Forecast | Geographic Relevance | Impact Timeline |
|---|---|---|---|
| Li-ion cell supply crunch inflating small-drone BOM costs | - 0.9% | Global, acute in markets dependent on specific battery supply chains | Short term (≤ 2 years) |
| Government policies and airspace regulations hampering the usage of drones | - 1.2% | Varies by jurisdiction | Medium term (2-4 years) |
| Privacy-by-design rules in the EU slowing urban adoption | - 0.6% | European Union member states | Medium term (2-4 years) |
| Operational integration complexity and ambiguous ROI in some use cases | - 0.8% | Global, particularly in enterprise deployments | Medium term (2-4 years) |
| Source: Mordor Intelligence | |||
Li-ion Cell Supply Crunch Inflating Small-Drone BOM Costs
Supply constraints on key battery inputs have heightened sensitivity to bill-of-material costs for price-sensitive platforms, most notably in small drone categories that scale with unit volume. Manufacturers have prioritized continuity of supply and design-for-availability approaches so that airframes can maintain delivery schedules when specific components are delayed. Vendors that rely on consistent battery and motor inflows continue to refine sourcing plans and component substitutions where this can be achieved without compromising safety cases or endurance. Some makers have publicly emphasized that secure sourcing is a core part of their value proposition in sensitive categories, reinforcing the importance of component provenance and end-product compliance. These factors create a temporary cost overhang, pushing the drones market toward vendors with diversified supplier relationships and tested substitutions that meet performance targets.
Government Policies and Airspace Regulations Hampering the Usage of Drones
Regulation remains a gating factor across jurisdictions because policy maturity and implementation timelines vary significantly. In the US, the shift toward a final BVLOS rule follows a period of growth under waivers. However, the speed of adoption still depends on certifiable detect-and-avoid capabilities and operational risk frameworks that meet regulator expectations. In Europe, U-space harmonization provides a blueprint for scaled services, yet rollout across member states requires coordinated investments in service providers, digital infrastructure, and operator compliance. Package delivery also relies on a small and expanding group of certificated carriers in the US, which creates bottlenecks that will clear as more teams complete safety and procedural milestones. These dynamics tend to favor well-capitalized operators that can sustain multi-quarter approval cycles and technology validation before unlocking new service areas.
*Our forecasts treat driver/restraint impacts as directional, not additive. The impact forecasts reflect baseline growth, mix effects, and variable interactions.
Segment Analysis
By Application: Fragmented Demand Consolidates Around High-Volume Verticals
Other applications accounted for a 33.23% share in 2025, while agriculture is projected to grow at a 10.28% CAGR through 2031. The drones market is seeing widespread use across diverse public-safety, surveying, and media missions. Yet, agriculture delivers the highest return on investment because flight hours directly translate into treated acreage and reduced inputs. OEM roadmaps have focused on increasing payload and throughput, with platforms such as XAG's P150 Max designed to handle larger tanks, broader spread rates, and fast recharging so service providers can compress turnaround times during peak windows. Integrated agronomy software complements these capabilities, linking drones to applications that stitch maps, analyze variability, and produce prescriptions that drive variable-rate performance in the field. These elements reinforce agriculture as a high-volume vertical where platform improvements translate into clear daily productivity gains.
The unit economics of agriculture differ significantly from those of lower-density applications, such as one-off construction surveys or occasional media capture, where flight hours are less likely to support repeatable programs. UAM is also becoming part of the landscape, with pilotless passenger services operating in designated corridors in China. This development indicates the potential emergence of new segments as certified fleets expand. For many enterprises, the primary barrier to adoption is no longer the airframe's capability but rather the quality of integration with downstream systems, which determines whether drone data translates into consistent operational improvements. As integration processes advance, the drones market is expected to focus on verticals characterized by frequent missions and measurable outcomes.


By Type: VTOL Versatility Outweighs Fixed-Wing Endurance in Mainstream Markets
Rotary-wing platforms held a 70.25% share in 2025 and are projected to grow at a 9.92% CAGR through 2031. Versatility in confined spaces, reduced pilot workload, and rapid setup make multirotors the default for construction, public safety, and many inspection tasks where 20- to 40-minute missions suffice. Fixed-wing and hybrid platforms maintain a performance edge on range and endurance, which suits long-line inspection and mapping at scale, where mission profiles justify launch and recovery infrastructure. UAM adds another layer, where certificated eVTOL designs offer vertical takeoff and passenger safety cases for city corridors, tying VTOL benefits to regulated airworthiness and designated routes.
Price points and logistics also shape the mix between rotary and fixed-wing types. Multirotors that slot into everyday jobs are easier to stage and redeploy, which keeps utilization high in industries with frequent, short missions. Fixed-wing platforms, on the other hand, require trained teams and field procedures that many commercial operators cannot justify unless projects run at scale. Across civilian markets, the drones market will likely maintain rotary-wing leadership, while fixed-wing types retain niche dominance in long-range and high-endurance missions.
By Weight Class: Sub-250g Platforms Exploit Regulatory Arbitrage
Nano and micro drones under 2 kg captured a 48.50% share in 2025 and are advancing at a 10.13% CAGR through 2031. Sub-250g platforms benefit from lighter licensing and registration burdens in many jurisdictions, making them attractive to consumer and entry-level commercial users who need aerial imaging and basic sensing. OEMs target this space with stable sensor packages and capable avoidance systems inside very small airframes, as seen in product families that pair compact design with improved camera performance. Professional vendors also emphasize lightweight designs to meet EU standards and reduce paperwork, helping organizations standardize fleets across regions with consistent operator requirements.
Trade-offs arise when payloads and endurance must increase, which is why the small and medium categories remain the anchor of professional adoption. Enterprise-class airframes carry thermal sensors, LiDAR, and specialized payloads for mapping and inspection, often with weather-hardening to maintain uptime. Agricultural platforms like XAG’s P150 Max illustrate a different axis of scaling where payload and spray or spread rates govern ROI, supported by quick charging cycles and integrated autonomy. The drones market will continue to bifurcate by weight class, with sub-250g devices winning on cost and ease of compliance. In contrast, heavier classes dominate when payload flexibility, endurance, and environmental robustness are paramount.
By Mode of Operation: AI-Driven Autonomy Commands Premium, But Deployment Lags Projections
Remotely piloted systems accounted for a 72.50% share in 2025, while fully autonomous platforms are projected to grow at an 11.30% CAGR through 2031. Remote piloting remains the backbone of most commercial operations because rules still expect human oversight and because autonomy adds cost and complexity. At the same time, pilotless operations are maturing within defined envelopes, including certified passenger services in China that run along designated routes under certificated procedures for aircraft and operators. The near-term balance will keep human-in-the-loop models prevalent in most commercial workflows, while fully autonomous fleets scale where airspace services and operational approvals are strongest.
By End-User: Commercial and Consumer Markets Lead, with Procurement Driving Innovation
Commercial and consumer users accounted for 65.30% in 2025 and grew at a 10.41% pace. Consumer and prosumer imaging anchors demand at the entry level, while commercial users drive recurring missions in construction, agriculture, logistics, and asset inspections. Package delivery is maturing under US Part 135 carriers, demonstrating that regulated last-mile operations can scale when operators meet airworthiness and safety management requirements. Warehouse workflows show consistent gains in time and accuracy, which speaks to a strong adoption curve for inventory and stock-checking use cases where drones integrate with warehouse management systems.
Government and civil users procure in smaller volumes but demand higher specifications for resilience, secure communications, and data protection. UAM enters the civilian end-user market through certificated operations in China, setting the precedent for passenger services that can expand once other jurisdictions complete certification pathways.[3] Over time, commercial volume will remain the primary driver of unit shipments, while government and civil programs will continue to fund advanced capabilities that will shape the next wave of drone technology.
Geography Analysis
North America accounted for 37.86% of the market in 2025. The region’s policy environment is moving toward normalized BVLOS operations, with the FAA’s proposed rule scheduled for final determination. US delivery continues to expand within a framework in which certificated carriers operate under Part 135 procedures, channeling investment into operators that meet safety and airworthiness thresholds.
Asia-Pacific is projected to post a 9.88% CAGR through 2031. China’s low-altitude economy is advancing under a domestic regulatory system that has enabled pilotless passenger flights in major cities, positioning the region as a first mover in commercial UAM. Agricultural adoption has scaled across several farming centers, validating the economics of aerial application and supporting service networks. Regional OEMs are expanding capacity and platform capabilities, particularly in agriculture, where payload and rapid charging support longer duty cycles and peak-season throughput.
Europe continues to develop an integrated airspace management system that supports automated operations while aligning with privacy and data protection requirements. U-space harmonization provides common services and procedures for UAS traffic management across member states, which are essential for cross-border services and the integration of autonomous fleets. Data security and privacy remain decisive factors in procurement, bolstering demand for vendors demonstrating encryption and secure data flows. In Latin America, agricultural modernization programs and company-led financing initiatives support the adoption of aerial application, tied to broader productivity goals and rural service networks. These region-specific factors shape adoption patterns, with policy readiness and sector priorities determining where the drones market can scale fastest.

Competitive Landscape
Competitive dynamics in the drones market highlight the importance of high-volume commercial segments. In the US and allied markets, public-safety buyers focus on secure data handling and compliant sourcing, favoring vendors with established certifications. The commercial portfolio remains fragmented across sectors such as imaging, inspection, logistics, and agriculture, where price competitiveness and ease of use are critical factors. Autonomy and airworthiness serve as strategic differentiators in civilian applications. Operators obtaining certifications for pilotless passenger flights gain a competitive time-to-market advantage in regulated UAM operations. In Europe, procurement trends favor vendors that comply with privacy and data protection requirements. At the same time, in the United States, delivery operators meeting stringent airworthiness standards continue to expand their market share.
Supply resilience and sourcing controls play a significant role in shaping strategic positioning. OEMs that prioritize secure components and firmware control enhance their standing in jurisdictions with strict public-sector requirements. Enterprise portfolios that integrate airframes, autonomy software, and lifecycle services are improving unit economics as clients transition from pilot projects to full-scale programs. These developments underscore a drones market driven by regulatory compliance, supply chain assurance, and seamless integration into operational workflows.
Drones Industry Leaders
-
SZ DJI Technology Co., Ltd.
-
AeroVironment, Inc.
-
Autel Robotics Co., Ltd.
-
Yuneec (ATL Drone)
-
Parrot Drones SAS
- *Disclaimer: Major Players sorted in no particular order

Recent Industry Developments
- April 2026: At the Logistics Shakti 2026 event in New Delhi, BonV Aero, hailing from India, unveiled its multi-modular drone, Air Hans. This debut marks BonV Aero's foray into commercial drone logistics, transitioning from its traditional focus on defense operations to B2B applications.
- November 2025: XAG launched the P150 Max agricultural drone for large-scale field conditions, featuring an 80 kg payload, an 85-liter smart liquid tank, multi-mission modules, centimeter-level autonomy, and Smart SuperCharge battery charging in as little as 7 minutes.
- July 2025: SZ DJI Technology Co., Ltd., unveiled its latest offerings: the DJI Agras T100, T70P, and T25P. These new models, part of DJI Agriculture's renowned spray drone lineup, are the culmination of over 12 years of focused R&D.


Research Methodology Framework and Report Scope
Market Definitions and Key Coverage
Our study defines the global drones market as the yearly revenues generated from the sale of unmanned aerial vehicles that are remotely piloted, optionally piloted, or fully autonomous and that weigh less than 600 kg. Values cover hardware platforms across consumer, commercial, and defense use cases and exclude add-on services, software sold separately, payloads fitted after sale, and passenger eVTOL aircraft.
Scope exclusion: Counter-UAS systems and ballistic loitering munitions are outside the study.
Segmentation Overview
-
By Application
- Construction
- Agriculture
- Energy
- Entertainment
- Law Enforcement
- Other Applications
-
By Type
- Fixed-Wing Drones
- Rotary-Wing Drones
- Hybrid/VTOL Drones
-
By Weight Class
- Nano/Micro (Less than 2 kg)
- Small (2 to 25 kg)
- Medium (25 to 150 kg)
- Large (Greater than 150 kg)
-
By Mode of Operation
- Remotely Piloted
- Optionally Piloted
- Fully Autonomous
-
By End User
- Commercial and Consumer
- Government and Civil
-
By Geography
-
North America
- United States
- Canada
- Mexico
-
Europe
- United Kingdom
- France
- Germany
- Russia
- Rest of Europe
-
Asia-Pacific
- China
- India
- Japan
- South Korea
- Rest of Asia-Pacific
-
South America
- Brazil
- Rest of South America
-
Middle East and Africa
-
Middle East
- United Arab Emirates
- Saudi Arabia
- Rest of Middle East
-
Africa
- South Africa
- Rest of Africa
-
Middle East
-
North America
Detailed Research Methodology and Data Validation
Primary Research
Mordor's team conducted structured interviews and short surveys with drone OEM managers, component suppliers, and civilian operators across North America, Europe, and Asia, plus procurement officers in two armed forces. These discussions validated adoption rates, channel mark-ups, and the timing of BVLOS regulatory shifts that impact addressable demand.
Desk Research
We started by gathering publicly available facts from tier-1 bodies such as the FAA, EASA, China CAAC, UN Comtrade, and WIPO patent filings, then reviewed trade association releases from AUVSI and JUIDA. Company 10-Ks, investor decks, and press releases filled product launch and average selling price (ASP) gaps. To size defense demand, white papers from SIPRI and national budget documents proved useful. Subscription datasets that Mordor analysts access, D&B Hoovers for firm-level revenue splits and Dow Jones Factiva for shipment news, rounded out the desk scan. The sources named illustrate the breadth; many others were tapped for cross-checks and clarification.
Market-Sizing & Forecasting
A top-down build begins with civil aircraft production and import-export statistics, which are reconstructed into drone-only volumes using registration data. Results are corroborated through sampled bottom-up checks, rolling up leading supplier shipments and triangulating with ASP × unit insights from interviews. Key variables in the model include average battery energy density, share of agricultural land under precision farming, number of construction projects using photogrammetry, and defense ISR fleet renewal rates. A multivariate regression links these drivers to unit uptake, while exponential smoothing extends the trend to 2030. Any regional volume gaps are bridged with penetration-rate proxies from comparable technology rollouts.
Data Validation & Update Cycle
Outputs pass a three-layer review: automated variance flags, peer analyst scrutiny, and a lead analyst sign-off. Models refresh each year, with interim tweaks triggered by material events such as major regulatory announcements or disruptive platform launches. Before a report ships, we re-run the latest data pull to ensure clients receive the freshest view.
Why Mordor's Drones Baseline Figures Inspire Confidence
Published estimates often differ because firms select varying scopes, base years, and refresh cadences.
Key gap drivers include whether consumer drones are counted, how aftermarket payload sales are treated, the choice of ASP progression, and the frequency of recalibrating models once new import data land. Mordor's disciplined scope and annual refresh help users rely on one steady baseline.
Benchmark comparison
| Market Size | Anonymized source | Primary gap driver |
|---|---|---|
| USD 41.79 B (2025) | Mordor Intelligence | - |
| USD 30.02 B (2024) | Global Consultancy A | Excludes consumer segment; uses static ASPs until 2027 |
| USD 26.12 B (2025) | Industry Association B | Counts OEM revenue only; omits accessories and is limited to <25 kg class |
In sum, Mordor's bottom-up validations layered onto a transparent top-down spine, plus timely data refreshes, deliver a balanced baseline that decision-makers can trace back to clear drivers and replicate with confidence.


Key Questions Answered in the Report
What is the projected size and growth rate of the drones market by 2031?
The drones market size is projected to reach USD 14.52 billion by 2031 at a 9.34% CAGR, reflecting regulatory normalization of BVLOS operations and broader enterprise adoption.
Which applications are driving the fastest growth within the drones market?
Agriculture is the fastest growing application segment with a projected 10.28% CAGR through 2031, supported by scaled fleets, integrated agronomy software, and higher duty cycles during peak seasons.
How are US and EU regulations shaping commercial drone operations?
The US is moving BVLOS from waivers toward normalized rules and delivery relies on certificated Part 135 carriers, while Europe’s U-space harmonizes traffic services across member states to support automated operations.
What is the role of autonomy in the future of the drones market?
Fully autonomous platforms are growing faster than pilot-operated systems, enabled by dock solutions, onboard AI, and traffic services, while near-term deployments still center on human-in-the-loop operations in most jurisdictions.
Which companies exemplify scaling under regulated programs?
THe US Army Short-Range Reconnaissance (SRR) and the US Air Force contracts to Skydio and Teal Drones, Inc. highlight defense-grade autonomy at scale, while EHang’s operator certificates mark the first commercial pilotless passenger services, both signaling maturity in regulated operations.
Where are drones delivering the clearest ROI in enterprise settings?
Warehouse inventory automation has shown strong improvements in count time and accuracy, and agricultural spraying demonstrates sustained field productivity with integrated autonomy and rapid charging.
Page last updated on:


