Non-GMO Foods Market Size and Share
Market Overview
| Study Period | 2021 - 2031 |
|---|---|
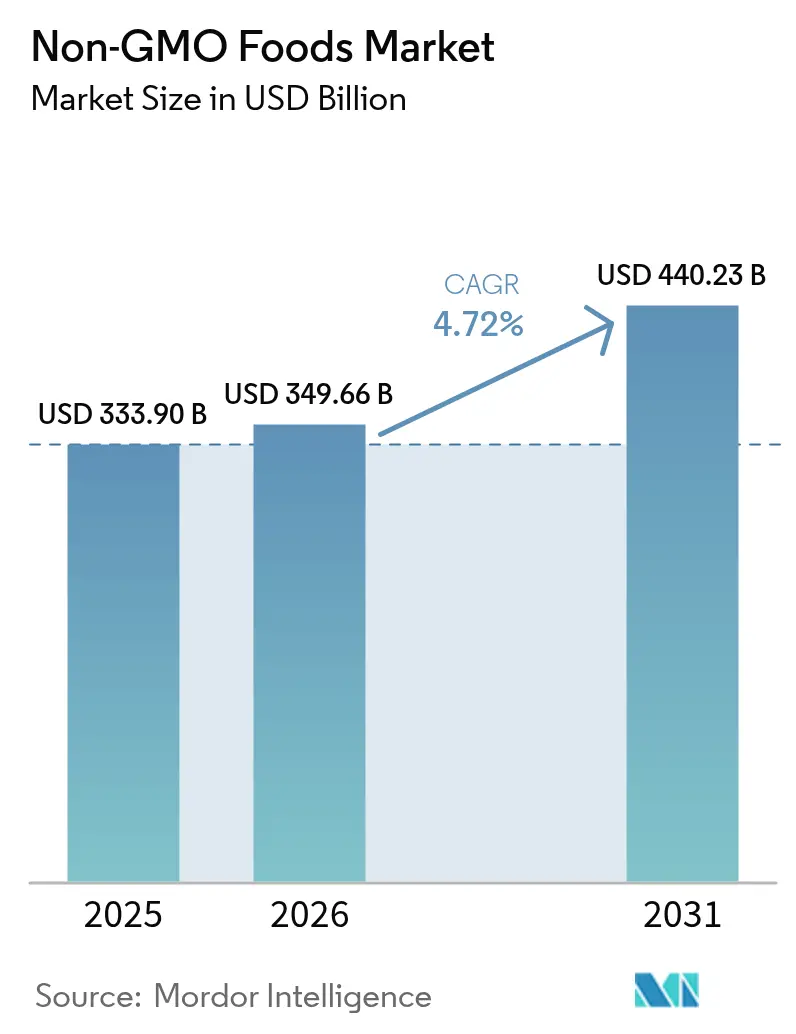
| Market Size (2026) | USD 349.66 Billion |
| Market Size (2031) | USD 440.23 Billion |
| Growth Rate (2026 - 2031) | 4.72% CAGR |
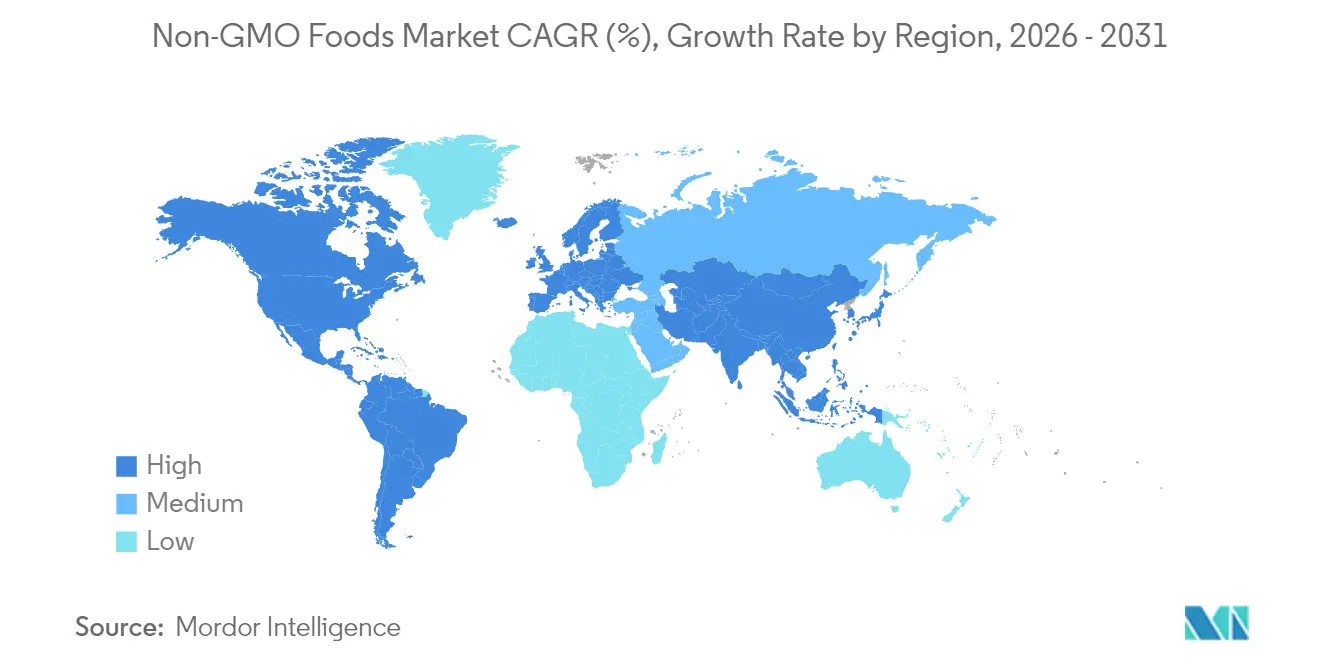
| Fastest Growing Market | Asia Pacific |
| Largest Market | North America |
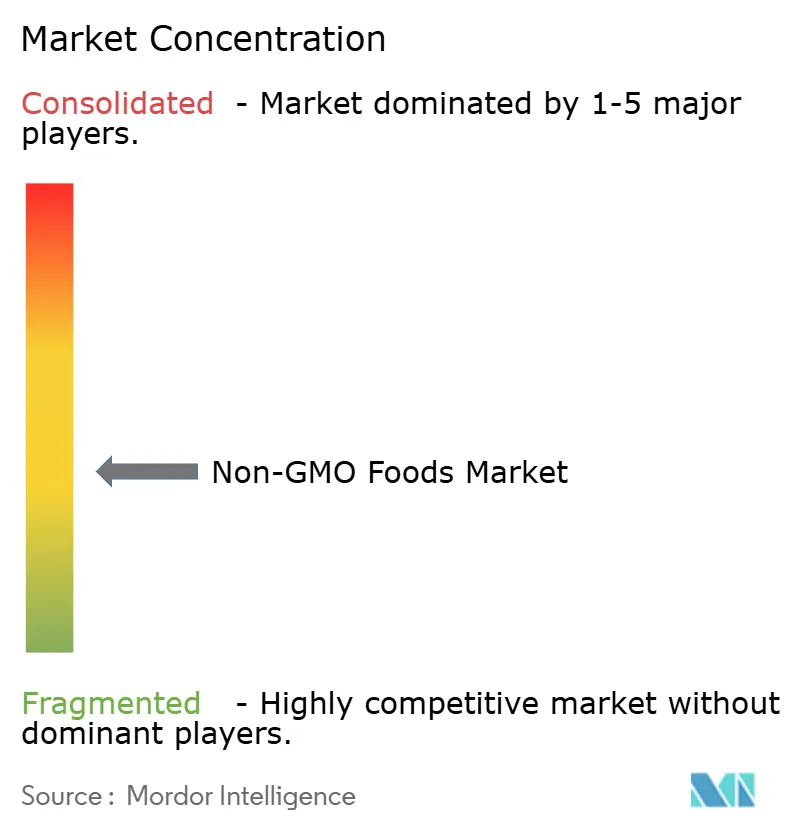
| Market Concentration | Medium |
Major Players
*Disclaimer: Major Players sorted in no particular order Image © Mordor Intelligence. Reuse requires attribution under CC BY 4.0. |
|
Non-GMO Foods Market Analysis by Mordor Intelligence
The non-GMO foods market size was valued at USD 333.9 billion in 2025 and estimated to grow from USD 349.66 billion in 2026 to reach USD 440.23 billion by 2031, at a CAGR of 4.72% during the forecast period (2026-2031). This growth is driven by increasing consumer demand for transparency in product ingredients, the implementation of standardized bioengineering disclosure regulations, and the development of large-scale verified supply chains. Supportive public policies favoring clear labeling over outright bans have reduced entry barriers for manufacturers adopting non-GMO sourcing early in their production processes. North America currently holds the largest share of the market's revenue, while the Asia-Pacific region is experiencing the fastest growth. This rapid expansion in Asia-Pacific is attributed to a growing middle-class population transitioning from occasional interest in non-GMO products to making them a regular part of their purchases. While food products dominate the current demand, the beverage segment is growing at a faster pace, driven by innovations in functional and plant-based drinks. Conventional non-GMO products account for the majority of sales volume; however, the organic segment is expanding more rapidly as price differences narrow and consumers increasingly prioritize environmental sustainability. The non-GMO foods market is moderately fragmented, with multinational companies updating their existing product portfolios to include non-GMO options, while specialized new entrants integrate non-GMO certification into their core business strategies.
Key Report Takeaways
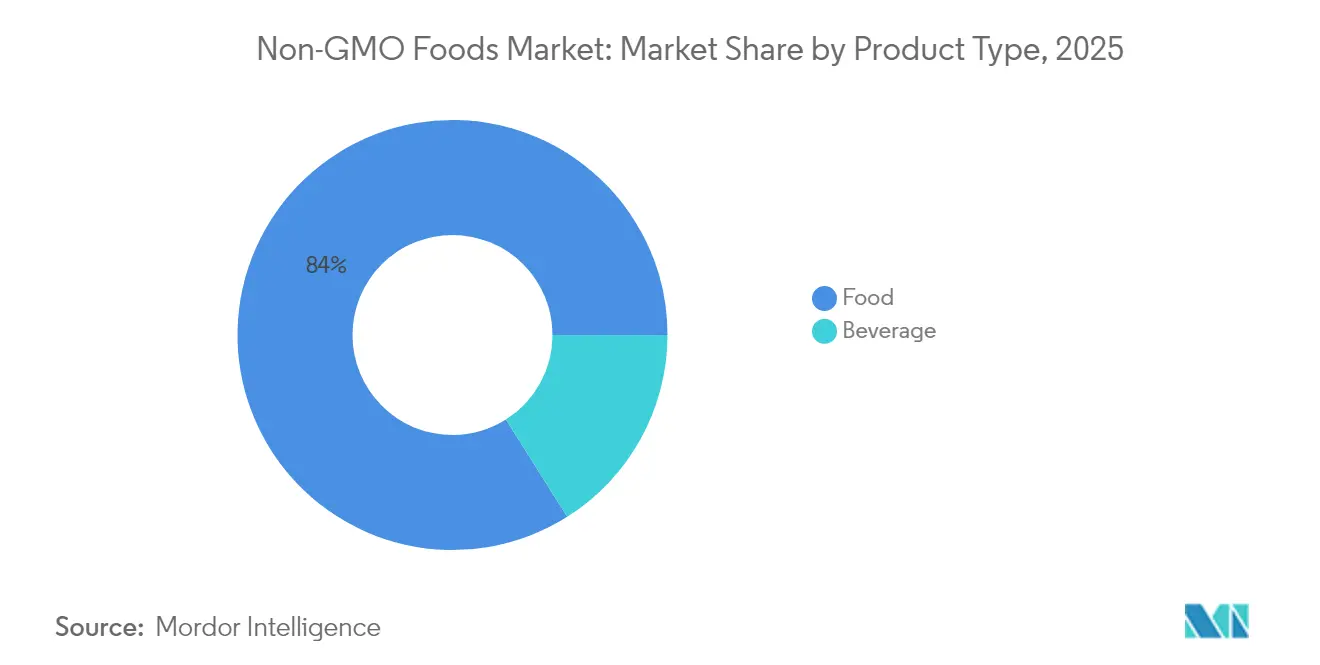
- By product category, food captured 83.96% of 2025 revenue, while beverages are projected to expand at a 6.55% CAGR through 2031.
- By category, conventional items held 69.35% of the non-GMO foods market share in 2025; organic is projected to grow at 7.38% CAGR to 2031.
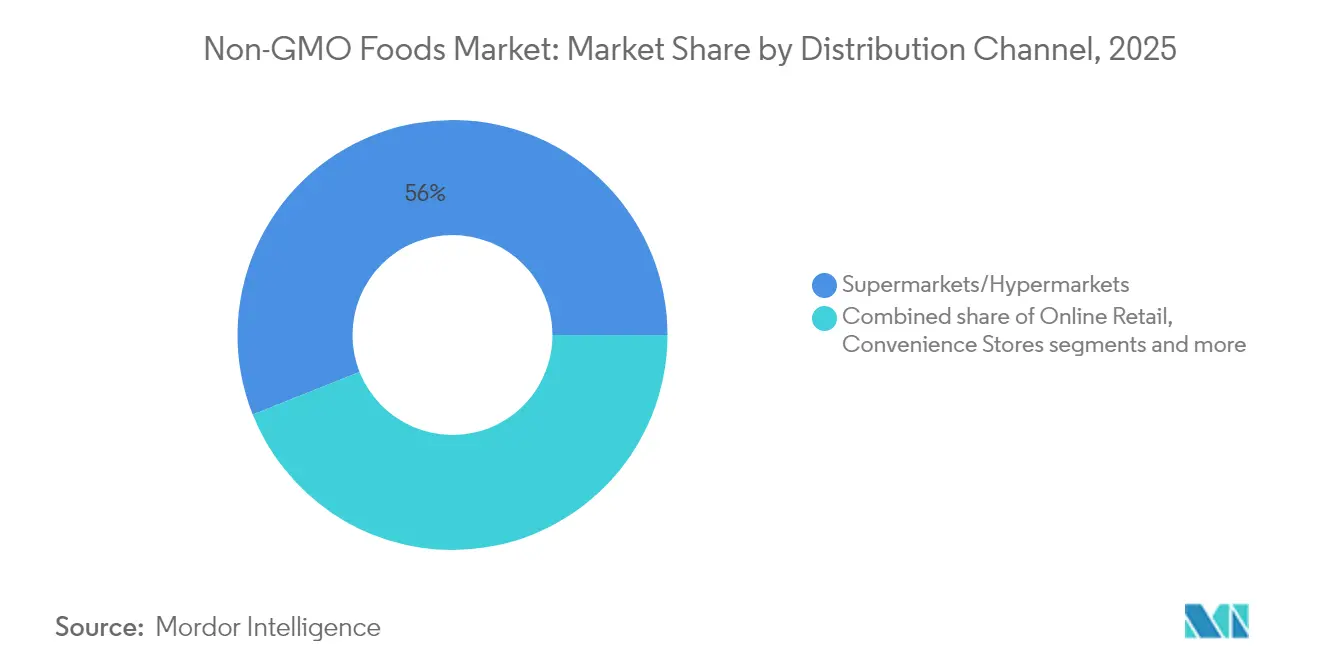
- By distribution channel, supermarkets and hypermarkets accounted for 56.02% share of the non-GMO foods market size in 2025, whereas online retail shows the fastest pace at 6.85% CAGR.
- By geography, North America led with a 39.62% share in 2025; Asia-Pacific is forecast to deliver a 6.05% CAGR to 2031.
Note: Market size and forecast figures in this report are generated using Mordor Intelligence’s proprietary estimation framework, updated with the latest available data and insights as of 2026.
Global Non-GMO Foods Market Trends and Insights
Drivers Impact Table*
| DRIVER | (~) % IMPACT ON CAGR FORECAST | GEOGRAPHIC RELEVANCE | IMPACT TIMELINE |
|---|---|---|---|
| Growing demand for clean label products | +1.2% | Global, with North America and Europe leading adoption | Medium term (2-4 years) |
| Rapid growth of plant-based non-GMO proteins | +0.9% | North America, Europe, Asia-Pacific urban centers | Long term (≥ 4 years) |
| Mandatory GMO-labeling roll-outs in new economies | +0.8% | Asia-Pacific, Latin America, emerging European markets | Short term (≤ 2 years) |
| E-commerce enabling direct-to-consumer niche brands | +0.7% | Global, with highest impact in digitally mature markets | Medium term (2-4 years) |
| Expanding organic and natural food market | +0.6% | North America, Europe, affluent Asia-Pacific segments | Long term (≥ 4 years) |
| Increase in food allergies and intolerances | +0.5% | Global, with concentrated impact in developed markets | Long term (≥ 4 years) |
| Source: Mordor Intelligence | |||
Growing demand for clean label products
Consumer demand for clean-label products is significantly boosting the global market for non-GMO foods. A 2024 Food Insights survey revealed that 36% of American respondents actively seek products labeled as "Natural," "Organic," or "Healthy" when shopping [1]Source: Food Insights, "2024 IFIC Food and Health Survey," foodinsight.org. This growing trend is pushing major food companies to reformulate their offerings. For example, General Mills and Kraft Heinz have committed to removing synthetic colors and additives from their products by 2027. Non-GMO sourcing has become a key standard for achieving broader clean-label attributes, such as organic, free-from, and minimally processed, which help build consumer trust. Transparent labeling not only enhances brand credibility but also alleviates health concerns, driving growth in this category. This trend is particularly strong among health-conscious consumers and millennials, who are increasingly prioritizing transparency and quality in their food choices.
Rapid growth of plant-based non-GMO proteins
The growing popularity of plant-based non-GMO proteins is significantly driving the growth of the non-GMO foods market. Regulatory advancements and improvements in supply chain processes further support this trend. For instance, in June 2025, the FDA issued draft guidance on labeling standards for plant-based alternatives, which has helped reduce consumer confusion and fostered greater trust, leading to increased repeat purchases [2]Source: Food and Drug Administration, "Draft Guidance for Industry: Labeling of Plant-Based Alternatives to Animal-Derived Foods," fda.gov. Manufacturers are now focusing on using identity-preserved proteins such as soy, pea, and chickpea, which allow them to make dual claims of being non-GMO and plant-based. This strategy not only appeals to health-conscious consumers but also enables companies to position their products at premium price points, boosting profit margins. Growing investments in traceable and certified supply chains are creating significant entry barriers for new competitors.
Mandatory GMO-labeling rollouts in new economies
The introduction of mandatory GMO-labeling laws in emerging markets is driving significant growth in the non-GMO foods industry. Many countries are adopting regulatory frameworks similar to the USDA’s National Bioengineered Food Disclosure Standard, which is helping to raise consumer awareness about genetically modified ingredients [3]Source: Federal Register, "National Bioengineered Food Disclosure Standard; Annual Review of the List of Bioengineered Foods," federalregister.gov. This increased awareness is pushing companies to adapt their supply chains to meet non-GMO standards before these regulations are fully enforced. Businesses that act early often gain a competitive edge by securing prime shelf space and building consumer trust. For instance, Eden Foods (U.S.) has maintained non-GMO supply chains for years, which has helped the company establish strong brand loyalty and expand into newly regulated markets. This trend is creating a dual advantage: regulatory-driven market growth and enhanced brand reputation through proactive compliance and transparency.
Increase in food allergies and intolerances
The increasing prevalence of food allergies and intolerances is driving a surge in demand for non-GMO food products. Many consumers perceive genetically modified ingredients as potential triggers for allergies or digestive issues. According to the Food and Agricultural Organization (FAO), around 220 million people globally suffer from food allergies [4]Source: Food and Agricultural Organization, "Food safety and quality," fao.org. This growing health concern is pushing consumers to prioritize products with simpler and cleaner ingredient lists, often using non-GMO labels as a sign of safety and transparency. Companies like Enjoy Life Foods, known for its allergy-friendly, non-GMO verified snacks, and MadeGood, which offers allergen-free, school-safe products, have successfully tapped into this trend. By addressing these health sensitivities, non-GMO manufacturers not only expand their market appeal but also cater to a broader demand for “free-from” claims, which include gluten-free, nut-free, and artificial additive-free options.
Restraints Impact Analysis*
| RESTRAINT | (~) % IMPACT ON CAGR FORECAST | GEOGRAPHIC RELEVANCE | IMPACT TIMELINE |
|---|---|---|---|
| Premium pricing versus GMO and conventional foods | -0.8% | Global, with the highest impact in price-sensitive markets | Short term (≤ 2 years) |
| Cross-contamination risk in grain handling chains | -0.6% | Global, concentrated in major grain-producing regions | Medium term (2-4 years) |
| Lack of awareness in developing regions | -0.4% | Emerging markets in Asia-Pacific, Africa, Latin America | Long term (≥ 4 years) |
| Yield and supply chain limitations | -0.5% | Global, with regional variations based on agricultural infrastructure | Medium term (2-4 years) |
| Source: Mordor Intelligence | |||
Premium pricing versus GMO and conventional foods
While organic soy and corn prices have dropped in 2025, the price gap between verified non-GMO and conventional food products remains a major barrier for broader consumer adoption, particularly for shoppers on tight budgets. Non-GMO products typically involve higher production and certification costs, which lead to premium pricing that many cost-conscious consumers find difficult to afford. A 2024 survey by Salsify revealed that 39% of shoppers prioritize affordability when making purchasing decisions. To address this challenge, companies are adopting various strategies to make non-GMO products more accessible. These include buying ingredients in bulk to reduce costs, simplifying packaging to cut expenses, and streamlining operations to improve efficiency. For example, brands like Simple Truth (Kroger) and Thrive Market have introduced private-label non-GMO product lines that offer high-quality, clean-label options at more competitive prices.
Cross-contamination risk in grain handling chains
The risk of cross-contamination in grain handling chains remains a major challenge for the growth of the non-GMO foods market. Ensuring the purity of non-GMO grains requires strict measures, such as physical segregation, validated testing protocols, and robust chain-of-custody controls, as outlined by USDA guidelines. These requirements place significant financial and operational pressures on grain elevators, storage facilities, and processors, many of which still rely on mixed systems that handle both GMO and non-GMO grains. Companies like Lundberg Family Farms and Pipeline Foods, which have invested in dedicated non-GMO processing lines or adopted vertical integration, have managed to reduce contamination risks and strengthen their brand reputation. However, these efforts come with higher fixed costs, making it difficult for smaller players to compete.
*Our forecasts treat driver/restraint impacts as directional, not additive. The impact forecasts reflect baseline growth, mix effects, and variable interactions.
Segment Analysis
By Product Type: Food Dominance Drives Market Foundation
In 2025, food accounted for 83.96% of the non-GMO market revenues, largely driven by the popularity of snack bars, dairy alternatives, and infant nutrition products. Consumers continue to pay a premium for verified non-GMO labels, particularly in categories like fruits, vegetables, and minimally processed staples, as these are closely associated with natural and healthier options. However, processed meat substitutes and confectionery face greater scrutiny, with buyers demanding clear traceability to justify higher prices.
The non-GMO beverage segment, while smaller in market share, is expected to grow at a faster CAGR of 6.55% through 2031. This growth is fueled by innovation in products like kombucha, fortified water, and ready-to-drink coffee, which are gaining traction among health-conscious consumers. Many of these beverages now use certified non-GMO cane sugar, aligning with cleaner energy claims and appealing to a broader audience. Companies focusing on cold-chain e-commerce are emphasizing freshness, which not only boosts profit margins but also strengthens customer loyalty.


By Category: Conventional Leadership Amid Organic Acceleration
Conventional products made up 69.35% of the market revenue in 2025, showing that non-GMO verification alone satisfies the health concerns of most consumers. These products offer manufacturers flexibility in sourcing, allowing them to adapt to supply chain challenges, such as weather-related disruptions, without losing their non-GMO status. This adaptability makes conventional non-GMO items a practical and reliable choice for both producers and consumers. However, the demand for organic non-GMO products is steadily increasing as more consumers prioritize sustainability and environmental responsibility.
The organic segment of the non-GMO foods market is growing at a faster rate, with a 7.38% CAGR, as consumers increasingly associate organic products with higher quality and environmental benefits. Organic products, particularly in categories like children’s snacks and beverages, are achieving higher profit margins, making them an attractive option for manufacturers looking to diversify their portfolios. Retailers are also leveraging this trend by creating dedicated shelf spaces for non-GMO and organic products, which helps differentiate these items from standard goods and encourages impulse purchases.
By Distribution Channel: Traditional Retail Stability Versus Digital Innovation
Supermarkets and hypermarkets remain the dominant distribution channels for non-GMO foods, contributing 56.02% of the market's revenue in 2025. These physical retail outlets play a crucial role in driving consumer purchases through strategies like in-store sampling, eye-catching end-cap displays, and the use of third-party certification seals that build trust. Many retailers are adopting smart labeling technologies, such as QR codes, to provide consumers with detailed product information, including farm origins and ingredient sourcing. This approach not only enhances transparency but also helps physical stores compete with the growing popularity of online platforms.
At the same time, the online channel is expanding rapidly, with a projected growth rate of 6.85% CAGR, driven by younger consumers who prioritize convenience, detailed product descriptions, and clean-label assurances. E-commerce platforms are increasingly offering curated non-GMO product bundles, combining foods with complementary items like supplements or eco-friendly household products to encourage larger purchases. Omnichannel strategies are also gaining traction, as retailers integrate online and offline experiences through options like click-and-collect services. These hybrid models allow retailers to reduce delivery costs while maintaining the educational and convenience benefits of online shopping, positioning them to capture a growing share of the non-GMO market.
Geography Analysis
North America remains a key player in the non-GMO foods market, contributing 39.62% of total sales in 2025. The region benefits from well-organized retail networks that make non-GMO products easily accessible to consumers. Canada plays a pivotal role by supplying verified wheat and soy to both domestic and Asian markets, strengthening its position in the global supply chain. According to the Organic Trade Association, in the United States, organic product sales reached USD 71.6 billion in 2024, highlighting a consumer base that prioritizes transparency in product labeling . This growing awareness and demand for clean-label products encourage households to incorporate verified non-GMO staples into their daily consumption, further driving market growth in the region.
Asia-Pacific is rapidly emerging as the fastest-growing region in the non-GMO foods market, with a projected CAGR of 6.05%. A rising middle-class population and supportive government policies fuel the region's growth. For example, China offers a strong foundation for manufacturers to integrate non-GMO claims into their organic product lines. Japan's MIDORI program, which aims to achieve 1 million hectares of organic cultivation by 2050, is expected to significantly boost the local supply chain. India is experiencing a surge in online searches for non-GMO and organic products, indicating that digital platforms are playing a crucial role in educating consumers and driving demand for such products across the region.
Europe shows mature yet resilient demand as sustainability priorities anchor purchase decisions despite inflationary pressure. Traceability regulations like EU 2018/848 drive uniform labeling, giving European producers an advantage when exporting to newer regulatory regimes. Eastern European processors increasingly position non-GMO corn and sunflower oil to serve Middle Eastern and Southeast Asian food service chains, widening geographic diversification within the non-GMO foods market. Latin America supplies vital inputs particularly non-GMO cane sugar and tropical fruit concentrates to both Northern and Asian manufacturers, amplified by February 2025 certification of the first large-scale non-GMO sugar chain in Brazil.

Competitive Landscape
The non-GMO foods market is moderately fragmented and large multinational companies are updating their existing product portfolios to include non-GMO options, while smaller, specialized players are building their brands around non-GMO certifications from the start. For example, Del Monte has achieved USDA process verification for its mainstream vegetable products, showcasing how established brands use certifications to modernize their offerings. On the other hand, innovative direct-to-consumer brands like Our Little Rebellion collaborate with local farms to create compelling sourcing stories, which help them attract higher consumer engagement and justify premium pricing in the market.
Technology is becoming a key differentiator in the non-GMO foods market. Advanced tools such as blockchain for traceability, AI-driven contamination alerts, and IoT-enabled moisture sensors are providing companies with real-time insights across the supply chain. For instance, Flowers Foods’ acquisition of Simple Mills for USD 795 million demonstrates how larger companies are integrating smaller, non-GMO-certified brands to combine scale with agility. Similarly, Hershey’s USD 750 million purchase of LesserEvil highlights the growing interest of major confectionery players in health-focused products, signaling that better-for-you snacking is expected to drive growth in the overall market.
Opportunities for growth remain in areas such as functional beverages, immune-boosting snacks, and nutrient-rich children’s foods. Companies that establish vertically integrated supply chains with identity-preserved grains and sugars are better positioned to capture market share as regulatory requirements become stricter. Strong traceability systems not only help mitigate risks but also serve as a powerful marketing tool, giving early adopters a competitive edge. This creates higher entry barriers for new players while reinforcing the market position of established companies in the medium term.
Non-GMO Foods Industry Leaders
-
Amy's Kitchen, Inc.
-
Nestlé SA
-
Kellanova
-
Tyson Foods
-
The Hain Celestial Group
- *Disclaimer: Major Players sorted in no particular order

Recent Industry Developments
- April 2025: Celebrity entrepreneur Khloé Kardashian introduced Khloud Protein Popcorn, a non‑GMO, gluten‑free, kosher snack delivering 7 g of protein per serving in target stores.
- March 2025: SunOpta launched its Non-GMO Project Certified, SOWN Oat Cold Foaming Cream, available at Amazon and Sprouts Farmers Market stores. Oat Cold Foaming Cream is the perfect solution that brings the café experience to kitchens nationwide.
- April 2024: Kroma announced the release of its new Super Ramen. It is the first-ever gluten-free bone broth ramen, featuring slow-cooked bone broth and gluten-free mung-bean noodles for a lower glycemic index and fewer carbs, and is free of non-GMO ingredients and preservatives.


Global Non-GMO Foods Market Report Scope
The non-GMO foods mean food products that contain non-genetically modified ingredients in it. The market is segmented by product type as food and beverage. The Food segment is further segmented into dairy products, baby foods and infant formula products, bakery products, confectionery products, meat and poultry products, cereals and grains, edible oil, and others. The beverage market is further segmented into non-alcoholic beverages and alcoholic beverages. By distribution channel, the market is segmented into hypermarkets/supermarkets, convenience stores, online retail stores, and others. The market is segmented by geography into North America, Europe, Asia Pacific, South America, and the Middle East and Africa. For each segment, the market sizing and forecasts have been done based on value (in USD million).
| Beverage | Non-Alcoholic Beverages |
| Alcoholic Beverages | |
| Food | Fruits and Vegetables |
| Dairy Products | |
| Baby Food and Infant Formula | |
| Bakery Products | |
| Confectionery Products | |
| Meat and Poultry Products | |
| Cereals and Grains | |
| Edible Oils | |
| Others |
| Organic |
| Conventional |
| Supermarkets/Hypermarkets |
| Convenience Stores |
| Specialty and Health-food Stores |
| Online Retail |
| Others |
| North America | United States |
| Canada | |
| Mexico | |
| Rest of North America | |
| South America | Brazil |
| Argentina | |
| Colombia | |
| Chile | |
| Peru | |
| Rest of South America | |
| Europe | Germany |
| United Kingdom | |
| France | |
| Italy | |
| Spain | |
| Netherlands | |
| Poland | |
| Belgium | |
| Sweden | |
| Rest of Europe | |
| Asia-Pacific | China |
| Japan | |
| India | |
| Australia | |
| Indonesia | |
| South Korea | |
| Thailand | |
| Singapore | |
| Rest of Asia-Pacific | |
| Middle East and Africa | South Africa |
| Saudi Arabia | |
| United Arab Emirates | |
| Nigeria | |
| Egypt | |
| Morocco | |
| Turkey | |
| Rest of Middle East and Africa |
| By Product Type | Beverage | Non-Alcoholic Beverages |
| Alcoholic Beverages | ||
| Food | Fruits and Vegetables | |
| Dairy Products | ||
| Baby Food and Infant Formula | ||
| Bakery Products | ||
| Confectionery Products | ||
| Meat and Poultry Products | ||
| Cereals and Grains | ||
| Edible Oils | ||
| Others | ||
| By Category | Organic | |
| Conventional | ||
| By Distribution Channel | Supermarkets/Hypermarkets | |
| Convenience Stores | ||
| Specialty and Health-food Stores | ||
| Online Retail | ||
| Others | ||
| By Geography | North America | United States |
| Canada | ||
| Mexico | ||
| Rest of North America | ||
| South America | Brazil | |
| Argentina | ||
| Colombia | ||
| Chile | ||
| Peru | ||
| Rest of South America | ||
| Europe | Germany | |
| United Kingdom | ||
| France | ||
| Italy | ||
| Spain | ||
| Netherlands | ||
| Poland | ||
| Belgium | ||
| Sweden | ||
| Rest of Europe | ||
| Asia-Pacific | China | |
| Japan | ||
| India | ||
| Australia | ||
| Indonesia | ||
| South Korea | ||
| Thailand | ||
| Singapore | ||
| Rest of Asia-Pacific | ||
| Middle East and Africa | South Africa | |
| Saudi Arabia | ||
| United Arab Emirates | ||
| Nigeria | ||
| Egypt | ||
| Morocco | ||
| Turkey | ||
| Rest of Middle East and Africa | ||


Key Questions Answered in the Report
What is the current size of the non-GMO foods market?
The market is valued at USD 349.66 billion in 2026 and is set to rise to USD 440.23 billion by 2031 at a 4.72% CAGR.
Which region leads revenue generation?
North America holds 39.62% of global sales owing to mature labeling standards and high consumer awareness.
Which product segment is expanding the fastest?
Beverages show the highest growth, projected at 6.55% CAGR through 2031 as companies innovate in functional and plant-based drinks.
How significant is e-commerce for non-GMO sales?
Online retail is the fastest-growing channel, advancing at 6.85% CAGR, driven by consumers seeking detailed ingredient transparency.
Page last updated on:


