Non-Emergency Medical Transportation Market Size and Share
Market Overview
| Study Period | 2020 - 2031 |
|---|---|
| Market Size (2026) | USD 12.77 Billion |
| Market Size (2031) | USD 18.93 Billion |
| Growth Rate (2026 - 2031) | 8.23% CAGR |
| Fastest Growing Market | Asia Pacific |
| Largest Market | North America |
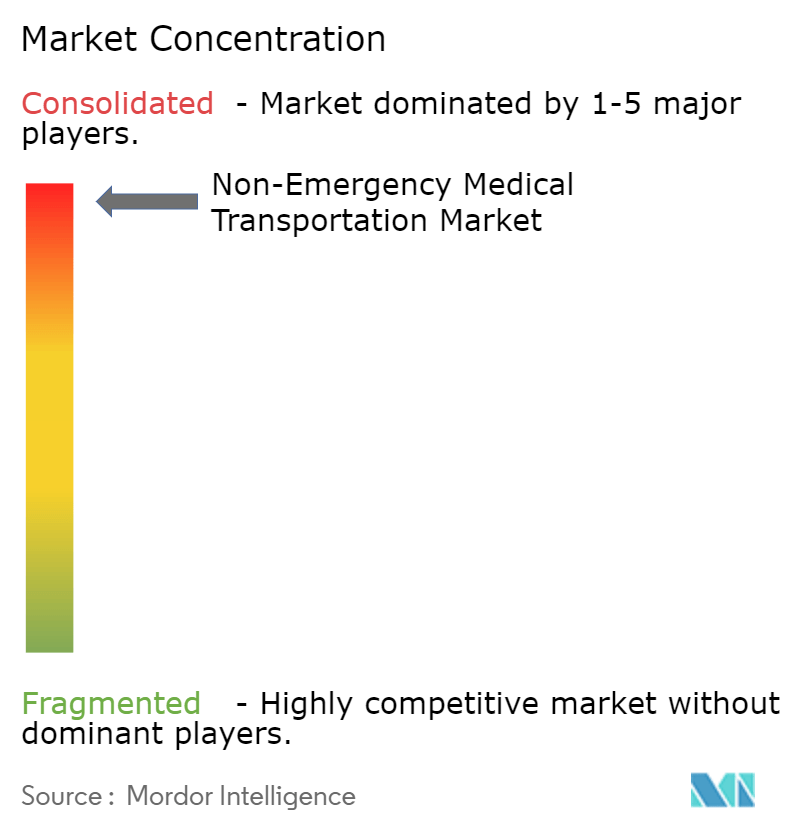
| Market Concentration | High |
Major Players *Disclaimer: Major Players sorted in no particular order Image © Mordor Intelligence. Reuse requires attribution under CC BY 4.0. | |
Non-Emergency Medical Transportation Market Analysis by Mordor Intelligence
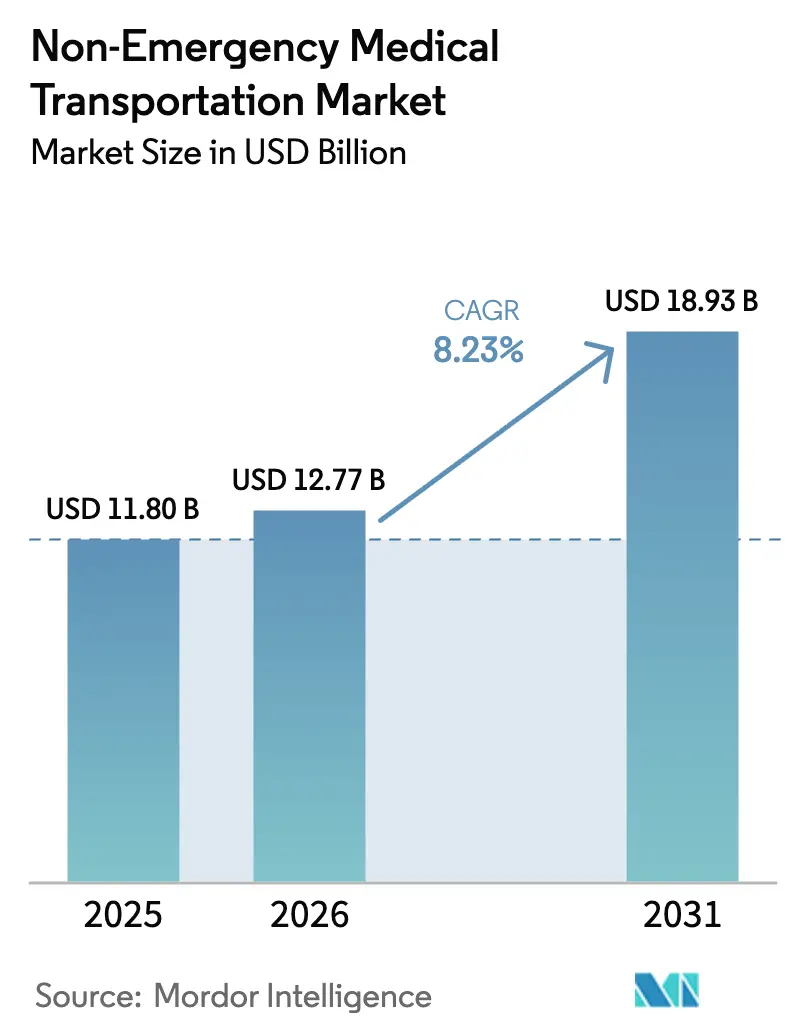
The Non-Emergency Medical Transportation market size in 2026 is estimated at USD 12.77 billion, growing from 2025 value of USD 11.80 billion with 2031 projections showing USD 18.93 billion, growing at 8.23% CAGR over 2026-2031. Robust demand comes from payers tying transportation to value-based care, states rolling out Medicaid managed-care expansions, and providers investing in digital platforms that slash no-show penalties and lift route productivity. Fleet electrification grants, notably from the Federal Transit Administration’s Low or No Emission program, accelerate the shift to battery-electric vans, lowering fuel costs and helping providers comply with emerging zero-emission mandates. Dialysis remains the single largest application, yet the mental-health segment grows fastest as coverage broadens for behavioral health visits. Consolidation is gathering pace as technology-led brokers buy regional operators to secure national reach and deeper data pools, while performance-based reimbursement rules starting in 2026 raise the bar on on-time pickup, member satisfaction, and documentation quality across the Non-Emergency Medical Transportation market.
Key Report Takeaways
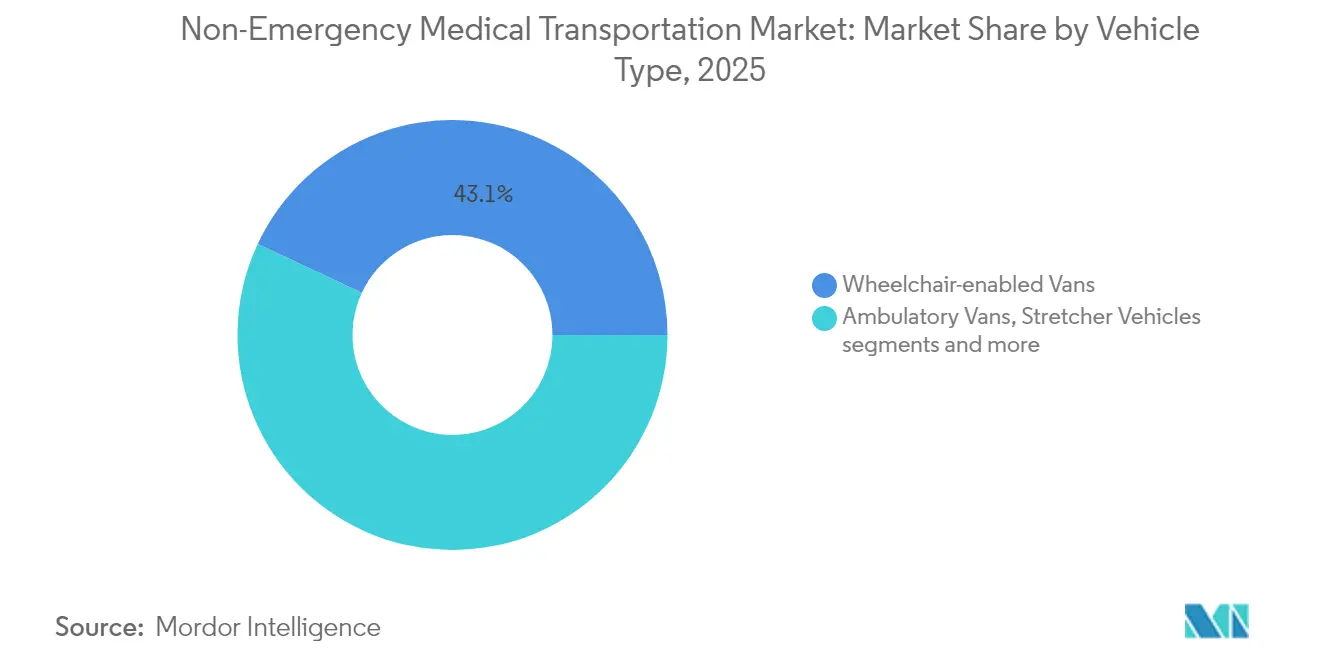
- By vehicle type, wheelchair-enabled vans led with 43.05% of the Non-Emergency Medical Transportation market share in 2025; hybrid and electric vans are projected to advance at a 9.41% CAGR to 2031.
- By payment type, Medicaid accounted for 51.72% of the Non-Emergency Medical Transportation market size in 2025, while managed care organizations are expanding at a 9.62% CAGR through 2031.
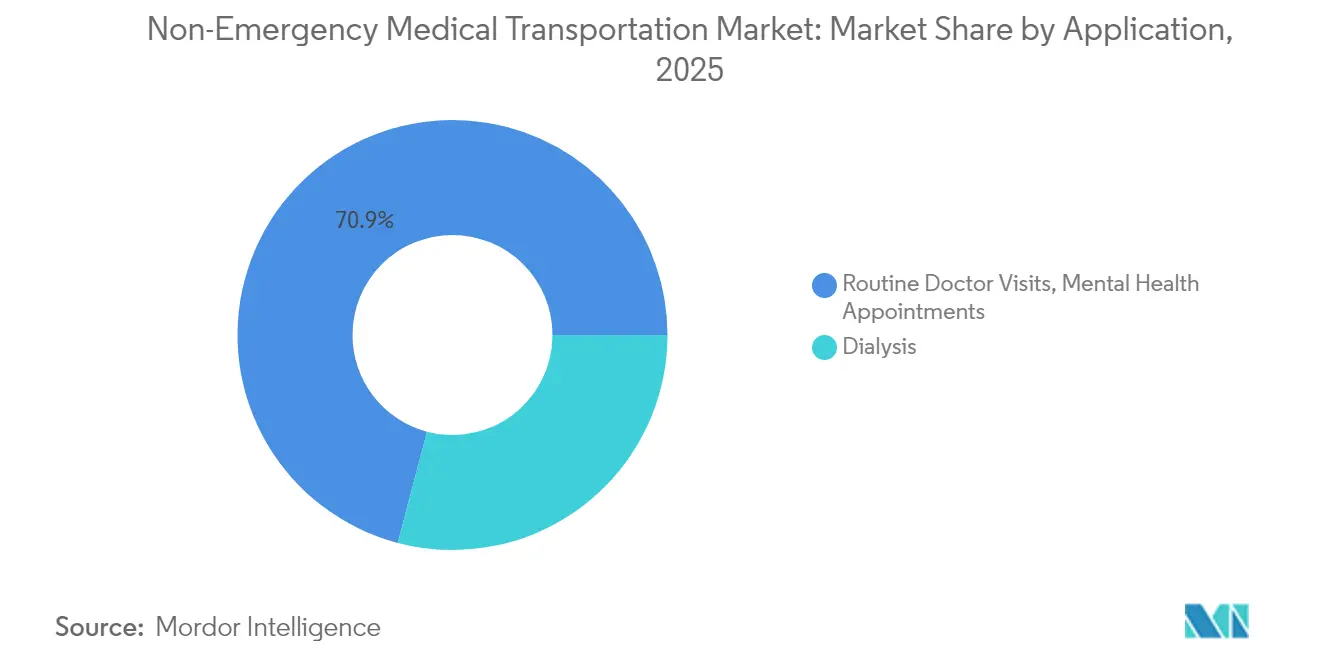
- By application, dialysis transportation represented 29.10% of the Non-Emergency Medical Transportation market size in 2025; mental-health visits record the highest forecast CAGR at 9.55% between 2026-2031.
- By end user, hospitals held 37.55% share of the Non-Emergency Medical Transportation market size in 2025, whereas home-healthcare settings are set to grow at a 9.63% CAGR to 2031.
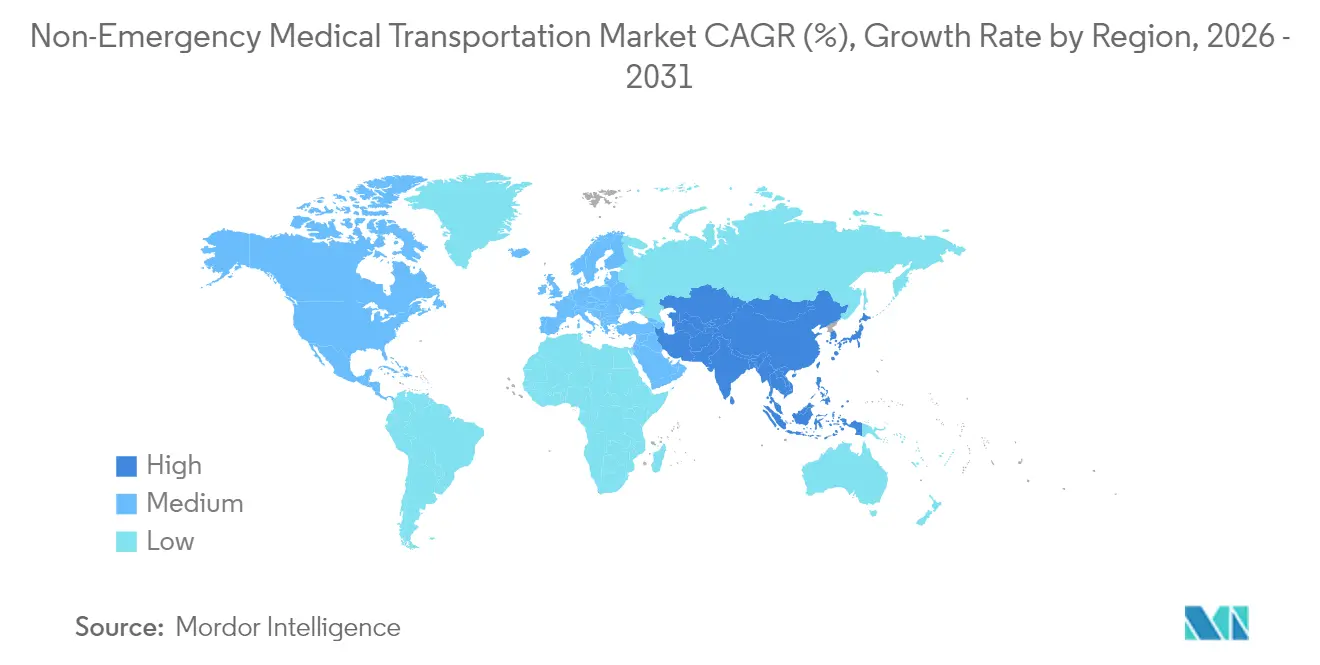
- By geography, North America captured 40.80% of revenue in 2025; Asia-Pacific is the fastest-growing region with a 9.74% CAGR through 2031.
Note: Market size and forecast figures in this report are generated using Mordor Intelligence’s proprietary estimation framework, updated with the latest available data and insights as of 2026.
Global Non-Emergency Medical Transportation Market Trends and Insights
Drivers Impact Analysis*
| Driver | (~) % Impact on CAGR Forecast | Geographic Relevance | Impact Timeline |
|---|---|---|---|
| Growing elderly & chronically-ill population | +2.1% | Global, with concentration in North America & Europe | Long term (≥ 4 years) |
| Expansion of Medicaid Managed-Care coverage | +1.8% | North America, primarily United States | Medium term (2-4 years) |
| Savings from lower "missed-appointment" penalties | +1.2% | Global | Short term (≤ 2 years) |
| Rise of digital dispatch & ride-hail integrations | +1.5% | North America & Europe, expanding to APAC | Medium term (2-4 years) |
| State value-based reimbursement pilots (2025+) | +0.9% | United States, select states | Long term (≥ 4 years) |
| Fleet electrification grants for zero-emission NEMT | +0.7% | North America & Europe | Long term (≥ 4 years) |
| Source: Mordor Intelligence | |||
Growing Elderly & Chronically-Ill Population
Demand rises as adults aged 65+ book 3.2 times more medical visits than younger cohorts, prompting payers to bundle rides into Medicare Advantage plans that now cover transportation in 36% of offerings[1]Source: Centers for Medicare & Medicaid Services, “Medicare Advantage Supplemental Benefits Data,” cms.gov . Dialysis patients—travelling three times weekly—illustrate predictable, high-frequency usage that lets brokers optimize routing while keeping vehicles near treatment centers. Forty-three US states have added supplemental rides for special-needs plans, and route-level analytics reveal lower emergency-department use among seniors with reliable transport. The Non-Emergency Medical Transportation market therefore benefits from demographic inevitability coupled with payer incentives that reward preventive-care adherence.
Expansion of Medicaid Managed-Care Coverage
States continue migrating from fee-for-service to capitated programs that embed transport within broader care coordination. CMS now requires appointment wait-time standards, compelling brokers to certify adequate fleets and dispatch capacity. As Medicaid eligibility ballooned in 2024-2025, managed-care organizations became the quickest-growing payer group, driving technology adoption for real-time trip authorization and satisfaction dashboards. The model aligns financial incentives, as brokers receive bonuses when ride punctuality lifts preventive-care attendance and reduces no-shows.
Rise of Digital Dispatch & Ride-Hail Integrations
AI-powered platforms route vehicles dynamically, integrate with Lyft and Uber APIs, and deliver mobile alerts to members, cutting average call-center volume by 30% while elevating on-time pickup to 96% lyft.com. Health plans gain live visibility into ride status, and standardized data flows simplify claims. With brokers now processing millions of rides yearly, cloud dispatch achieves scale economies that smaller manual operators cannot match, deepening competitive differentiation across the Non-Emergency Medical Transportation market.
State Value-Based Reimbursement Pilots (2025+)
Pilots in Arizona, Virginia, and Washington link transport fees to patient satisfaction, adherence, and documented health outcomes. Providers meeting targets earn shared savings, spurring investment in GPS proof-of-service, electronic verification, and satisfaction texting. Value metrics dovetail with CMS’s 2026 rule that embeds transportation experience into Medicaid quality reporting, making technology prowess a prerequisite for long-term contracting.
Restraints Impact Analysis*
| Restraint | (~) % Impact on CAGR Forecast | Geographic Relevance | Impact Timeline |
|---|---|---|---|
| Heightened fraud-and-abuse audits on NEMT claims | -1.3% | Global, with focus on United States | Short term (≤ 2 years) |
| Driver shortages & high turnover rates | -1.8% | Global, acute in North America & Europe | Medium term (2-4 years) |
| CMS 2026 rule linking pay to patient-satisfaction KPIs | -0.9% | United States | Medium term (2-4 years) |
| Rising commercial auto-insurance premiums | -1.1% | Global | Short term (≤ 2 years) |
| Source: Mordor Intelligence | |||
Heightened Fraud-and-Abuse Audits on NEMT Claims
Many states now cut prior-authorization windows from 10 business days to 7 calendar days, forcing providers to invest in electronic verification systems that track pickup, drop-off, and mileage for up to six years. Oregon and New York adopted mandatory driver-certification schemes, increasing compliance overhead. Although these steps curb waste, they impose upfront costs that squeeze margins, particularly among small fleets lacking capital for audit-ready platforms.
Driver Shortages & High Turnover Rates
Annual turnover exceeds 64% in several US markets, compounded by competition from parcel delivery and rideshare firms that promise flexible hours. NEMT roles require wheelchair-securement training, HIPAA familiarity, and background checks, shrinking the qualified labor pool. Providers respond with “earn-while-you-learn” programs, retention bonuses, and flexible splits, yet recruiting lags growth, constraining capacity during peak dialysis runs and fueling wage inflation.
*Our forecasts treat driver/restraint impacts as directional, not additive. The impact forecasts reflect baseline growth, mix effects, and variable interactions.
Segment Analysis
By Vehicle Type: Electrification Accelerates Fleet Modernization
Wheelchair-enabled vans already capture 43.05% share of the Non-Emergency Medical Transportation market, reflecting the centrality of mobility-aid access. In value terms, this equals the largest slice of the Non-Emergency Medical Transportation market size in 2025. Demand remains resilient because every Medicaid broker contract mandates ADA-compliant service levels. Over the forecast horizon, hybrid and battery-electric vans outpace all other classes at a 9.41% CAGR, supported by USD 1.5 billion in Low or No Emission grants that offset up to 75% of incremental purchase costs.
Fleet operators note that electric vans trim total cost of ownership thanks to lower maintenance and energy expenses, while satisfying state zero-emission procurement policies. Stretcher vehicles stay essential for inter-facility transfers but grow modestly as telehealth substitutes some hospital follow-ups. Ambulatory sedans see margin pressure from ride-hail competition, encouraging brokers to switch sedans into variable-cost networks while allocating owned assets toward specialized wheelchair and stretcher trips.


By Payment Type: Managed Care Organizations Drive Innovation
Medicaid still commands 51.72% of the Non-Emergency Medical Transportation market share, yet managed-care entities record the swiftest gains. Their 9.62% CAGR reflects ongoing rollouts of statewide brokerage contracts that tie per-member-per-month transport budgets to quality metrics. The Non-Emergency Medical Transportation market size attached to managed care is projected to nearly double by 2031 as more states transfer NEMT oversight to health plans.
Capitated models let plans integrate ride data into care-management analytics, flagging members who miss appointments, and autopopulating future trips. Private insurers have begun adding transport in employer policies to curb absenteeism, while Medicare Advantage plans move from negligible coverage to 36% inclusion in 2025. This widening payer mix diversifies revenue and spreads technology investments across larger trip volumes, boosting platform ROI
By Application: Mental-Health Transportation Gains Momentum
Dialysis retains 29.10% of the Non-Emergency Medical Transportation market size given thrice-weekly treatment schedules and strict timetables. However, mental-health visits outpace every other clinical category, advancing at a 9.55% CAGR as states elevate behavioral-health parity and reimburse tele-behavioral consult follow-ups requiring in-person lab, imaging, or counseling. The Non-Emergency Medical Transportation market increasingly supports integrated primary-behavioral care clusters, where a single trip chains multiple stop-offs, maximizing fleet utilization.
Further growth stems from Medicaid waivers that earmark transport funds for substance-use disorder programs and crisis-stabilization units. Brokers now train drivers in de-escalation to handle passengers with psychiatric conditions and collaborate with care teams to ensure safe hand-offs. As preventive psychiatry scales, predictable recurring appointments will mirror dialysis in frequency, anchoring baseline ride demand.
By End User: Home-Healthcare Settings Transform Service Delivery
Hospitals still account for 37.55% of revenue but face steady share dilution as hospital-at-home programs proliferate. Home-healthcare settings, growing at 9.63% CAGR, rely on NEMT providers not only to ferry patients to outpatient labs but also to transport nurses and therapists carrying portable diagnostics. The Non-Emergency Medical Transportation market thus evolves into a bidirectional service, where caregivers as often as patients occupy seats.
Assisted-living centers outsource transport to reduce fleet costs, securing guaranteed-hour contracts that offer brokers steady utilization. Nursing homes maintain inter-facility transfers, yet tele-rehab reduces some physical-therapy trips. Individual self-pay patients, helped by Medicare Advantage supplemental rides, book through app-based portals, illustrating how consumerization permeates a once broker-centric model.
Geography Analysis
North America holds 40.80% of the Non-Emergency Medical Transportation market, anchored by Medicaid’s statutory transport benefit and Medicare Advantage’s rapid supplemental uptake. CMS’s 2026 satisfaction-linked payment rule is expected to push digital adoption even further, setting service benchmarks that may become global templates. Canada integrates rides through provincial health authorities, while rural US states pilot senior-ride programs such as Montana’s GoGoGrandparent initiative.
Asia-Pacific is the fastest-expanding region at 9.74% CAGR as governments invest in universal coverage, telehealth, and hospital-at-home pilots. Japan deploys coordinated transport corridors for its super-aging population, Australia funds mobility vouchers in remote territories, and Southeast Asian nations leverage private capital to build dispatch networks alongside new clinic clusters. The ability to leapfrog legacy brokerage with cloud platforms positions Asia-Pacific to adopt AI dispatch from day one, realigning competitive dynamics within the Non-Emergency Medical Transportation market.
Europe advances steadily, supported by national health systems that classify transport as a social determinant of health. Zero-emission zones in urban cores accelerate electric-fleet uptake, with subsidies tying grant eligibility to carbon-reduction pledges. South America and the Middle East & Africa show emergent demand where urbanization drives clinic concentration. Multilateral development banks assist in funding coordinated mobility projects, often bundling NEMT into broader primary-care access programs.

Competitive Landscape
The market remains moderately fragmented, yet consolidation quickens as scale unlocks technology ROI and purchasing leverage. MTM’s October 2024 purchase of Access2Care extended coverage to every US state and lifted revenue by 25%, while earlier absorption of Veyo broadened ride volumes to 8.6 million annually[2]Source: MTM, Inc., “MTM Completes Access2Care Acquisition,” mtm-inc.net . Modivcare maintains its national footprint through contracted fleets and reported stable 2024 guidance, signalling healthy cash flow for platform upgrades.
Technology differentiation now separates leaders from laggards. AI routing shaved Prairie Hills Transit’s operating costs while lifting completion rates to 97%. SafeRide Health’s API suite lets Medicare Advantage plans orchestrate Uber and Lyft rides, deliver push notifications, and feed satisfaction scores directly into STAR ratings dashboards. White-space opportunities persist in rural counties, prompting fleet-light models that stitch together volunteer driver programs with ride-hail capacity.
Automakers explore mobility-as-a-service by piloting purpose-built vans outfitted for medical transport, seeking to monetize vehicle data and after-sales services. New entrants including GoGoGrandparent and Alivi target niche senior or Spanish-speaking sub-segments with culturally competent dispatch centers. Incumbents respond by layering telehealth equipment into vans, offering mobile vitals capture en route, and positioning themselves as integrated social-determinant partners to health plans.
Non-Emergency Medical Transportation Industry Leaders
Transdev
LineLine EMS
LogistiCare
MTM, Inc.
ModivCare
- *Disclaimer: Major Players sorted in no particular order

Recent Industry Developments
- January 2025: KelseyCare Advantage introduced a Medicare Advantage transportation benefit with SafeRide Health, using ride-matching and reminder technology to improve punctuality for Texas members
- January 2025: Sunshine Health selected Alivi as its new NEMT vendor, enabling app-based scheduling while honoring pre-existing trips
- September 2024: Curb released Curb Optima, an Autofleet-powered optimization engine that boosts fleet utilization through AI route planning.


Global Non-Emergency Medical Transportation Market Report Scope
As per the scope of the report, non-emergency medical transportation (NEMT) can be defined as a transportation service provided to individuals who are not in an emergency situation but need more assistance than a taxi service is able to provide. Service providers will be specially equipped to transport riders in wheelchairs, stretchers or with other special needs. The non-emergency medical transportation market is segmented into service type, application, and geography. By service type, the market is segmented into private-pay patient transportation, insurance-backed patient transportation, and courier services. By application, the market is segmented into dialysis, routine doctor visits, mental health related appointments, and rehabilitations. By geography, the market is segmented into North America, Europe, Asia-Pacific, and the Rest of the World. The report offers values (in USD) for the above segments.
| Wheelchair-enabled Vans |
| Ambulatory Vans |
| Stretcher Vehicles |
| Hybrid & Electric NEMT Vehicles |
| Medicaid |
| Medicare |
| Private Insurance |
| Out-of-Pocket |
| Managed Care Organizations |
| Dialysis |
| Routine Doctor Visits |
| Mental Health Appointments |
| Physical Therapy & Rehabilitation |
| Chemotherapy & Radiation Sessions |
| Specialized Testing & Imaging |
| Others |
| Hospitals |
| Nursing Care Centers |
| Assisted Living Facilities |
| Home Healthcare Settings |
| Individual Patients |
| North America | United States |
| Canada | |
| Mexico | |
| Europe | Germany |
| United Kingdom | |
| France | |
| Italy | |
| Spain | |
| Rest of Europe | |
| Asia-Pacific | China |
| India | |
| Japan | |
| South Korea | |
| Australia | |
| Rest of Asia-Pacific | |
| South America | Brazil |
| Argentina | |
| Rest of South America | |
| Middle East and Africa | GCC |
| South Africa | |
| Rest of Middle East and Africa |
| By Vehicle Type (Value) | Wheelchair-enabled Vans | |
| Ambulatory Vans | ||
| Stretcher Vehicles | ||
| Hybrid & Electric NEMT Vehicles | ||
| By Payment Type (Value) | Medicaid | |
| Medicare | ||
| Private Insurance | ||
| Out-of-Pocket | ||
| Managed Care Organizations | ||
| By Application (Value) | Dialysis | |
| Routine Doctor Visits | ||
| Mental Health Appointments | ||
| Physical Therapy & Rehabilitation | ||
| Chemotherapy & Radiation Sessions | ||
| Specialized Testing & Imaging | ||
| Others | ||
| By End User (Value) | Hospitals | |
| Nursing Care Centers | ||
| Assisted Living Facilities | ||
| Home Healthcare Settings | ||
| Individual Patients | ||
| By Geography (Value) | North America | United States |
| Canada | ||
| Mexico | ||
| Europe | Germany | |
| United Kingdom | ||
| France | ||
| Italy | ||
| Spain | ||
| Rest of Europe | ||
| Asia-Pacific | China | |
| India | ||
| Japan | ||
| South Korea | ||
| Australia | ||
| Rest of Asia-Pacific | ||
| South America | Brazil | |
| Argentina | ||
| Rest of South America | ||
| Middle East and Africa | GCC | |
| South Africa | ||
| Rest of Middle East and Africa | ||


Key Questions Answered in the Report
How big is the Non-Emergency Medical Transportation Market?
The Non-Emergency Medical Transportation Market size is expected to reach USD 12.77 billion in 2026 and grow at a CAGR of 8.23% to reach USD 18.93 billion by 2031.
What is the current Non-Emergency Medical Transportation Market size?
In 2026, the Non-Emergency Medical Transportation Market size is expected to reach USD 12.77 billion.
Who are the key players in Non-Emergency Medical Transportation Market?
Transdev, LineLine EMS, LogistiCare, MTM, Inc. and ModivCare are the major companies operating in the Non-Emergency Medical Transportation Market.
Which is the fastest growing region in Non-Emergency Medical Transportation Market?
Asia Pacific is estimated to grow at the highest CAGR over the forecast period (2026-2031).
Which region has the biggest share in Non-Emergency Medical Transportation Market?
In 2026, the North America accounts for the largest market share in Non-Emergency Medical Transportation Market.
What years does this Non-Emergency Medical Transportation Market cover, and what was the market size in 2025?
In 2025, the Non-Emergency Medical Transportation Market size was estimated at USD 12.77 billion. The report covers the Non-Emergency Medical Transportation Market historical market size for years: 2019, 2020, 2021, 2022, 2023 and 2024. The report also forecasts the Non-Emergency Medical Transportation Market size for years: 2026, 2027, 2028, 2029, 2030 and 2031.
Page last updated on:


