Next Generation 3D Display Market Size and Share
Market Overview
| Study Period | 2020 - 2031 |
|---|---|
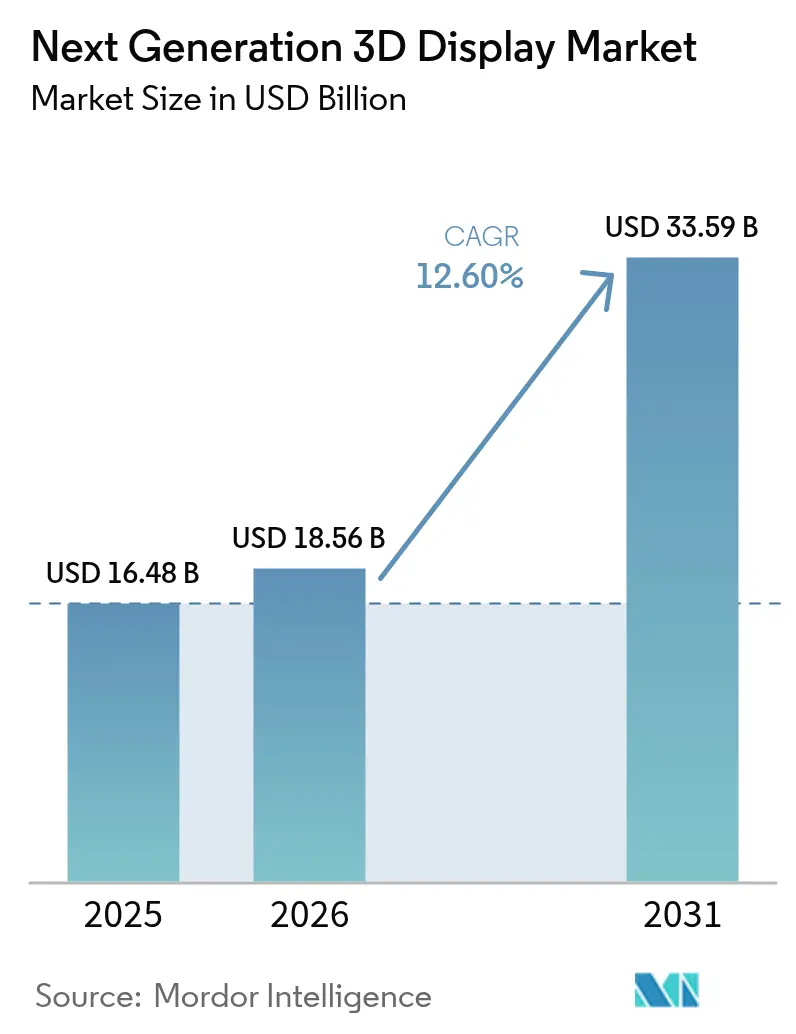
| Market Size (2026) | USD 18.56 Billion |
| Market Size (2031) | USD 33.59 Billion |
| Growth Rate (2026 - 2031) | 12.60% CAGR |
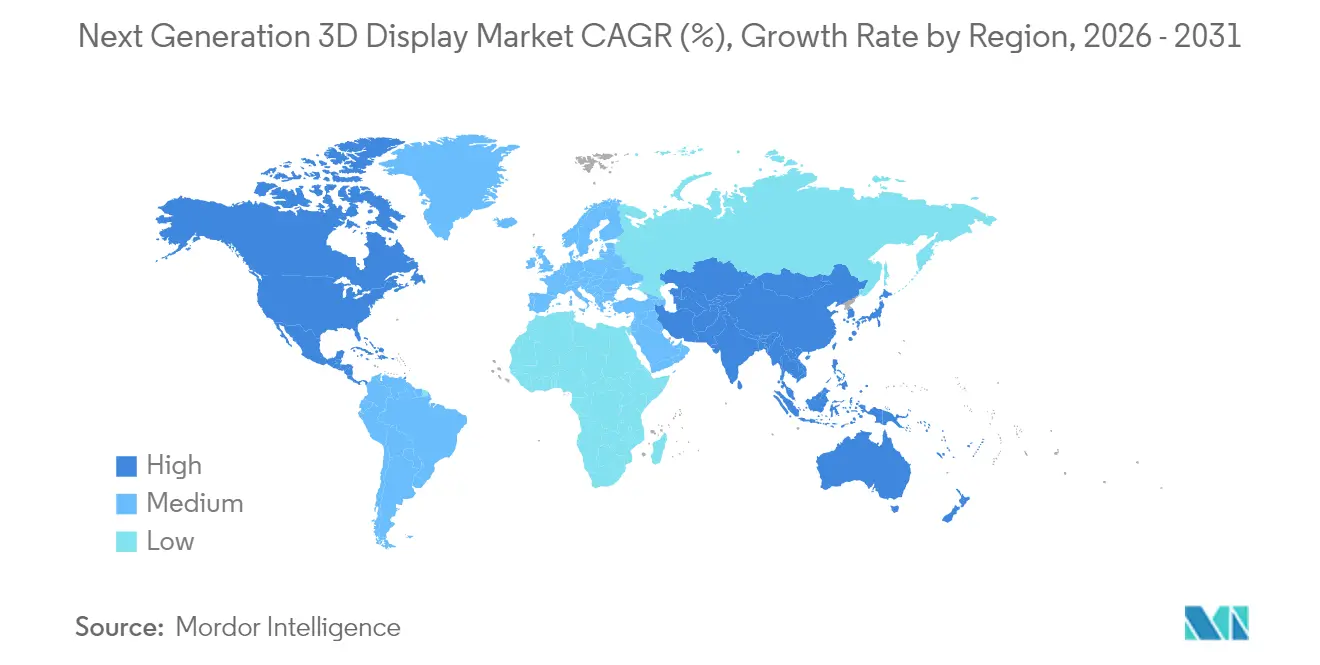
| Fastest Growing Market | Asia Pacific |
| Largest Market | Asia Pacific |
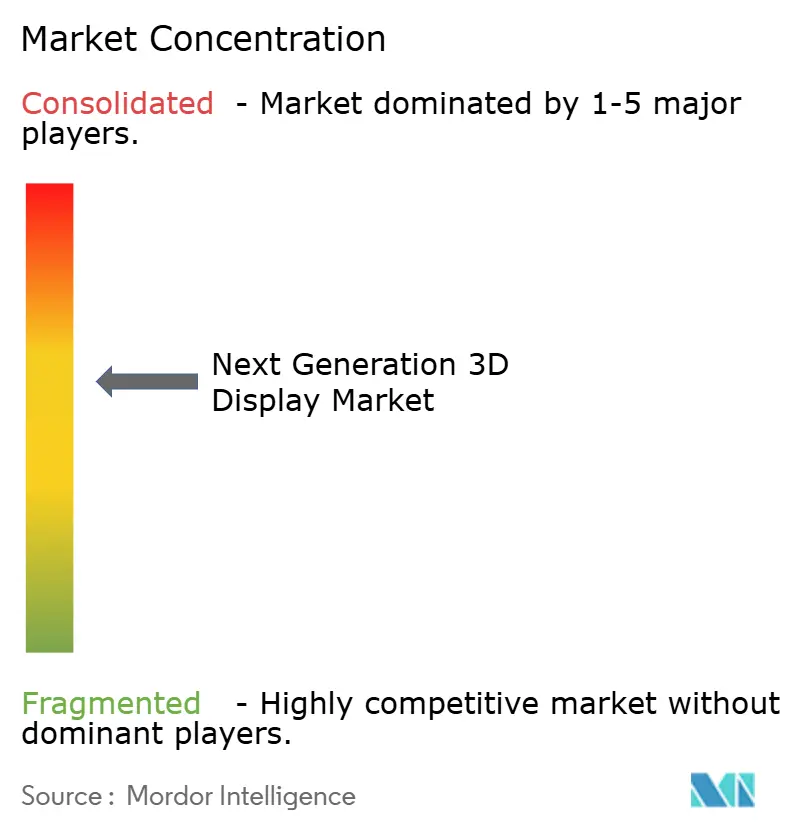
| Market Concentration | Medium |
Major Players *Disclaimer: Major Players sorted in no particular order Image © Mordor Intelligence. Reuse requires attribution under CC BY 4.0. | |
Next Generation 3D Display Market Analysis by Mordor Intelligence
The next generation 3D display market size was valued at USD 16.48 billion in 2025 and estimated to grow from USD 18.56 billion in 2026 to reach USD 33.59 billion by 2031, at a CAGR of 12.60% during the forecast period (2026-2031). This growth reflects sustained demand for immersive visualization across automotive, medical, and consumer devices. Heightened pixel-density goals above 5,000 PPI, the shift toward glasses-free volumetric formats, and rapid OLED-on-silicon capacity additions are widening the application scope of the next generation 3D display market. Suppliers that solve the vergence-accommodation conflict while maintaining brightness over 10,000 nits are capturing design-wins in head-up displays, surgical workstations, and premium tablets. The sector’s expansion also benefits from AI-generated holographic pipelines that slash asset-creation costs and shorten content lead times.
Key Report Takeaways
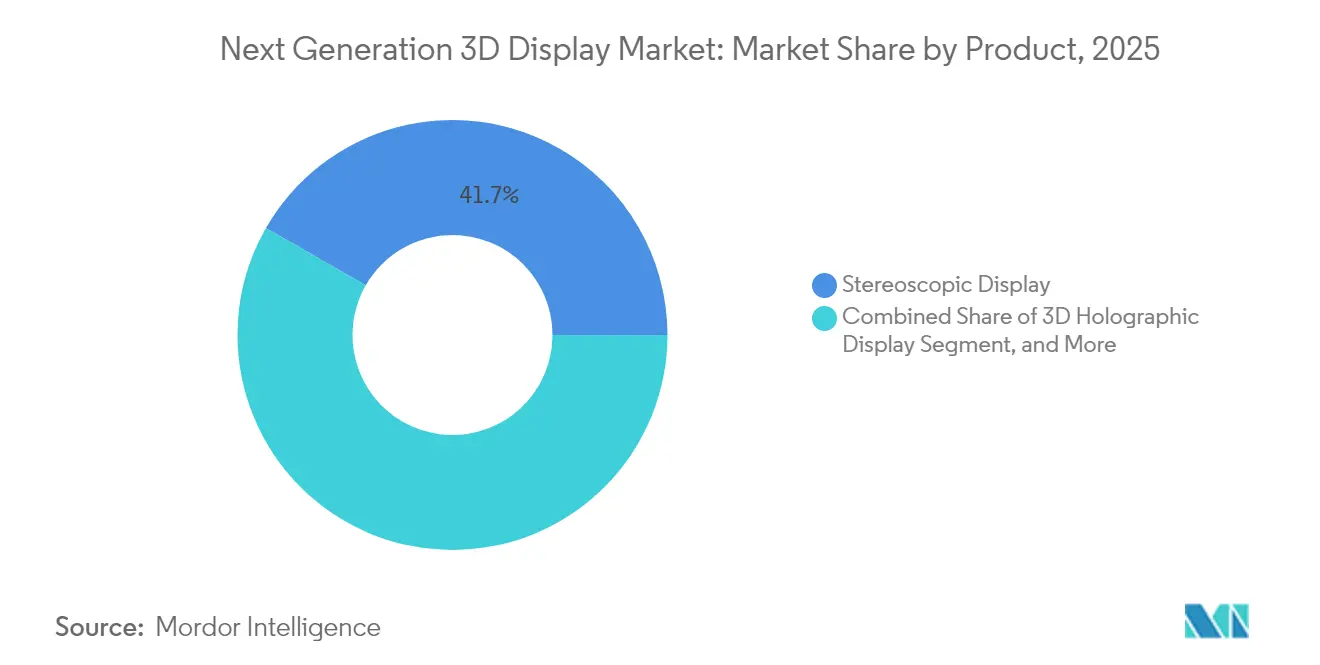
- By product type, stereoscopic displays led with a 41.72% share of the next-generation 3D display market in 2025; volumetric displays are forecast to expand at a 14.25% CAGR through 2031.
- By technology, LED retained 33.74% share of the next-generation 3D display market size in 2025, while OLED-on-silicon is growing at 13.38% to 2031.
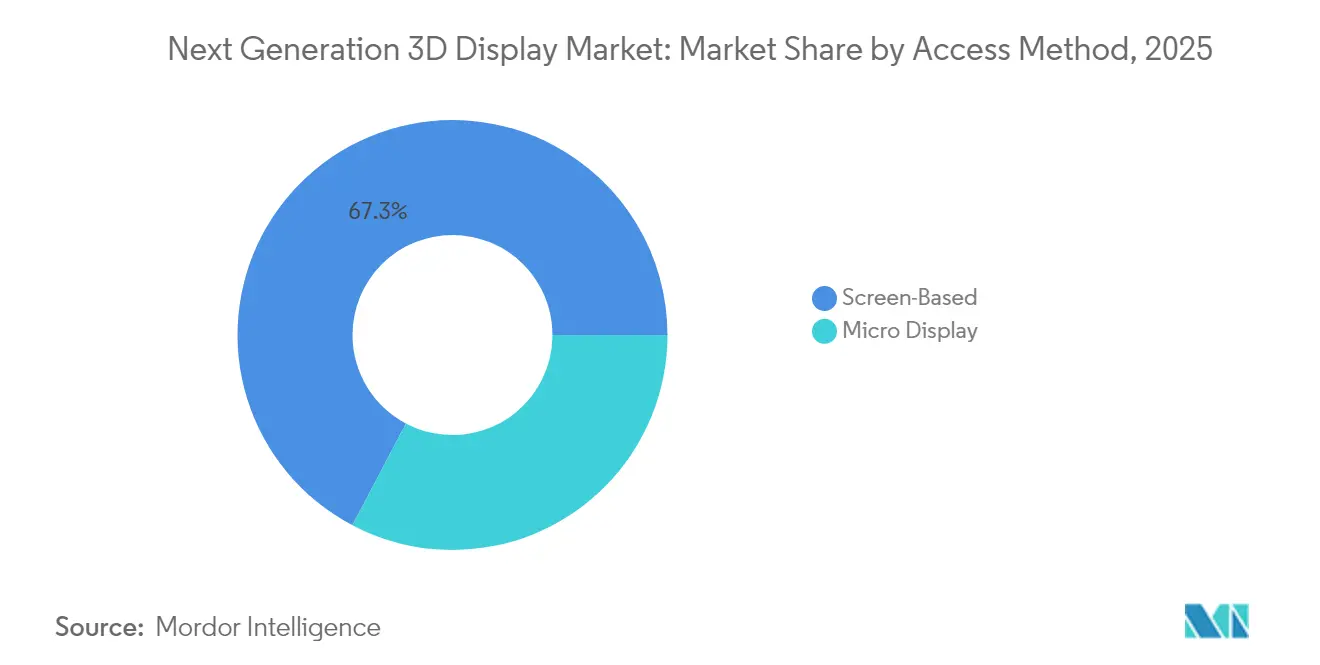
- By access method, screen-based configurations captured 67.29% revenue in 2025; micro-displays are advancing at a 13.98% CAGR.
- By end-user industry, consumer electronics contributed 48.10% of 2025 revenue, whereas medical applications are expanding at a 13.12% CAGR.
- By geography, Asia Pacific generated 46.31% of global revenue in 2025 and is progressing at a 12.74% CAGR.
Note: Market size and forecast figures in this report are generated using Mordor Intelligence’s proprietary estimation framework, updated with the latest available data and insights as of 2026.
Global Next Generation 3D Display Market Trends and Insights
Drivers Impact Analysis*
| Driver | (~) % Impact on CAGR Forecast | Geographic Relevance | Impact Timeline |
|---|---|---|---|
| Rapid adoption in consumer electronics | 2.8% | Global, with concentration in Asia Pacific and North America | Short term (≤ 2 years) |
| Automotive HUD integration wave | 2.4% | North America, Europe, and Asia Pacific core markets | Medium term (2-4 years) |
| Advancements in OLED and MicroLED technologies | 2.1% | Global, led by Asia Pacific manufacturing hubs | Medium term (2-4 years) |
| Emergence of AI-generated holographic content ecosystems | 1.6% | North America and Europe early adopters, Asia Pacific scale-up | Long term (≥ 4 years) |
| Government incentives for domestic micro-display fabs | 1.4% | United States, European Union, Japan, South Korea, India | Medium term (2-4 years) |
| Growing use in tele-medicine surgical planning | 1.2% | North America and Europe primary, expanding to Middle East | Medium term (2-4 years) |
| Source: Mordor Intelligence | |||
Rapid Adoption in Consumer Electronics
Flagship smartphones and tablets now ship with autostereoscopic screens that deliver gaming, e-commerce, and video-chat depth cues without the need for accessories, thereby boosting perceived value in saturated premium segments. Samsung moved more than 2 million glasses-free 3D tablets during H1 2024, validating the mass-market potential of the next generation 3D display market. Chinese brands are integrating light-field modules into foldables, counting on 15–20% price premiums above USD 1,000 devices to offset panel costs. The cost gap between 2D and 3D displays is narrowing as OLED-on-silicon volume scales, enabling tier-1 vendors to treat 3D capability as a default spec for high-end hardware. Retailers report higher conversion rates for 3D product views, incentivizing content ecosystems that, in turn, expand hardware demand.
Automotive HUD Integration Wave
Head-up displays are graduating from planar overlays to volumetric projections that place navigation arrows 10 meters ahead, eliminating driver refocus lag and cutting false-dismiss rates for ADAS alerts. Continental’s March 2024 holographic HUD demonstration met ISO 26262 safety requirements and secured program adoption by a German luxury marque. Bosch and its partner OEMs plan to launch micro-LED HUDs by model year 2027, aligning display roadmaps with the rollouts of Level-2+ autonomy. Eye-tracking modules dynamically adjust hologram depth within 10 ms, which demands neural-accelerated controllers and propels silicon-level innovation. These advances reinforce the next-generation 3D display market as a core enabler of safety-critical cockpit experiences.
Advancements in OLED and MicroLED Technologies
LG Display’s tandem OLED reached mass production in Q2 2024, doubling brightness while extending lifetime, and permitting outdoor-readable 3D signage for transit hubs. IEEE IEDM prototypes hit 5,100 PPI in December 2024, removing the screen-door effect that once limited headsets.[1]IEEE Staff, “Micro-LED Display Technology Advances,” IEEE.ORG OLED-on-silicon delivers sub-1 µs response, critical for low-latency augmented-reality overlays that must align virtual objects with moving real-world scenes. Stacked RGB pixel configurations now achieve 110% DCI-P3 coverage, satisfying professional creators mastering native 3D content. As MicroLED yields improve, suppliers anticipate transferring laboratory gains into automotive HUDs by 2028, keeping the next generation 3D display market on an aggressive luminance roadmap.
Emergence of AI-Generated Holographic Ecosystems
NVIDIA added volumetric-display support to Omniverse in mid-2024, cutting conversion steps and halving render times for product designers. Google’s Project Starline entered paid enterprise trials in late 2024, showing AI depth estimation can reduce bandwidth 60% against raw volumetric feeds. Pre-trained neural radiance-field models transform 2D photos into 3D assets, extending catalog depth for display owners. Microsoft integrated holographic streaming into Azure, offloading compute to cloud GPUs and enabling lightweight client devices. This software momentum solidifies the content-side foundation of the next generation 3D display market.
Restraints Impact Analysis*
| Restraint | (~) % Impact on CAGR Forecast | Geographic Relevance | Impact Timeline |
|---|---|---|---|
| Lack of 3D content standards | -1.8% | Global, affecting all markets uniformly | Short term (≤ 2 years) |
| High capital costs of manufacturing lines | -1.5% | Global, concentrated in new market entrants | Medium term (2-4 years) |
| Occupational-health concerns on VAC conflict | -0.9% | Europe and North America regulatory focus | Long term (≥ 4 years) |
| Supply-chain dependency on rare-earth phosphors | -0.7% | Global, with acute impact in regions without domestic rare-earth refining | Medium term (2-4 years) |
| Source: Mordor Intelligence | |||
Lack of 3D Content Standards
With ISO/IEC MPEG-I Part 12 still in draft, manufacturers maintain proprietary pipelines spanning multi-view video, mesh streaming, or light-field encoding. This fragmentation raises production costs 40–60% and slows release cadences, damping device uptake despite robust hardware innovation. SMPTE’s 2024 interoperability report remains voluntary, leaving major studios tied to vendor-specific mastering approaches. Streaming platforms struggle to auto-match content with display capabilities because depth-map metadata remains inconsistent, forcing manual curation. Until a consensus codec emerges, the next generation 3D display market faces an availability bottleneck that tempers near-term household penetration.
High Capital Costs of Manufacturing Lines
A single OLED-on-silicon or MicroLED fab line demands USD 500 million, excluding working capital, keeping barriers high and slowing supply diversification. SEMI reported 24-month lead times for advanced lithography tools in July 2024, which delays capacity additions even at well-funded incumbents.[2]SEMI Analysts, “Semiconductor Equipment Lead Times Report,” SEMI.ORG Yield rates below 70% for sub-10 µm MicroLED arrays elevate unit costs, confining early sales to defense and medical niches. While U.S. and European chip-act subsidies offset some risk, reimbursement cycles lag commercialization goals, creating a two-year supply-demand gap. New entrants, lacking scale economics, struggle to warrant multi-hundred-million-dollar investments, limiting competition in the next generation 3D display market.
*Our forecasts treat driver/restraint impacts as directional, not additive. The impact forecasts reflect baseline growth, mix effects, and variable interactions.
Segment Analysis
By Product: Volumetric Displays Gain Traction
Volumetric displays are forecast to expand at 14.25% annually through 2031, making them the fastest-growing slice of the next-generation 3D display market. Laboratory breakthroughs, such as Light Field Lab’s 28-billion-pixel SolidLight pilot, have confirmed commercial viability in retail showcases. Multiple-viewer visibility without glasses reduces fatigue and opens collaborative design, medical imaging, and entertainment scenarios. Stereoscopic formats, despite retaining 41.72% revenue in 2025, face usage-time limits due to accommodative stress studies, which may tilt procurement toward volumetric options. Static volumetric units support radiologists who rotate CT datasets in free space, enhancing anomaly detection compared to 2D monitors. Meanwhile, head-mounted stereoscopic displays stay relevant in gaming and training, where cost ceilings dictate sub-USD 50 panel premiums.
Although holographic tablets remain compute-intensive, edge AI accelerators promise battery-friendly operation by 2027. Automotive OEMs are experimenting with free-space volumetric dashboards to replace conventional clusters, seeking to enhance spatial awareness at highway speeds. Retailers deploy floor-standing volumetric kiosks to display lifelike products without inventory, advancing experiential commerce. Collectively, these deployments propel volumetric formats into mainstream segments of the next generation 3D display market.


By Technology: OLED-on-Silicon Advances Rapidly
OLED-on-silicon shipments are projected to grow at a 13.38% rate through 2031, as near-eye demand in AR headsets, pilot helmets, and surgical scopes accelerates. Pixel-level dimming delivers infinite contrast, crucial for overlaying bright outdoor scenes in aviation and construction. LED panels kept 33.74% of 2025 revenue by dominating stadium-scale walls, yet face pixel-density ceilings that OLED-on-silicon surpasses. MicroLED prototypes now match OLED fidelity while offering burn-in resistance, positioning the technology as a long-term successor once yield climbs. Liquid-crystal variants linger in cost-sensitive digital signage, though narrow viewing angles limit collaborative 3D sessions and cap their influence on the next generation 3D display market.
Foldable tablets utilize flexible OLED substrates to provide 3D depth on large canvases, seamlessly merging portability with spatial immersion. Tandem OLEDs that reach 10,000 nits enable sunlight-readable automotive HUDs without auxiliary reflectors, simplifying optics stacks and reducing cabin heat load. Digital Light Processing rear-projection televisions, once a staple of budget big-screen gaming, are exiting the market as flat-panel advances nullify their size-to-cost edge. Collectively, these shifts consolidate OLED-on-silicon’s lead while keeping MicroLED on the strategic roadmap.
By Access Method: Micro-Displays Accelerate
Micro-displays are expanding at 13.98% CAGR on the back of enterprise AR glasses that must weigh under 150 grams to ensure all-day comfort. By contrast, screen-based systems retained 67.29% of 2025 installations, excelling in living-room TVs and signage, where multi-viewer needs are most prevalent. Gallium-nitride backplanes are improving defect density, enabling micro-display pixel pitches of less than 5 µm while maintaining brightness above 3,000 nits. Automotive architectures blend driver-specific micro-displays for HUDs with shared large screens for passenger infotainment, balancing cost and experience across use cases. Defense programs, including helicopter helmet upgrades, require micro-displays that resist 20 g of vibration and operate within a temperature range of –40 °C to 55 °C, creating profitable niches within the next-generation 3D display market.
Educational institutions are adopting lightweight AR headsets for hands-on training in welding, medical anatomy, and aircraft maintenance, capitalizing on the safe rehearsal environment provided by spatial overlays. Meanwhile, screen-based displays maintain their dominance in collaborative boardrooms, where 85-inch panels enable teams to annotate 3D CAD files without the need for individual headsets. The twin-track adoption pattern keeps both access methods integral to overall market expansion.
By End-User Industry: Medical Segment Expands
Medical applications are projected to grow at a rate of 13.12% through 2031, as minimally invasive surgery increasingly relies on depth-accurate endoscopic views. The FDA cleared a holographic surgical planning system in March 2024, highlighting the clinical acceptance of 3D visualization. Tele-surgery pilots now stream stereoscopic feeds across 5G networks, enabling expert surgeons to guide procedures on other continents with a latency of less than 150 ms. Consumer electronics, however, still accounted for 48.10% of 2025 revenue, with the integration of 3D features across smartphones, gaming consoles, and televisions to differentiate mature product lines. Automotive head-up displays integrate holographic depth cues, supporting assisted-driving features that elevate safety and justify higher trim-level pricing.
Industrial quality-control cells utilize 3D monitors to inspect complex geometries, detecting defects that are invisible on 2D screens and thereby reducing rework costs. Retail showrooms utilize holographic podiums to display premium items without physical stock, thereby reducing logistics expenses and shrinkage risk. The education sector introduces volumetric lab kits that allow students to explore molecular structures or engine assemblies virtually, thereby improving comprehension and retention. Together, these trends diversify demand across verticals, broadening the revenue base of the next generation 3D display market.
Geography Analysis
Asia Pacific retained 46.31% of 2025 revenue and advances at a 12.74% CAGR, underpinned by South Korean and Chinese subsidies that derisk micro-display capex and sustain supply-chain scale. South Korea’s KRW 500 billion grant pool accelerates OLED-on-silicon and MicroLED pilot lines, placing domestic players at the center of global sourcing strategies. Chinese manufacturers BOE and Tianma scale capacity in Chengdu and Wuhan, reducing import dependence and pricing aggressively to gain global design-ins. Japan pivots toward industrial and medical micro-displays, leveraging precision camera and semiconductor expertise to protect margins in the next generation 3D display market.
North America is driven by the growth of automotive HUD rollouts, military AR procurement, and med-tech innovation, with U.S. defense budgets underpinning the demand for ruggedized headsets. Canada’s visual-effects cluster fuels a burgeoning 3D content ecosystem, driving local hardware sales. Europe remains anchored by German and Italian carmakers integrating holographic HUDs and by rigorous health-and-safety regulations that prioritize low-fatigue displays across workplaces. Policy support under Horizon Europe and the European Chips Act drives pilot fab investments, albeit at slower cadence than Asia Pacific.
South America sees early retail and hospitality deployments, notably in Brazil’s luxury malls where holographic kiosks elevate brand experiences. The Middle East embraces 3D screens in destination shopping centers and smart-city initiatives, backed by sovereign wealth capital. African adoption stays limited by cost and infrastructure, though South Africa and Nigeria begin corporate rollouts, positioning the continent for gradual inclusion in the next generation 3D display market.

Competitive Landscape
The next generation 3D display market shows moderate concentration, with the top five suppliers controlling 55% of 2024 revenue. Samsung and LG cross-subsidize R&D via their OLED leadership, securing automotive HUD and premium tablet sockets. Chinese competitors pursue cost leadership by localizing materials and accepting thinner margins to accelerate global share gains. Established panel firms acquire optics specialists and software studios, delivering turnkey solutions that minimize customer integration overhead.
Disruptors such as Light Field Lab and Voxon Photonics bypass panels altogether, projecting images into free space and challenging incumbent capital economics. Patent filings exceeded 1,200 in 2024 for light-field optics and AI-driven rendering, indicating an innovation race that could reshape supplier hierarchies. Standards bodies wrestle with codec convergence, but commercial rivalries slow consensus, perpetuating ecosystem fragmentation and sustaining optionality for niche players.
Industrial and military buyers create defensible sub-segments where performance and ruggedization trump cost, allowing smaller vendors to command premium margins. Medical display suppliers maintain moat-like advantages after securing FDA and ISO 13485 certifications, which elongate competitor approval timelines. Consequently, competitive intensity grows both horizontally, with panel vs. volumetric paradigms, and vertically, as suppliers integrate silicon, optics, and content stacks.
Next Generation 3D Display Industry Leaders
Avalon Holographics Inc.
Avegant Corporation
Robert Bosch GmbH
Continental Aktiengesellschaft
Samsung Electronics Co., Ltd.
- *Disclaimer: Major Players sorted in no particular order

Recent Industry Developments
- September 2024: Sony launched a spatial-reality display delivering 10,000 nits peak brightness and 5.1 µm pixel pitch to serve professional creators and medical imaging.
- August 2024: Samsung earmarked USD 300 million for OLED-on-silicon expansion at Asan, targeting a 40% capacity uplift by Q3 2026.
- June 2024: NVIDIA enabled holographic-display previews in Omniverse, cutting computational loads 50% via AI optimizations.
- May 2024: LG Display began volume output of tandem OLED panels rated at 10,000 nits for automotive tier-1 HUDs.


Global Next Generation 3D Display Market Report Scope
The Next Generation 3D Display Market encompasses advanced three-dimensional visualization technologies designed to deliver immersive, high-fidelity depth perception without relying on conventional viewing accessories. It encompasses a broad range of product categories, including holographic, volumetric, stereoscopic, and light-field displays, supported by emerging display technologies such as MicroLED, OLED, and OLEDoS. These systems are deployed across diverse access methods and end-use industries, including consumer electronics, automotive, medical imaging, aerospace and defense, industrial applications, education, and advertising, to enhance user interaction, visualization accuracy, and experiential engagement.
The Next Generation 3D Display Market Report is Segmented by Product (3D Holographic Display, Head Mounted Displays, Static Volume Displays, Light Field Displays, Volumetric Displays, Stereoscopic Displays), Technology (DLP RPTV, LED, OLED, PDP, LCD, MicroLED, OLEDoS), Access Method (Micro Display, Screen Based Display), End User Industry (Consumer Electronics, Automotive and Transportation, Medical, Aerospace and Defense, Industrial, Education and Training, Retail and Advertising), and Geography (North America, South America, Europe, Asia Pacific, Middle East, Africa). The Market Forecasts are Provided in Terms of Value (USD).
| 3D Holographic Display |
| Head Mounted Displays |
| Static Volume Displays |
| Light Field Displays |
| Volumetric Displays |
| Stereoscopic Displays |
| Digital Light Processing Rear-Projection Television (DLP RPTV) |
| Light Emitting Diode (LED) |
| Organic Light Emitting Diode (OLED) |
| Plasma Display Panel (PDP) |
| Liquid Crystal Display (LCD) |
| MicroLED |
| OLED-on-Silicon (OLEDoS) |
| Micro Display |
| Conventional/Screen Based Display |
| Consumer Electronics |
| Automotive and Transportation |
| Medical |
| Aerospace and Defense |
| Industrial |
| Education and Training |
| Retail and Advertising |
| North America | United States |
| Canada | |
| Mexico | |
| South America | Brazil |
| Argentina | |
| Rest of South America | |
| Europe | Germany |
| United Kingdom | |
| France | |
| Italy | |
| Russia | |
| Rest of Europe | |
| Asia Pacific | China |
| Japan | |
| South Korea | |
| India | |
| Australia AND New Zealand | |
| Rest of Asia Pacific | |
| Middle East | Saudi Arabia |
| United Arab Emirates | |
| Turkey | |
| Rest of Middle East | |
| Africa | South Africa |
| Nigeria | |
| Egypt | |
| Rest of Africa |
| By Product | 3D Holographic Display | |
| Head Mounted Displays | ||
| Static Volume Displays | ||
| Light Field Displays | ||
| Volumetric Displays | ||
| Stereoscopic Displays | ||
| By Technology | Digital Light Processing Rear-Projection Television (DLP RPTV) | |
| Light Emitting Diode (LED) | ||
| Organic Light Emitting Diode (OLED) | ||
| Plasma Display Panel (PDP) | ||
| Liquid Crystal Display (LCD) | ||
| MicroLED | ||
| OLED-on-Silicon (OLEDoS) | ||
| By Access Method | Micro Display | |
| Conventional/Screen Based Display | ||
| By End User Industry | Consumer Electronics | |
| Automotive and Transportation | ||
| Medical | ||
| Aerospace and Defense | ||
| Industrial | ||
| Education and Training | ||
| Retail and Advertising | ||
| By Geography | North America | United States |
| Canada | ||
| Mexico | ||
| South America | Brazil | |
| Argentina | ||
| Rest of South America | ||
| Europe | Germany | |
| United Kingdom | ||
| France | ||
| Italy | ||
| Russia | ||
| Rest of Europe | ||
| Asia Pacific | China | |
| Japan | ||
| South Korea | ||
| India | ||
| Australia AND New Zealand | ||
| Rest of Asia Pacific | ||
| Middle East | Saudi Arabia | |
| United Arab Emirates | ||
| Turkey | ||
| Rest of Middle East | ||
| Africa | South Africa | |
| Nigeria | ||
| Egypt | ||
| Rest of Africa | ||


Key Questions Answered in the Report
How large is the next generation 3D display market in 2026?
It is valued at USD 18.56 billion, and it is forecast to reach USD 33.59 billion by 2031 at a 12.60% CAGR.
Which product category is expanding fastest?
Volumetric displays are growing at a 14.25% CAGR as glasses-free viewing gains traction.
Why are OLED-on-silicon microdisplays important for augmented-reality headsets?
They deliver >5,000 PPI density, infinite contrast, and sub-1 µs response times that reduce motion-to-photon latency.
What drives Asia Pacifics leadership in 3D displays?
Subsidized capex, large-scale fabs in South Korea and China, and strong domestic demand from automotive and smartphone supply chains.
How do content-standard gaps restrain market growth?
Proprietary pipelines force creators to maintain parallel workflows, raising costs 4060% and slowing content availability.
Which vertical shows the highest growth potential besides consumer electronics?
Medical visualization leads with a 13.12% CAGR due to minimally invasive surgery and tele-surgery adoption.
Page last updated on:


