Market Overview
| Study Period | 2020 - 2031 |
|---|---|
| Forecast Data Period | 2026 - 2031 |
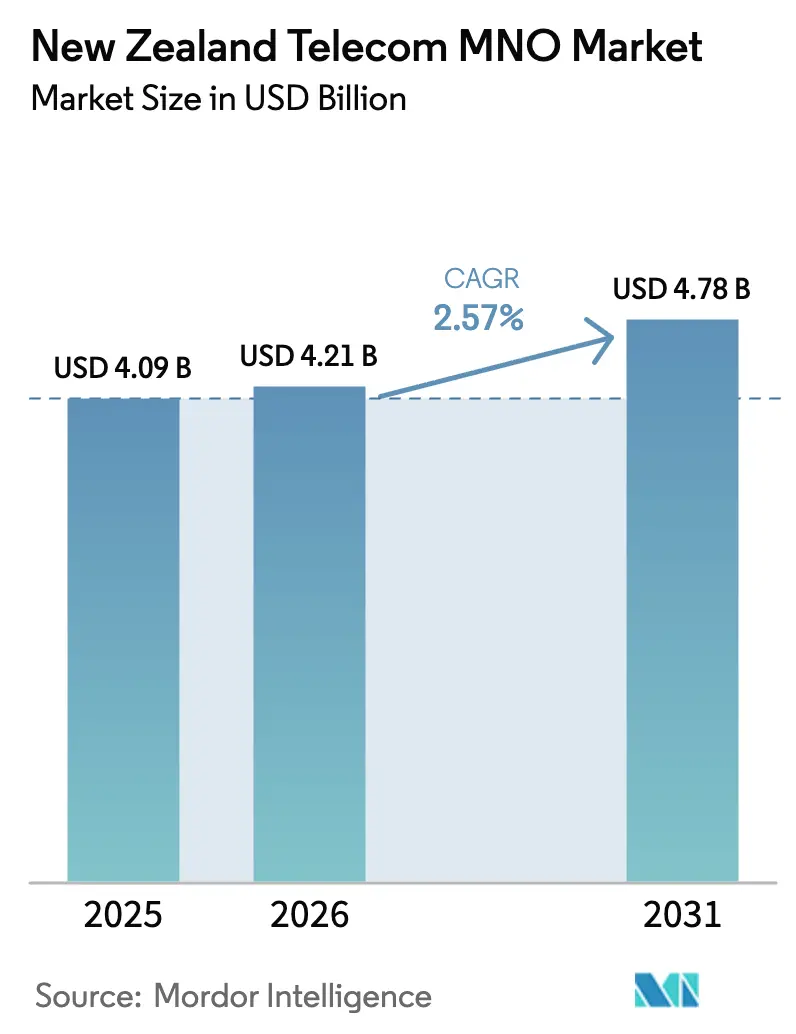
| Base Year Market Size (2025) | USD 4.09 Billion |
| Market Size (2026) | USD 4.21 Billion |
| Market Size (2031) | USD 4.78 Billion |
| Growth Rate (2026 - 2031) | 2.57% CAGR |
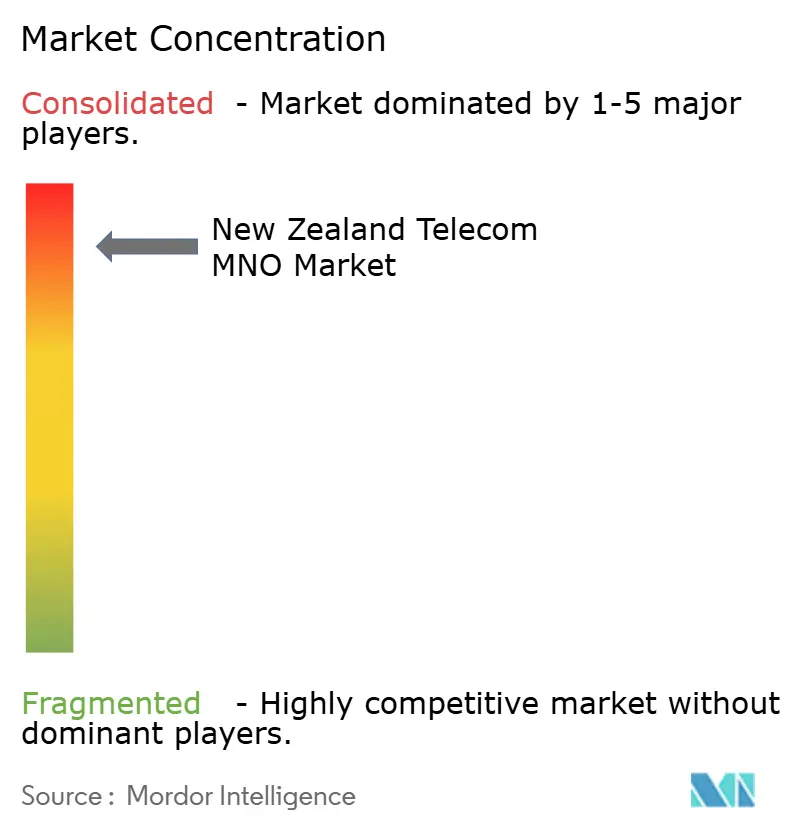
| Market Concentration | High |
Major Players *Disclaimer: Major Players sorted in no particular order Image © Mordor Intelligence. Reuse requires attribution under CC BY 4.0. | |
New Zealand Telecom MNO Market Analysis by Mordor Intelligence
The New Zealand telecom MNO market size is projected to expand from USD 4.09 billion in 2025 and USD 4.21 billion in 2026 to USD 4.78 billion by 2031, registering a 2.57% CAGR between 2026 to 2031. During this horizon, the New Zealand telecom MNO market is pivoting from voice toward data-centric revenue streams as 5G stand-alone (SA) cores reach commercial scale. Incumbent operators are concentrating investment on network slicing, ultra-low-latency services, and edge compute infrastructure so they can price beyond commoditized gigabytes. Wholesale mandates are loosening barriers for mobile virtual network operators (MVNOs), a shift that fosters new-entrant niches and raises pressure on legacy pricing. Meanwhile, resilient backhaul provided by fresh submarine capacity is pulling cloud nodes onshore, propelling enterprise adoption of hybrid deployment models. These forces confirm that the New Zealand telecom MNO market is entering a period where platform capabilities, not subscriber additions, define competitive advantage.
Key Report Takeaways
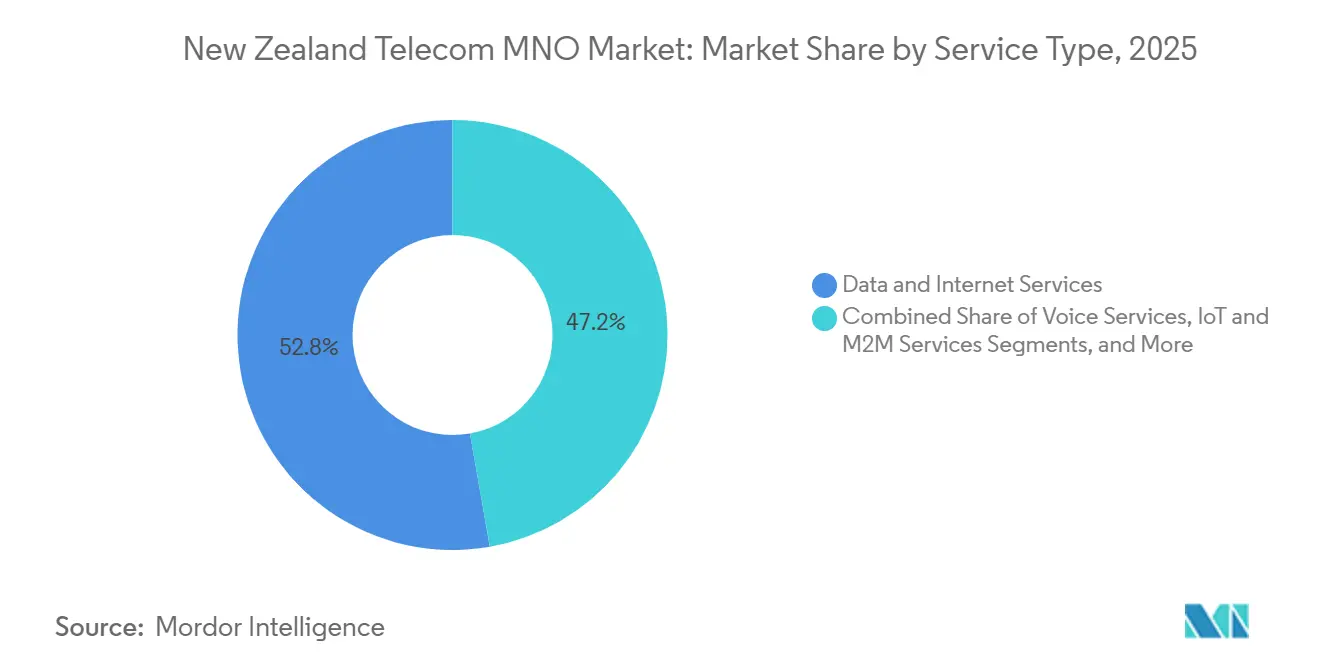
- By service type, Data and Internet Services led with 52.78% revenue share in 2025, while IoT and M2M Services are projected to expand at a 2.89% CAGR to 2031.
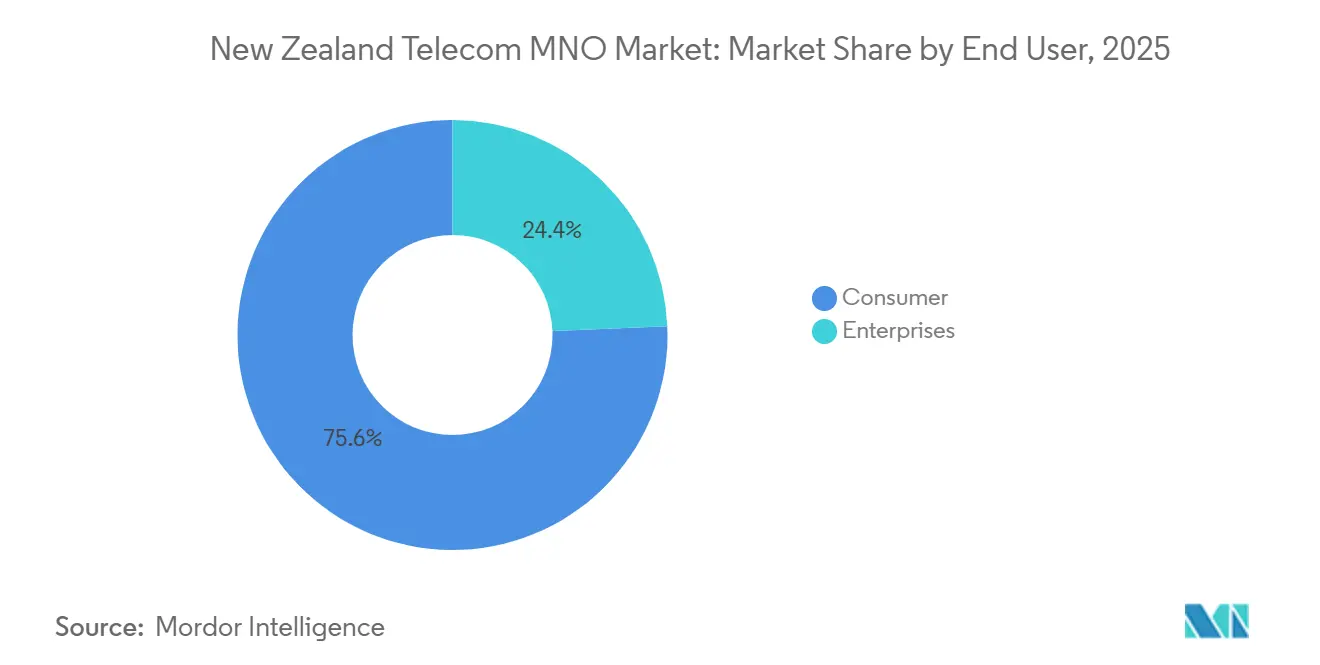
- By end-user, Consumer accounts held 75.64% of the New Zealand telecom MNO market share in 2025, whereas the Enterprise segment is forecast to advance at a 3.04% CAGR through 2031.
Note: Market size and forecast figures in this report are generated using Mordor Intelligence’s proprietary estimation framework, updated with the latest available data and insights as of 2026.
New Zealand Telecom MNO Market Trends and Insights
Drivers Impact Analysis*
| Driver | (~) % Impact on CAGR Forecast | Geographic Relevance | Impact Timeline |
|---|---|---|---|
| Commercial 5G Stand-Alone Core Rollouts Accelerate Enterprise Use-Cases | +0.6% | Auckland, Wellington, Christchurch | Medium Term (2–4 Years) |
| Rural Broadband Initiative Phase-2 Completion Boosts Coverage | +0.4% | Northland, Waikato, Bay of Plenty, Southland | Short Term (≤ 2 Years) |
| Surge in Agritech IoT Deployments for Livestock and Pasture Management | +0.5% | Waikato, Taranaki, Canterbury Plains | Medium Term (2–4 Years) |
| New Trans-Pacific Submarine Cables Reduce International IP Transit Costs | +0.3% | National, Edge Nodes in Auckland and Wellington | Long Term (≥ 4 Years) |
| Rapid Adoption of Secure SD-WAN and Edge Services by SMEs | +0.4% | Auckland and Wellington Business Districts | Short Term (≤ 2 Years) |
| Government Climate-Resilience Funding for Remote Connectivity Solutions | +0.3% | East Cape, West Coast, Fiordland | Medium Term (2–4 Years) |
| Source: Mordor Intelligence | |||
Commercial 5G Stand-Alone Core Rollouts Accelerate Enterprise Use-Cases
Spark’s decision to build its 5G SA core with Ericsson positions the operator to guarantee latency and isolate traffic slices for factories, ports, and logistics yards. CentrePort Wellington, New Zealand’s earliest private 5G site, illustrates the value of this architecture by orchestrating automated straddle carriers across 42 ha while keeping control traffic on-premises.[1]CentrePort, “Private 5G Network Deployment at Wellington Port,” centreport.co.nz SA cores separate control and user planes, trimming round-trip latency by as much as 40% and enabling real-time augmented-reality maintenance workflows. One NZ complements this capability with a self-healing network that reroutes traffic during fiber cuts, proving that automation can contain opex while safeguarding enterprise service-level objectives. Collectively, these moves reinforce why advanced core functions are becoming the anchor product in the New Zealand telecom MNO market rather than last-mile radio coverage.
Rural Broadband Initiative Phase-2 Completion Boosts Coverage
Finishing RBI-2 extended LTE and fixed-wireless service to 84,000 households and 1,200 km of state highways, eliminating many connectivity deserts.[2]Crown Infrastructure Partners, “RBI2 Completion Report,” crowninfrastructure.govt.nz The result was a foundational layer that now supports precision-agriculture platforms monitoring soil moisture and livestock well-being. Government resilience funding tied to climate events keeps momentum strong, paying for tower hardening and battery backups that sustain service during floods. Operators therefore enjoy a prepared rural addressable base for upselling 5G fixed-wireless, an option expected to lift data ARPU even as urban segments saturate. The driver’s influence on the New Zealand telecom MNO market remains immediate because a coverage gap closed today converts into incremental traffic tomorrow.
Surge in Agritech IoT Deployments for Livestock and Pasture Management
The dairy sector is embedding IoT sensors across 1.9 million ha to meet environmental targets and relieve labor shortages, triggering above-market growth for NB-IoT and LTE-M connections. Spark’s platform relays data from collars, soil probes, and weather stations, creating auditable trails for nitrogen-use compliance.[3]Fonterra, “Dairy Sector Export Revenue and IoT Adoption,” fonterra.com As more farms adopt autonomous irrigation systems, monthly data volumes per unit rise, cushioning revenue per gigabyte declines. Industry reports show agriculture as the fastest-growing vertical in domestic IoT spending, a trend that expands the New Zealand telecom MNO market footprint into primary-sector value chains. Cross-sell opportunities in cybersecurity and analytics further amplify revenue beyond connectivity itself.
Rapid Adoption of Secure SD-WAN and Edge Services by SMEs
Small and medium enterprises in Auckland and Wellington are upgrading branch connectivity with operator-managed SD-WAN overlays that route traffic directly to hyperscale clouds. Lower international transit costs, thanks to new submarine routes, cut backbone charges and make usage-based billing viable.[4]Southern Cross Cable Network, “Southern Cross NEXT Activation,” southerncrosscables.com Edge nodes hosted in domestic data centers shrink application latency, allowing operators to bundle compute along with bandwidth. This bundling enlarges the addressable pie for the New Zealand telecom MNO market because operators capture portions of IT budgets previously destined for system integrators.
Restraints Impact Analysis*
| Restraint | (~) % Impact on CAGR Forecast | Geographic Relevance | Impact Timeline |
|---|---|---|---|
| Saturated Mobile-Subscriber Base Limits Organic Growth | -0.5% | Auckland, Wellington, Christchurch | Long Term (≥ 4 Years) |
| Persistent ARPU Erosion from Price Competition and Commerce Act Oversight | -0.6% | National | Short Term (≤ 2 Years) |
| High Backhaul Cost of Remote Fiber Reduces Margin Outside Metros | -0.3% | West Coast, Fiordland, East Cape | Medium Term (2–4 Years) |
| Shortage of Licensed Fiber and 5G Radio Technicians Delays Deployments | -0.2% | National, Rural Build Zones | Medium Term (2–4 Years) |
| Source: Mordor Intelligence | |||
Persistent ARPU Erosion from Price Competition and Commerce Act Oversight
Average revenue per user slid 4% in 2024 as unlimited bundles spread across 78% of consumer plans. The Commerce Commission’s transparency scoring curtails mid-contract price hikes, forcing operators to rely on value-added services for margin recovery.[5]Commerce Commission New Zealand, “Telecommunications Monitoring Report 2024-2025,” comcom.govt.nz 2G and 3G refarming removes legacy tariff ladders, making pricing even flatter. As a result, sustaining network investment requires cost efficiency from automation, private network premiums, and wholesale arrangements. The drag on near-term revenue growth explains part of the subdued New Zealand telecom MNO market CAGR despite continued traffic expansion.
Saturated Mobile-Subscriber Base Limits Organic Growth
SIM penetration surpassed 120% in 2025, leaving scant headroom for connection-driven revenue. Churn hovers near the mid-teens and operators poach each other’s customers with device subsidies that dilute profitability. While MVNO entry promotes choice, it also segments demand and accelerates discount cycles. This maturity stage obliges carriers to pivot toward enterprise IoT, private 5G, and wholesale infrastructure where growth is still incremental. Consequently, overall expansion in the New Zealand telecom MNO market will rely more on average revenue per connection improvements than on subscriber counts.
*Our forecasts treat driver/restraint impacts as directional, not additive. The impact forecasts reflect baseline growth, mix effects, and variable interactions.
Segment Analysis
By Service Type: Data Dominance Masks Voice Decline
Data and Internet Services controlled 52.78% of the New Zealand telecom MNO market share in 2025 as consumers substituted fixed broadband with 5G fixed-wireless in coverage-gap regions. The New Zealand telecom MNO market size derived from IoT and M2M Services is forecast to expand faster than headline growth at a 2.89% CAGR, propelled by sensor adoption in dairy and logistics. Voice traffic continues to migrate to over-the-top apps bundled into plans, muting tariff differentiation. Messaging revenue shrinks in parallel, while over-the-top content packages find limited headroom given the prevalence of global streaming subscriptions.
Operators therefore pursue network-as-a-service constructs to defend relevance. Spark wholesales backhaul to rural wireless ISPs, monetizing capacity that would otherwise sit idle. One NZ’s Fastter MVNO platform aims to capture 10% of wholesale traffic, turning excess network availability into white-label revenue. Private 5G slices, billed on performance rather than volume, illustrate how the New Zealand telecom MNO market is reframing service boundaries to align with enterprise digital-transformation agendas.


By End-User: Enterprise Growth Outpaces Consumer Saturation
Consumers generated 75.64% of 2025 revenue, yet enterprise accounts are projected to pace the New Zealand telecom MNO market size with a 3.04% CAGR to 2031. Private wireless, SD-WAN, and managed IoT use cases command premium pricing and exhibit lower churn. Spark’s USD 925 million program explicitly prioritizes these services to mitigate consumer ARPU compression.
Regulatory transparency rules constrain operators from extracting additional margin on the consumer side, channeling investment toward business environments where uptime guarantees justify higher fees. Consumer innovations such as satellite-enabled emergency texting nonetheless produce enterprise spillovers, for example enabling forestry crews to maintain backup lines during disasters. This blurring of segment borders reinforces the New Zealand telecom MNO market transition from volume to value.
Geography Analysis
Urban corridors in Auckland, Wellington, and Christchurch absorb the majority of 5G capital expenditure because dense populations offer rapid payback. The New Zealand telecom MNO market in these metros benefits from high device penetration, corporate headquarters, and early enterprise 5G pilots. Rural regions previously underserved are catching up after RBI-2 and climate-resilience grants widened LTE and fixed-wireless footprints, allowing operators to upsell higher-speed tiers without waiting for fiber builds.
North Island dairy provinces such as Waikato and Taranaki are out-performing on IoT adoption, a trend that bolsters the New Zealand telecom MNO market by converting low-ARPU sensor endpoints into high-margin analytics packages. South Island’s Canterbury plains mirror this trajectory in arable farming, while West Coast and Fiordland remain challenged by rugged terrain that inflates tower backhaul costs.
International subsea upgrades with dual Auckland landing stations erase prior latency handicaps versus Sydney routes. This development attracts hyperscale cloud nodes, which in turn encourages Auckland-based multinationals to adopt domestic edge compute. The result is a geography where bandwidth demand and compute placement reinforce each other, sustaining traffic growth even as total SIM counts plateau.
Competitive Landscape
The New Zealand telecom MNO market is highly concentrated, with Spark, One NZ, and 2degrees controlling 98.4% of connections. Spark’s legacy fiber assets anchor its 38-40% slice, while One NZ’s NZD 1.8 billion modernization expanded 5G coverage and automated fault recovery. 2degrees focuses on cost-efficient spectrum refarming, completing its 3G shutdown in February 2026 to redeploy 850 MHz and 2100 MHz layers for capacity uplift.
Competition occurs less on retail pricing, which regulators scrutinize, and more on network capability. One NZ touts self-healing routing and AI-driven Network Concierge tools that let enterprises adjust slices in real time.[6]One New Zealand, “Network Modernization and Innovation Initiatives,” one.nz Spark emphasizes Ericsson-based SA core functions and industrial partnerships that showcase deterministic latency. 2degrees plays a challenger role, providing agile wholesale deals to MVNO entrants, which indirectly expands the New Zealand telecom MNO market by addressing micro-segments.
Low-earth-orbit satellite providers such as Starlink add an external threat, already holding 19% of rural broadband lines in 2025. This rivalry accelerates terrestrial rollout plans and drives collaborative initiatives such as One NZ’s satellite-texting offer with SpaceX. Consequently, strategic differentiation now hinges on integrating terrestrial and non-terrestrial assets, automating operations, and packaging vertical solutions rather than simply extending coverage.
New Zealand Telecom MNO Industry Leaders
Spark New Zealand Limited
Two Degrees Mobile Limited
One New Zealand
- *Disclaimer: Major Players sorted in no particular order

Recent Industry Developments
- February 2026: 2degrees completed its 3G shutdown, reallocating 850 MHz and 2100 MHz bands to 4G and 5G in major cities.
- December 2025: One NZ launched satellite-enabled emergency texting with SpaceX to provide backup messaging during outages.
- December 2025: One NZ unveiled Network Concierge, an AWS-based agentic AI that automates enterprise slice provisioning.
- November 2025: One NZ activated a self-healing network, cutting mean repair time by 35% during Auckland and Wellington trials.


New Zealand Telecom MNO Market Report Scope
Telecom or Telecommunication is the long-range transmission of information by electromagnetic means. The New Zealand Market includes an in-depth trend analysis based on connectivity like fixed networks, mobile networks, and telecom towers.
The New Zealand Telecom MNO Market Report is Segmented by Service Type (Voice Services, Data and Internet Services, Messaging Services, IoT and M2M Services, OTT and PayTV Services, and Other Services (VAS, Roaming and International Services, Enterprise and Wholesale Services, Rest of Service Type)), End-User (Enterprises, and Consumer), and Geography. The Market Forecasts are Provided in Terms of Value (USD).
Service Type
| Voice Services |
| Data and Internet Services |
| Messaging Services |
| IoT and M2M Services |
| OTT and PayTV Services |
| Other Services (VAS, Roaming and International Services, Enterprise and Wholesale Services, Rest of Service Type) |
End-User
| Enterprises |
| Consumer |
| Service Type | Voice Services |
| Data and Internet Services | |
| Messaging Services | |
| IoT and M2M Services | |
| OTT and PayTV Services | |
| Other Services (VAS, Roaming and International Services, Enterprise and Wholesale Services, Rest of Service Type) | |
| End-User | Enterprises |
| Consumer |


Key Questions Answered in the Report
What is the forecast revenue for the New Zealand telecom MNO market in 2031?
It is projected to reach USD 4.78 billion by 2031, reflecting a 2.57% CAGR.
Why are operators prioritizing 5G stand-alone cores?
SA cores enable network slicing and guaranteed-latency services that attract higher-margin enterprise contracts.
Which service type contributes the largest share today?
Data and Internet Services accounted for 52.78% of 2025 revenue.
How fast is the enterprise segment growing?
Enterprise accounts are expected to rise at a 3.04% CAGR through 2031, faster than the overall market.
What role do MVNOs play in New Zealand?
Wholesale access mandates allowed MVNOs to lift connection share from 1.6% to 2.5% year-on-year, adding competitive diversity.
How are rural areas benefiting from recent initiatives?
Completion of RBI-2 expanded LTE coverage to 84,000 households and supports agritech IoT services that improve farm productivity.
Page last updated on:


