Market Overview
| Study Period | 2020 - 2031 |
|---|---|
| Forecast Data Period | 2026 - 2031 |
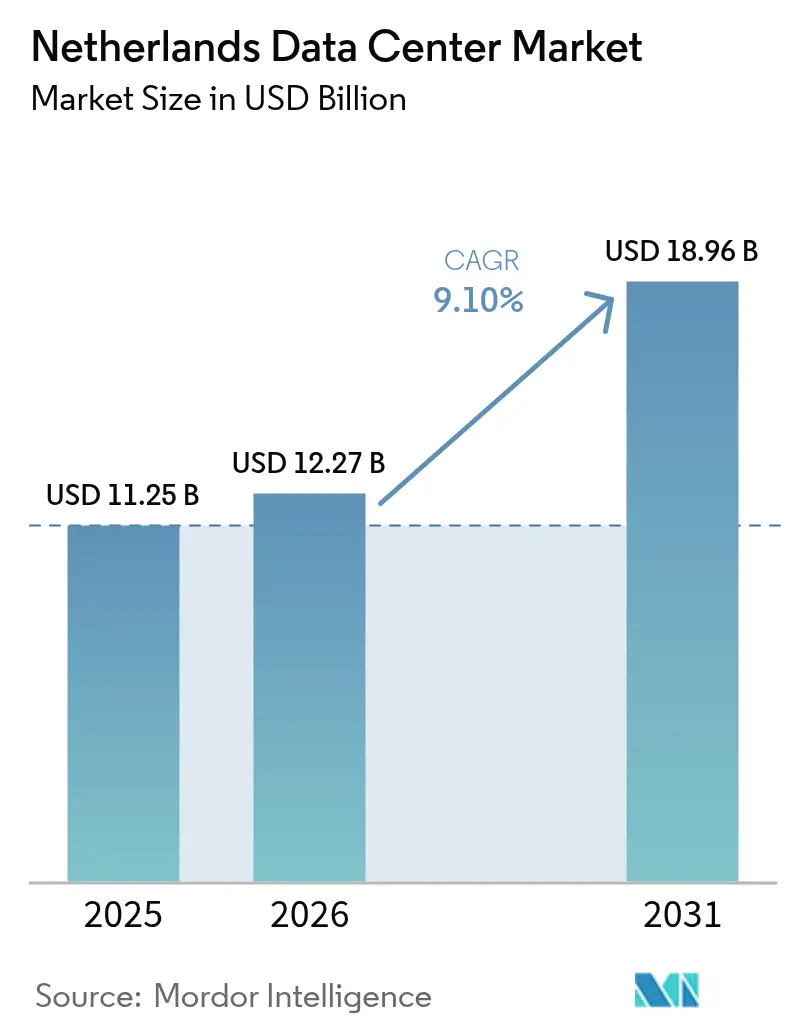
| Base Year Market Size (2025) | USD 11.25 Billion |
| Market Size (2026) | USD 12.27 Billion |
| Market Size (2031) | USD 18.96 Billion |
| Growth Rate (2026 - 2031) | 9.10% CAGR |
| Market Concentration | Medium |
Major Players *Disclaimer: Major Players sorted in no particular order Image © Mordor Intelligence. Reuse requires attribution under CC BY 4.0. | |
Netherlands Data Center Market Analysis by Mordor Intelligence
The Netherlands Data Center Market size is expected to grow from USD 11.25 billion in 2025 to USD 12.27 billion in 2026 and is forecast to reach USD 18.96 billion by 2031 at 9.1% CAGR over 2026-2031. In terms of IT load capacity, the market is expected to grow from 1.09 thousand megawatt in 2025 to 2.41 thousand megawatt by 2030, at a CAGR of 4.92% during the forecast period (2025-2030). The market segment shares and estimates are calculated and reported in terms of MW. Capacity growth is propelled by hyperscale cloud build-outs, sovereign AI initiatives, and mandatory sustainability targets that prioritize energy-efficient designs and waste-heat reuse. Competitive intensity remains moderate as global colocation leaders consolidate prime Amsterdam assets while a long tail of regional specialists pursues edge and sovereign-cloud niches. Grid congestion and permitting caps in the Randstad region are triggering geographic dispersion toward secondary cities where land costs, municipal fiber projects, and renewable-energy availability enhance site economics. Rising power densities associated with AI training are accelerating the adoption of liquid and immersion cooling technologies that enable 100 kW racks and support heat-recovery schemes.
Key Report Takeaways
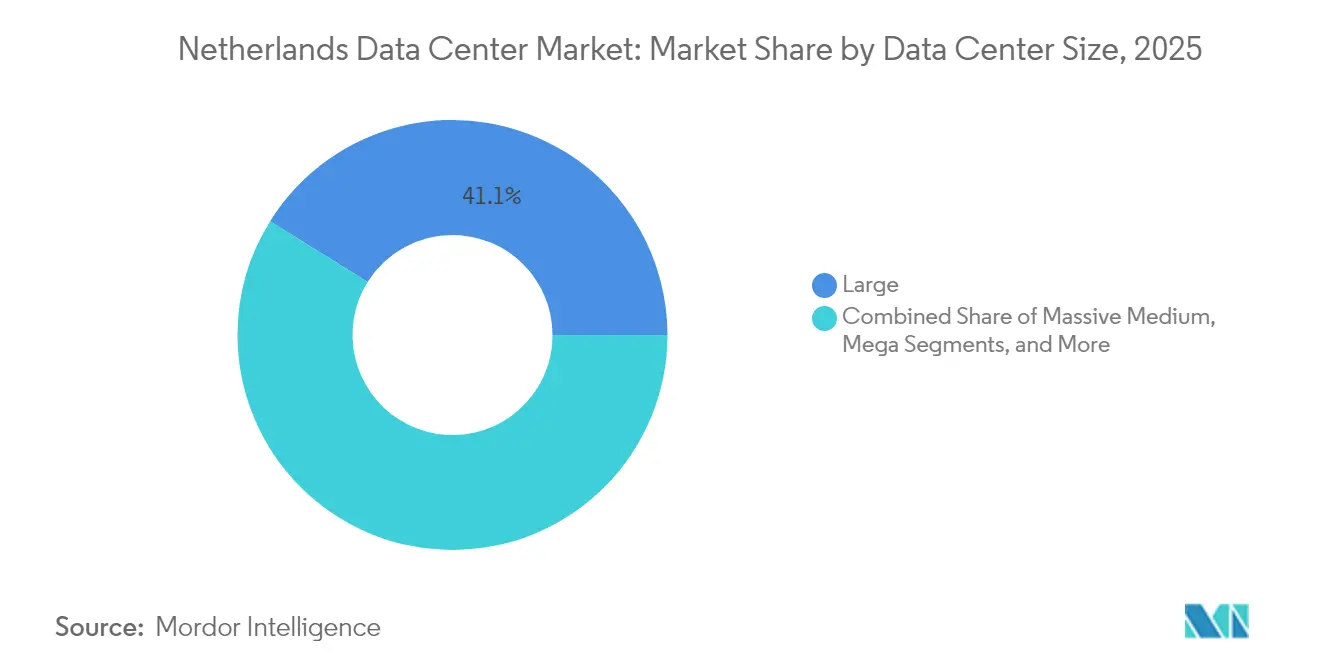
- By data center size, large facilities commanded 41.12% share of the Netherlands data center market size in 2025, whereas mega facilities are projected to register the highest 6.32% CAGR to 2031.
- By tier type, Tier 3 sites led with 62.70% share of the Netherlands data center market size in 2025, and Tier 4 installations are poised for the fastest 7.02% CAGR over 2031, the same horizon.
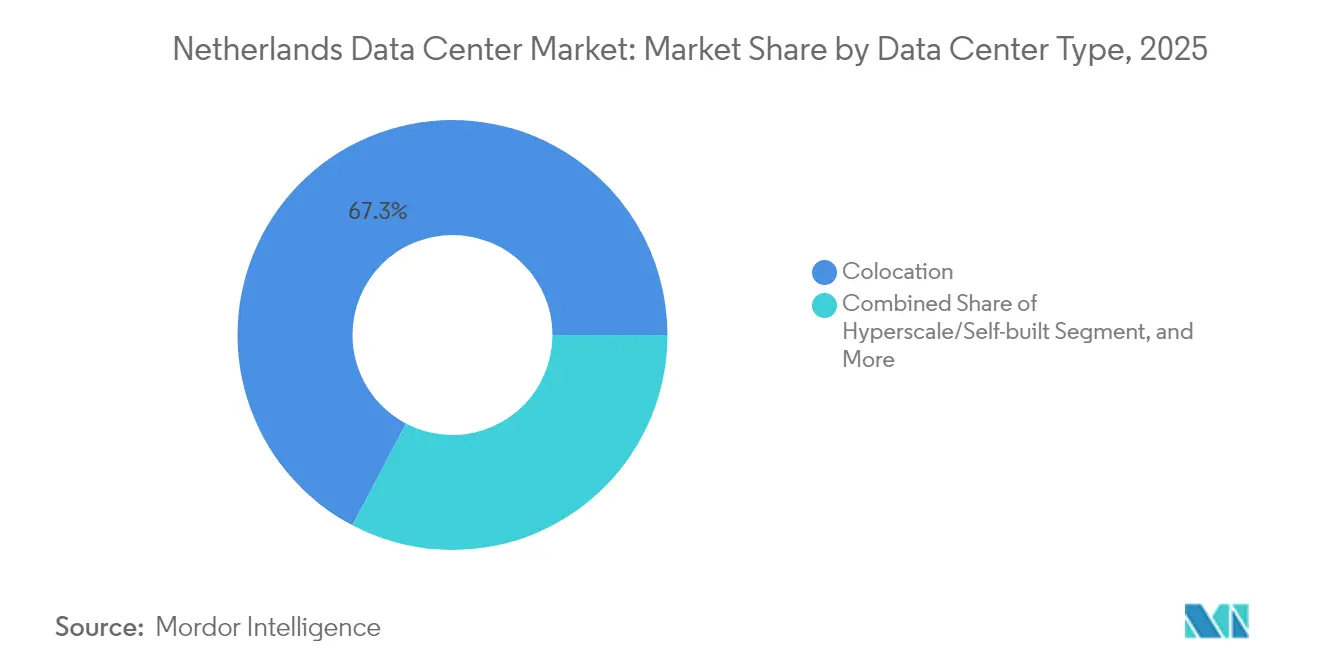
- By data center type, colocation accounted for 67.30% share of the Netherlands data center market size in 2025, yet hyperscale campuses are set to post a 5.62% CAGR through 2031.
- By end user, IT and telecom entities represented 50.15% share of the Netherlands data center market size in 2025, while BFSI demand is expected to rise at a 5.94% CAGR between 2026 and 2031.
- By hotspot, Amsterdam held 77.65% of the Netherlands data center market share in 2025, while the Rest of Netherlands segment is forecast to expand at a 4.27% CAGR through 2031.
Note: Market size and forecast figures in this report are generated using Mordor Intelligence’s proprietary estimation framework, updated with the latest available data and insights as of 2026.
Netherlands Data Center Market Trends and Insights
Drivers Impact Analysis*
| Driver | (~) % Impact on CAGR Forecast | Geographic Relevance | Impact Timeline |
|---|---|---|---|
| Surging hyperscale cloud build-outs by the “Big Three” hyperscalers | +1.8% | Amsterdam, Eemshaven, selected secondary cities | Medium term (2-4 years) |
| Accelerated fibre-to-the-home rollout driving edge demand in municipal nodes | +1.2% | National, with early traction in Eindhoven, Almere, Enschede | Long term (≥4 years) |
| Rapid adoption of liquid and immersion cooling to maximise rack density | +0.9% | Amsterdam, Eemshaven, high-density sites | Short term (≤2 years) |
| Government-backed tax incentives for circular-energy heat-reuse projects | +0.7% | Urban districts nationwide | Medium term (2-4 years) |
| Growing AI-training workloads pushing 100 kW+ rack configurations | +1.1% | Amsterdam, Eemshaven, hyperscale campuses | Short term (≤2 years) |
| Re-industrialisation of the semiconductor supply chain in the European Union | +0.6% | Eindhoven cluster, Enschede, EU spillover hubs | Long term (≥4 years) |
| Source: Mordor Intelligence | |||
Surging Hyper-scale Cloud Build-outs by the "Big Three" Hyperscalers
Oracle’s USD 1 billion commitment to Dutch AI and cloud capacity and Google’s USD 640 million Westpoort expansion illustrate how hyperscalers are prioritizing the Netherlands for consolidated, AI-ready campuses that benefit from the country’s robust subsea cable connectivity and business-friendly tax regime.[1]Baxtel Staff, “Top Data Center News From 15-20 July 2025,” Baxtel, baxtel.com Microsoft’s AMS14 site in Hollands Kroon exemplifies an outward shift from saturated Amsterdam toward municipalities offering power headroom and permitting support. These large-site strategies compress colocation vacancy, raise wholesale pricing, and propel demand for high-density electrical and cooling systems. Regulatory momentum around digital sovereignty further strengthens the position of hyperscalers able to document stringent compliance and audit frameworks. As capacity migrates into fewer mega sites, secondary colocation providers differentiate through latency-optimized edge nodes and bespoke interconnection ecosystems that integrate seamlessly with hyperscaler backbones.
Accelerated Fibre-to-the-Home Rollout Driving Edge Demand in Municipal Nodes
KPN’s fibre footprint surpassed 5.74 million premises in 2025, taking household coverage to 66% and enabling distributed compute architectures that shift latency-sensitive workloads closer to end users. Open Dutch Fiber’s build-outs in Eindhoven, Almere, and Enschede convert passive fibre investments into active edge data center demand by lowering last-mile costs. Tower operator Cellnex has coupled a 24-tower edge node program with a Hilversum hub, demonstrating telecom carrier moves into colocation monetization. Under the National Digitalization Strategy, municipalities receive grants for civic cloud pilots that require sub-5 ms latency, favoring micro-data centers located inside industrial parks and smart-city districts. Fibre-enabled edge sites also support heat-recovery loops feeding district heating grids, satisfying circular-energy mandates while diversifying revenue streams for operators.
Rapid Adoption of Liquid and Immersion Cooling to Maximise Rack Density
Dutch pioneers such as Asperitas have validated immersion cooling at commercial scale, enabling rack densities above 100 kW and reducing floor-space needs in real-estate-constrained Amsterdam. Switch Datacenters integrated dielectric-fluid tanks at its Amsterdam and newly acquired Woerden facilities, capturing waste heat for adjacent greenhouse operations and aligning with fiscal incentives tied to heat reuse. EU energy-efficiency directives require PUE disclosure, accelerating the shift toward direct-to-chip and immersion solutions that deliver sub-1.15 PUE scores. Liquid cooling adoption allows operators to defer brownfield expansions by extracting more compute from existing footprints, mitigating the impact of municipal moratoria on new hyperscale builds. As AI clusters proliferate, immersion systems become essential to maintaining GPU stability and fulfilling rack density requests from hyperscalers and research institutions.
Growing AI-training Workloads Pushing 100 kW+ Rack Configurations
The Dutch government’s EUR 204.5 million (USD 231.1 million) AINed program and EUR 13.5 million (USD 15.2 million) GPT-NL initiative underpin a surge in local AI model development that demands ultra-dense compute nodes. Equinix’s USD 15 billion AI venture framework showcases how global colocation leaders are retrofitting facilities with reinforced power trains and rear-door heat exchangers capable of sustaining continuous 100 kW racks. Oracle positions its forthcoming Dutch region for dedicated AI training, citing sub-5 ms proximity to European data sets as a selling point. GPU cluster deployments elevate average rack power draw, forcing grid-capacity negotiations with TenneT and catalyzing investments in on-site battery energy storage to smooth intermittent renewables. Facilities that combine high-amp power feeds, direct-liquid cooling, and renewable-backed PPAs gain competitive advantage with enterprise and public-sector AI stakeholders.
Restraints Impact Analysis*
| Restraint | (~) % Impact on CAGR Forecast | Geographic Relevance | Impact Timeline |
|---|---|---|---|
| National moratoriums on new hyperscale permits in key FLAP markets | -1.4% | Amsterdam, FLAP markets, Randstad region | Short term (≤ 2 years) |
| Escalating electricity tariffs linked to EU carbon pricing | -0.8% | National, highest impact in energy-intensive facilities | Medium term (2-4 years) |
| Acute scarcity of grid interconnection capacity in Randstad region | -1.1% | Amsterdam, Randstad region, high-density areas | Medium term (2-4 years) |
| Rising public opposition to land-intensive, water-cooled facilities | -0.5% | Rural areas, water-sensitive regions | Long term (≥ 4 years) |
| Source: Mordor Intelligence | |||
National Moratoriums on New Hyperscale Permits in Key FLAP Markets
City councils in Amsterdam, Almere, and Haarlemmermeer paused hyperscale applications in 2024 to curb electricity and land consumption, pushing operators toward brownfield acquisitions and density upgrades rather than greenfield expansion. Switch Datacenters circumvented the freeze by acquiring ABN AMRO’s former Woerden facility for EUR 11 million (USD 12.4 million), signaling a buy-versus-build pivot among providers facing permitting uncertainty. Moratoria inflate asset valuations for existing permitted sites, strengthen incumbents’ bargaining power, and extend project timelines by 6-12 months. The restrictions also encourage distributed builds in provinces such as Drenthe and Overijssel, but secondary sites often lack mature interconnection fabrics. While the caps intend to balance economic growth with environmental stewardship, unintended consequences include higher wholesale pricing and reduced competition in core markets.
Acute Scarcity of Grid Interconnection Capacity in Randstad Region
TenneT declared the Randstad high-voltage grid “full” for new 150 kV feeds, forcing data center proposals into multi-year queue systems or expensive privately financed substations. Operators now budget USD 2-5 million for on-site battery storage and harmonic filtering to stabilize renewable-heavy supply. Grid bottlenecks favor campuses with legacy dual-feed contracts, elevating their lease rates and acquisition multiples. Projects without secured capacity migrate to Eemshaven or Brabant, lengthening latency to AMS-IX and undercutting certain content-delivery use cases. In the medium term, national grid reinforcement plans could unlock 3-4 GW, yet environmental permits, supply-chain constraints, and local opposition may stretch timelines beyond 2028.
*Our forecasts treat driver/restraint impacts as directional, not additive. The impact forecasts reflect baseline growth, mix effects, and variable interactions.
Segment Analysis
By Data Center Size: Hyperscale Scaling Outpaces Legacy Footprints
Large facilities retained 41.12% Netherlands data center market share in 2025, reflecting entrenched enterprise and multi-tenant demand clustered around Amsterdam’s carrier hotels. However, mega campuses are projected to post a 6.32% CAGR to 2031 as hyperscalers condense compute into fewer, energy-efficient locations. The Netherlands data center market size for mega facilities is set to exceed 868 MW by 2031, driven by Oracle’s USD 1 billion AI deployment and Google’s phased Westpoort build. Mega sites justify capital-intensive liquid cooling and onsite substation investments that smaller footprints cannot amortize. At the other end, small and micro data centers address edge latency targets but face cost headwinds tied to staffing and remote management.
Enterprises in regulated industries adopt a phased migration path, using medium facilities as interim hybrid-cloud staging grounds before contracting dedicated hyperscale nodes. Investment momentum concentrates in sites offering ≥80 MW campus potential plus renewable energy PPAs that safeguard long-term power pricing. Mega-campus operators leverage economies of scale to introduce integrated heat-exchange networks supplying neighboring greenhouse complexes, unlocking additional tax incentives. With Amsterdam permits constrained, provinces such as Groningen and North Holland market land parcels adjacent to 380 kV transmission corridors, accelerating the regional diversification of capacity.


By Tier Type: Reliability Imperatives Elevate Tier 4 Adoption
Tier 3 configurations dominated with 62.70% Netherlands data center market share in 2025 thanks to favorable cost-resilience trade-offs for mainstream enterprise workloads. The Netherlands data center market size dedicated to Tier 4, though modest today, is forecast to grow at a 7.02% CAGR through 2031 as AI, fintech, and sovereign cloud tenants demand 99.995% uptim. Tier 4 new-builds feature 2N+1 power architectures with isolated dual-bus switchgear that accommodate 100 kW racks without derating. Financial institutions upgrading to real-time payments and algorithmic trading migrate critical workloads from internal Tier 2 halls to third-party Tier 4 suites to comply with operational-resilience regulations under NIS2.
Operators retrofit Tier 3 halls with modular UPS blocks and hot-aisle containment to bridge the resiliency gap, yet permitting pathways increasingly link tax breaks to demonstrable Tier 4 heat-recovery plans. AI cluster growth further drives Tier 4 demand: model training jobs spanning days cannot tolerate unplanned outages. Campus designs now integrate redundant 150 kV feeds, on-site HVO (hydrotreated vegetable oil) standby generators, and lithium-ion battery storage sized for 15-minute runtime to satisfy Tier 4 accreditation. Provinces offering streamlined Tier 4 certification processes gain advantage in attracting capital-intensive AI tenants.
By Data Center Type: Colocation Holds Scale Advantage Amid Hyperscale Surge
Colocation retained 67.30 of % Netherlands data center market share in 2025, leveraging Amsterdam’s dense interconnect ecosystem to attract enterprises seeking cloud-on-ramp proximity. Yet hyperscale self-builds are forecast to expand at a 5.62% CAGR as cloud giants pursue design autonomy, specialized cooling, and consolidated asset control. The Netherlands data center market size allocated to hyperscale campuses could surpass 1.07 GW by 2031, narrowing the colocation share in aggregate capacity terms. Within colocation, wholesale suites outperform retail cages as corporate IT teams wrap multiple workloads into contiguous footprints to streamline governance.
Edge and micro-colocation nodes gain share in secondary cities where 5G low-latency use cases and Industry 4.0 deployments demand local processing. European Data Act provisions on portability encourage enterprises to favor vendor-neutral colocation platforms that decouple compute from proprietary hyperscaler ecosystems. Operators differentiate through carrier-dense fabrics, sovereign-cloud-compliant service catalogs, and heat-reuse partnerships that reduce community heating costs. While hyperscalers accelerate capital spend, colocation incumbents respond with build-to-suit halls and ecosystem-rich campuses that integrate Internet exchange points, cloud on-ramps, and AI testing sandboxes.
By End User: Financial Services Accelerate Digital Sovereignty
IT and telecom stakeholders accounted for 50.15% of deployed MW in 2025, reflecting longstanding carrier hotel dynamics around the AMS-IX node. BFSI workloads, however, are set to register a 5.94% CAGR as Dutch and EU banking directives push institutions toward real-time processing, algorithmic risk models, and stringent data localization. The Netherlands data center market size catering to BFSI could top 383 MW by 2031, intensifying competition for Tier 4 space. Manufacturing demand scales steadily as the Eindhoven photonics and semiconductor clusters embed predictive-maintenance and digital-twin applications that require latency-bounded compute.
Government adoption follows the National Digitalization Strategy, mandating sovereign storage for sensitive data and spurring public-sector cloud frameworks hosted in domestic facilities. Media and entertainment workloads benefit from edge nodes in Enschede and Almere, reducing round-trip latency for real-time streaming personalization. Research and healthcare institutions seek GPU-rich clusters for genomics and AI drug discovery but face budget constraints, often partnering with commercial colocation providers for dedicated high-performance pods.
Geography Analysis
Amsterdam retained 77.65% Netherlands data center market share in 2025, supported by AMS-IX’s 12.724 Tb/s peak traffic and 878 connected networks that underpin dense peering communities. The Netherlands data center market size outside Amsterdam is forecast to grow fastest at a 4.27% CAGR as operators bypass grid and permit bottlenecks by siting campuses in Groningen, North Brabant, and Overijssel. Eindhoven leverages its ASML-anchored semiconductor ecosystem to attract compute-intensive photonics R&D, while Almere’s municipally funded fibre backhaul reduces connectivity barriers for new entrants.
Municipal incentives couple reduced land-lease rates with district-heating integration requirements, positioning secondary hubs as sustainability showcases. Grid capacity maps published by TenneT highlight 380 kV corridors near Eemshaven that align with offshore wind farm connections, enabling renewable-backed power purchase agreements. As Amsterdam vacancy tightens, enterprises adopt hub-and-spoke topologies that anchor core data lakes in Science Park or Schiphol Rijk while deploying edge caches in Drenthe or Gelderland to meet latency objectives. Over the forecast horizon, permit workflows and power-price differentials will continue to redistribute incremental capacity toward provinces offering streamlined approvals and renewable headroom.
Amsterdam’s entrenched carrier density and AMS-IX traffic scale assure its primacy, yet its expansion potential is constrained by moratoria on new hyperscale builds and acute grid congestion that inflate project timelines. Facility operators with grandfathered permits monetize scarcity through premium wholesale rates and long-term take-or-pay contracts that appeal to AI tenants requiring predictable power allocations. Continued investment in submarine cable projects such as IOEMA fortifies Amsterdam’s connectivity moat, but the city’s power-price volatility linked to EU carbon pricing erodes cost competitiveness relative to emerging hubs.
Secondary provinces capitalize on policy support and renewable energy synergies. Groningen’s Eemshaven node ties directly into 700 MW of offshore wind capacity, offering attractive green-power PPAs and ample 380 kV grid headroom. North Brabant targets semiconductor supply-chain computing with incentives tailored to ASML and its partner network, coupling enterprise-zone tax abatements with expedited environmental assessments. Overijssel municipalities pitch industrial-park campuses that integrate waste-heat into district networks, turning thermal output into monetizable assets under the national circular-economy agenda.
Cross-country fiber mesh expansion underpins distributed architectures. KPN and Delta Fiber are on track to achieve 90% household coverage by 2027, enabling enterprises to deploy micro-data centers within 10 km of end-user clusters. Government-funded sovereign cloud pilots mandate domestic hosting, directing incremental workloads to Dutch facilities over neighboring German or Belgian alternatives. Collectively, these dynamics shift the geographic mix while preserving Amsterdam’s role as the region’s interconnection core.
Competitive Landscape
Market consolidation is moderate: Equinix and Digital Realty control roughly 25% of Amsterdam’s installed MW, yet more than 30 independent providers operate across the Netherlands, keeping pricing discipline in check. Incumbents leverage multi-campus scales to negotiate renewable PPAs and pioneer heat-reuse integrations that satisfy stringent permitting requirements. Fragmentation persists in secondary cities, where regional specialists such as NorthC tailor hybrid-cloud suites and sovereign compliance frameworks for mid-market enterprises.
Strategic differentiation increasingly revolves around sustainability credentials, cooling IP, and regulatory preparedness. Asperitas markets immersion-cooling as-a-service modules to colocation operators, accelerating broader ecosystem adoption. Maincubes secured EUR 1 billion (USD 1.13 billion) sustainability-linked financing tying interest margins to annual PUE and renewable-energy milestones, illustrating investor pressure for verifiable ESG performance.[2]George Leopold, “Google Invests USD 640 Million in Netherlands Expansion,” Data Center Knowledge, datacenterknowledge.com OVHcloud touts a 27% component reuse rate and proprietary warm-water cooling to attract cost-sensitive cloud users wary of energy price escalation.[3]Sarah Thomas, “Maincubes Integrates Sustainability Targets Into New Financing,” Data Centre News UK, datacentrenews.uk
Hyperscalers embed on-premises fiber meet-me rooms, compelling colocation landlords to upgrade interconnection fabrics and offer cross-connect SLAs aligned with cloud region latencies. Patent portfolios in thermal management and AI workload orchestration emerge as strategic weapons, enabling operators to monetize licensing or command premium lease rates through differentiated service levels. Compliance readiness for the EU AI Act and NIS2 becomes a sales prerequisite, advantaging players with centralized governance platforms capable of delivering unified audit trails across multi-country footprints.
Netherlands Data Center Industry Leaders
Microsoft Corporation
Google LLC
IBM Corporation
Oracle Corporation
Cloudflare Inc.
- *Disclaimer: Major Players sorted in no particular order


Recent Industry Developments
- July 2025: The Dutch government published the National Digitalization Strategy emphasizing joint public-sector cloud adoption and sovereign cloud exploration.
- July 2025: Oracle announced a USD 1 billion investment in AI and cloud infrastructure across the Netherlands over the next five years.
- March 2025: Dutch parliament approved eight motions calling for reduced reliance on U.S. cloud vendors and preferential treatment for European providers.
- December 2024: NorthC expanded its national footprint through acquisitions and capacity additions targeting data residency demand.


Netherlands Data Center Market Report Scope
Amsterdam are covered as segments by Hotspot. Large, Massive, Medium, Mega, Small are covered as segments by Data Center Size. Tier 1 and 2, Tier 3, Tier 4 are covered as segments by Tier Type. Non-Utilized, Utilized are covered as segments by Absorption.
By Data Center Size
| Large |
| Massive |
| Medium |
| Mega |
| Small |
By Tier Type
| Tier 1 and 2 |
| Tier 3 |
| Tier 4 |
By Data Center Type
| Hyperscale/Self-built | ||
| Enterprise/Edge | ||
| Colocation | Non-Utilized | |
| Utilized | Retail Colocation | |
| Wholesale Colocation | ||
By End User
| BFSI |
| IT and ITES |
| E-Commerce |
| Government |
| Manufacturing |
| Media and Entertainment |
| Telecom |
| Other End Users |
By Hotspot
| Amsterdam |
| Rest of Netherlands |
| By Data Center Size | Large | ||
| Massive | |||
| Medium | |||
| Mega | |||
| Small | |||
| By Tier Type | Tier 1 and 2 | ||
| Tier 3 | |||
| Tier 4 | |||
| By Data Center Type | Hyperscale/Self-built | ||
| Enterprise/Edge | |||
| Colocation | Non-Utilized | ||
| Utilized | Retail Colocation | ||
| Wholesale Colocation | |||
| By End User | BFSI | ||
| IT and ITES | |||
| E-Commerce | |||
| Government | |||
| Manufacturing | |||
| Media and Entertainment | |||
| Telecom | |||
| Other End Users | |||
| By Hotspot | Amsterdam | ||
| Rest of Netherlands | |||


Market Definition
- IT LOAD CAPACITY - The IT load capacity or installed capacity, refers to the amount of energy consumed by servers and network equipments placed in a rack installed. It is measured in megawatt (MW).
- ABSORPTION RATE - It denotes the extend to which the data center capacity has been leased out. For instance, a 100 MW DC has leased out 75 MW, then absorption rate would be 75%. It is also referred as utilization rate and leased-out capacity.
- RAISED FLOOR SPACE - It is an elevated space build over the floor. This gap between the original floor and the elevated floor is used to accommodate wiring, cooling, and other data center equipment. This arrangement assist in having proper wiring and cooling infrastructure. It is measured in square feet (ft^2).
- DATA CENTER SIZE - Data Center Size is segmented based on the raised floor space allocated to the data center facilities. Mega DC - # of Racks must be more than 9000 or RFS (raised floor space) must be more than 225001 Sq. ft; Massive DC - # of Racks must be in between 9000 and 3001 or RFS must be in between 225000 Sq. ft and 75001 Sq. ft; Large DC - # of Racks must be in between 3000 and 801 or RFS must be in between 75000 Sq. ft and 20001 Sq. ft; Medium DC # of Racks must be in between 800 and 201 or RFS must be in between 20000 Sq. ft and 5001 Sq. ft; Small DC - # of Racks must be less than 200 or RFS must be less than 5000 Sq. ft.
- TIER TYPE - According to Uptime Institute the data centers are classified into four tiers based on the proficiencies of redundant equipment of the data center infrastructure. In this segment the data center are segmented as Tier 1,Tier 2, Tier 3 and Tier 4.
- COLOCATION TYPE - The segment is segregated into 3 categories namely Retail, Wholesale and Hyperscale Colocation service. The categorization is done based on the amount of IT load leased out to potential customers. Retail colocation service has leased capacity less than 250 kW; Wholesale colocation services has leased capacity between 251 kW and 4 MW and Hyperscale colocation services has leased capacity more than 4 MW.
- END CONSUMERS - The Data Center Market operates on a B2B basis. BFSI, Government, Cloud Operators, Media and Entertainment, E-Commerce, Telecom and Manufacturing are the major end-consumers in the market studied. The scope only includes colocation service operators catering to the increasing digitalization of the end-user industries.
| Keyword | Definition |
|---|---|
| Rack Unit | Generally referred as U or RU, it is the unit of measurement for the server unit housed in the racks in the data center. 1U is equal to 1.75 inches. |
| Rack Density | It defines the amount of power consumed by the equipment and server housed in a rack. It is measured in kilowatt (kW). This factor plays a critical role in data center design and, cooling and power planning. |
| IT Load Capacity | The IT load capacity or installed capacity, refers to the amount of energy consumed by servers and network equipment placed in a rack installed. It is measured in megawatt (MW). |
| Absorption Rate | It denotes how much of the data center capacity has been leased out. For instance, if a 100 MW DC has leased out 75 MW, then the absorption rate would be 75%. It is also referred to as utilization rate and leased-out capacity. |
| Raised Floor Space | It is an elevated space built over the floor. This gap between the original floor and the elevated floor is used to accommodate wiring, cooling, and other data center equipment. This arrangement assists in having proper wiring and cooling infrastructure. It is measured in square feet/meter. |
| Computer Room Air Conditioner (CRAC) | It is a device used to monitor and maintain the temperature, air circulation, and humidity inside the server room in the data center. |
| Aisle | It is the open space between the rows of racks. This open space is critical for maintaining the optimal temperature (20-25 °C) in the server room. There are primarily two aisles inside the server room, a hot aisle and a cold aisle. |
| Cold Aisle | It is the aisle wherein the front of the rack faces the aisle. Here, chilled air is directed into the aisle so that it can enter the front of the racks and maintain the temperature. |
| Hot Aisle | It is the aisle where the back of the racks faces the aisle. Here, the heat dissipated from the equipment’s in the rack is directed to the outlet vent of the CRAC. |
| Critical Load | It includes the servers and other computer equipment whose uptime is critical for data center operation. |
| Power Usage Effectiveness (PUE) | It is a metric which defines the efficiency of a data center. It is calculated by: (𝑇𝑜𝑡𝑎𝑙 𝐷𝑎𝑡𝑎 𝐶𝑒𝑛𝑡𝑒𝑟 𝐸𝑛𝑒𝑟𝑔𝑦 𝐶𝑜𝑛𝑠𝑢𝑚𝑝𝑡𝑖𝑜𝑛)/(𝑇𝑜𝑡𝑎𝑙 𝐼𝑇 𝐸𝑞𝑢𝑖𝑝𝑚𝑒𝑛𝑡 𝐸𝑛𝑒𝑟𝑔𝑦 𝐶𝑜𝑛𝑠𝑢𝑚𝑝𝑡𝑖𝑜𝑛). Further, a data center with a PUE of 1.2-1.5 is considered highly efficient, whereas, a data center with a PUE >2 is considered highly inefficient. |
| Redundancy | It is defined as a system design wherein additional component (UPS, generators, CRAC) is added so that in case of power outage, equipment failure, the IT equipment should not be affected. |
| Uninterruptible Power Supply (UPS) | It is a device that is connected in series with the utility power supply, storing energy in batteries such that the supply from UPS is continuous to IT equipment even during utility power is snapped. The UPS primarily supports the IT equipment only. |
| Generators | Just like UPS, generators are placed in the data center to ensure an uninterrupted power supply, avoiding downtime. Data center facilities have diesel generators and commonly, 48-hour diesel is stored in the facility to prevent disruption. |
| N | It denotes the tools and equipment required for a data center to function at full load. Only "N" indicates that there is no backup to the equipment in the event of any failure. |
| N+1 | Referred to as 'Need plus one', it denotes the additional equipment setup available to avoid downtime in case of failure. A data center is considered N+1 when there is one additional unit for every 4 components. For instance, if a data center has 4 UPS systems, then for to achieve N+1, an additional UPS system would be required. |
| 2N | It refers to fully redundant design wherein two independent power distribution system is deployed. Therefore, in the event of a complete failure of one distribution system, the other system will still supply power to the data center. |
| In-Row Cooling | It is the cooling design system installed between racks in a row where it draws warm air from the hot aisle and supplies cool air to the cold aisle, thereby maintaining the temperature. |
| Tier 1 | Tier classification determines the preparedness of a data center facility to sustain data center operation. A data center is classified as Tier 1 data center when it has a non-redundant (N) power component (UPS, generators), cooling components, and power distribution system (from utility power grids). The Tier 1 data center has an uptime of 99.67% and an annual downtime of <28.8 hours. |
| Tier 2 | A data center is classified as Tier 2 data center when it has a redundant power and cooling components (N+1) and a single non-redundant distribution system. Redundant components include extra generators, UPS, chillers, heat rejection equipment, and fuel tanks. The Tier 2 data center has an uptime of 99.74% and an annual downtime of <22 hours. |
| Tier 3 | A data center having redundant power and cooling components and multiple power distribution systems is referred to as a Tier 3 data center. The facility is resistant to planned (facility maintenance) and unplanned (power outage, cooling failure) disruption. The Tier 3 data center has an uptime of 99.98% and an annual downtime of <1.6 hours. |
| Tier 4 | It is the most tolerant type of data center. A Tier 4 data center has multiple, independent redundant power and cooling components and multiple power distribution paths. All IT equipment are dual powered, making them fault tolerant in case of any disruption, thereby ensuring interrupted operation. The Tier 4 data center has an uptime of 99.74% and an annual downtime of <26.3 minutes. |
| Small Data Center | Data center that has floor space area of ≤ 5,000 Sq. ft or the number of racks that can be installed is ≤ 200 is classified as a small data center. |
| Medium Data Center | Data center which has floor space area between 5,001-20,000 Sq. ft, or the number of racks that can be installed is between 201-800, is classified as a medium data center. |
| Large Data Center | Data center which has floor space area between 20,001-75,000 Sq. ft, or the number of racks that can be installed is between 801-3,000, is classified as a large data center. |
| Massive Data Center | Data center which has floor space area between 75,001-225,000 Sq. ft, or the number of racks that can be installed is between 3001-9,000, is classified as a massive data center. |
| Mega Data Center | Data center that has a floor space area of ≥ 225,001 Sq. ft or the number of racks that can be installed is ≥ 9001 is classified as a mega data center. |
| Retail Colocation | It refers to those customers who have a capacity requirement of 250 kW or less. These services are majorly opted by small and medium enterprises (SMEs). |
| Wholesale Colocation | It refers to those customers who have a capacity requirement between 250 kW to 4 MW. These services are majorly opted by medium to large enterprises. |
| Hyperscale Colocation | It refers to those customers who have a capacity requirement greater than 4 MW. The hyperscale demand primarily originates from large-scale cloud players, IT companies, BFSI, and OTT players (like Netflix, Hulu, and HBO+). |
| Mobile Data Speed | It is the mobile internet speed a user experiences via their smartphones. This speed is primarily dependent on the carrier technology being used in the smartphone. The carrier technologies available in the market are 2G, 3G, 4G, and 5G, where 2G provides the slowest speed while 5G is the fastest. |
| Fiber Connectivity Network | It is a network of optical fiber cables deployed across the country, connecting rural and urban regions with high-speed internet connection. It is measured in kilometer (km). |
| Data Traffic per Smartphone | It is a measure of average data consumption by a smartphone user in a month. It is measured in gigabyte (GB). |
| Broadband Data Speed | It is the internet speed that is supplied over the fixed cable connection. Commonly, copper cable and optic fiber cable are used in both residential and commercial use. Here, optic cable fiber provides faster internet speed than copper cable. |
| Submarine Cable | A submarine cable is a fiber optic cable laid down at two or more landing points. Through this cable, communication and internet connectivity between countries across the globe is established. These cables can transmit 100-200 terabits per second (Tbps) from one point to another. |
| Carbon Footprint | It is the measure of carbon dioxide generated during the regular operation of a data center. Since, coal, and oil & gas are the primary source of power generation, consumption of this power contributes to carbon emissions. Data center operators are incorporating renewable energy sources to curb the carbon footprint emerging in their facilities. |


Research Methodology
Mordor Intelligence follows a four-step methodology in all our reports.
- Step-1: Identify Key Variables: In order to build a robust forecasting methodology, the variables and factors identified in Step-1 are tested against available historical market numbers. Through an iterative process, the variables required for market forecast are set and the model is built on the basis of these variables.
- Step-2: Build a Market Model: Market-size estimations for the forecast years are in nominal terms. Inflation is not a part of the pricing, and the average selling price (ASP) is kept constant throughout the forecast period for each country.
- Step-3: Validate and Finalize: In this important step, all market numbers, variables and analyst calls are validated through an extensive network of primary research experts from the market studied. The respondents are selected across levels and functions to generate a holistic picture of the market studied.
- Step-4: Research Outputs: Syndicated Reports, Custom Consulting Assignments, Databases & Subscription Platforms


