Naval Combat Systems Market Size and Share
Market Overview
| Study Period | 2020 - 2031 |
|---|---|
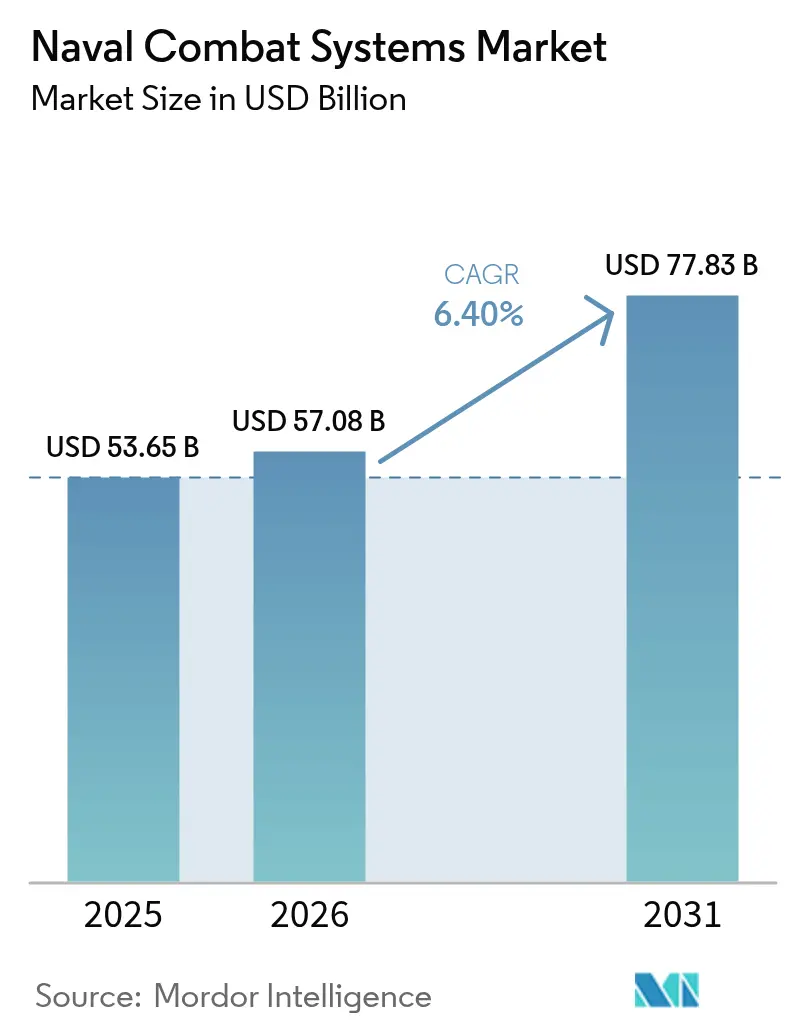
| Market Size (2026) | USD 57.08 Billion |
| Market Size (2031) | USD 77.83 Billion |
| Growth Rate (2026 - 2031) | 6.40% CAGR |
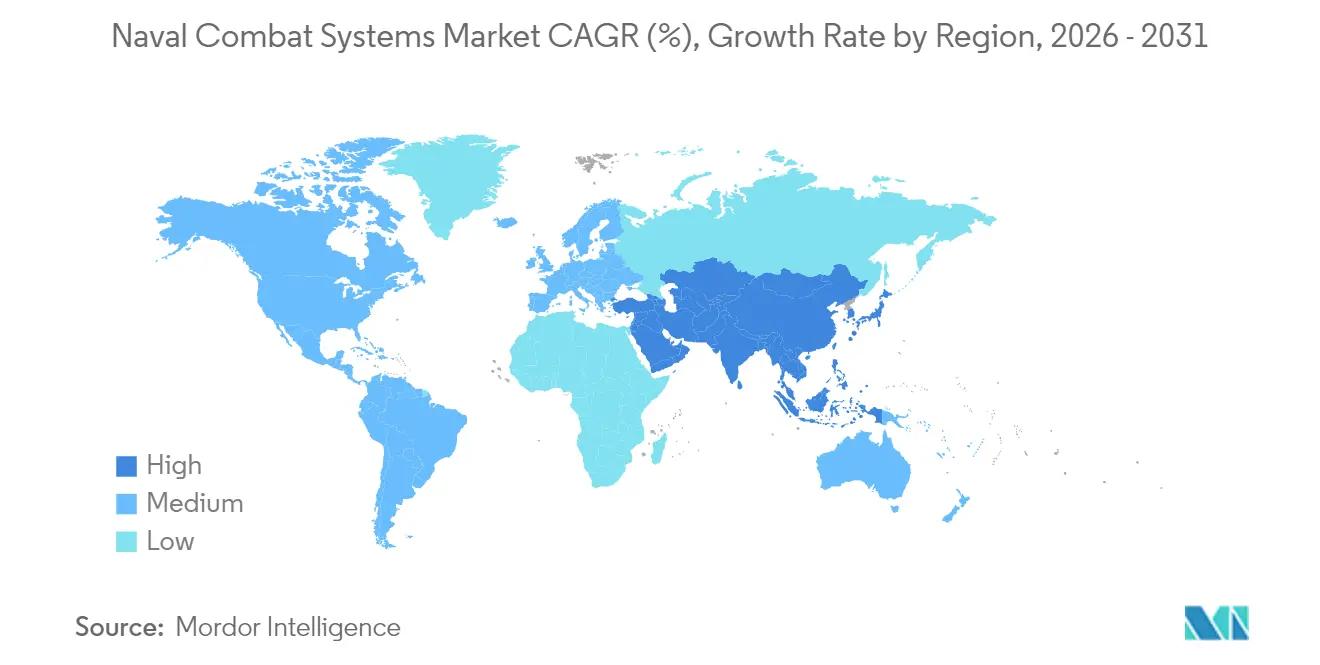
| Fastest Growing Market | Asia Pacific |
| Largest Market | North America |
| Market Concentration | Medium |
Major Players *Disclaimer: Major Players sorted in no particular order Image © Mordor Intelligence. Reuse requires attribution under CC BY 4.0. | |
Naval Combat Systems Market Analysis by Mordor Intelligence
naval combat systems market size in 2026 is estimated at USD 57.08 billion, growing from 2025 value of USD 53.65 billion with 2031 projections showing USD 77.83 billion, growing at 6.40% CAGR over 2026-2031. The current expansion is propelled by simultaneous fleet-modernization programs, fast-maturing directed-energy technologies, and the rapid move toward distributed, unmanned naval architectures that reshape mission concepts and crew models. Growing investment in integrated combat-management suites, rising demand for electronic-warfare and C4ISR capabilities, and steady progress in DevSecOps pipelines all reinforce long-term spending momentum. Meanwhile, accelerated acquisition of unmanned surface and underwater vehicles redefines naval force structure, enabling persistent ISR and low-risk strike missions across contested seas. North American dominance is underpinned by the US Navy's large modernization budget. However, Asia-Pacific's growth outpaces all regions as China's third aircraft carrier and regional counter-moves from India, Japan, South Korea, and Australia spur parallel procurement cycles.
Key Report Takeaways
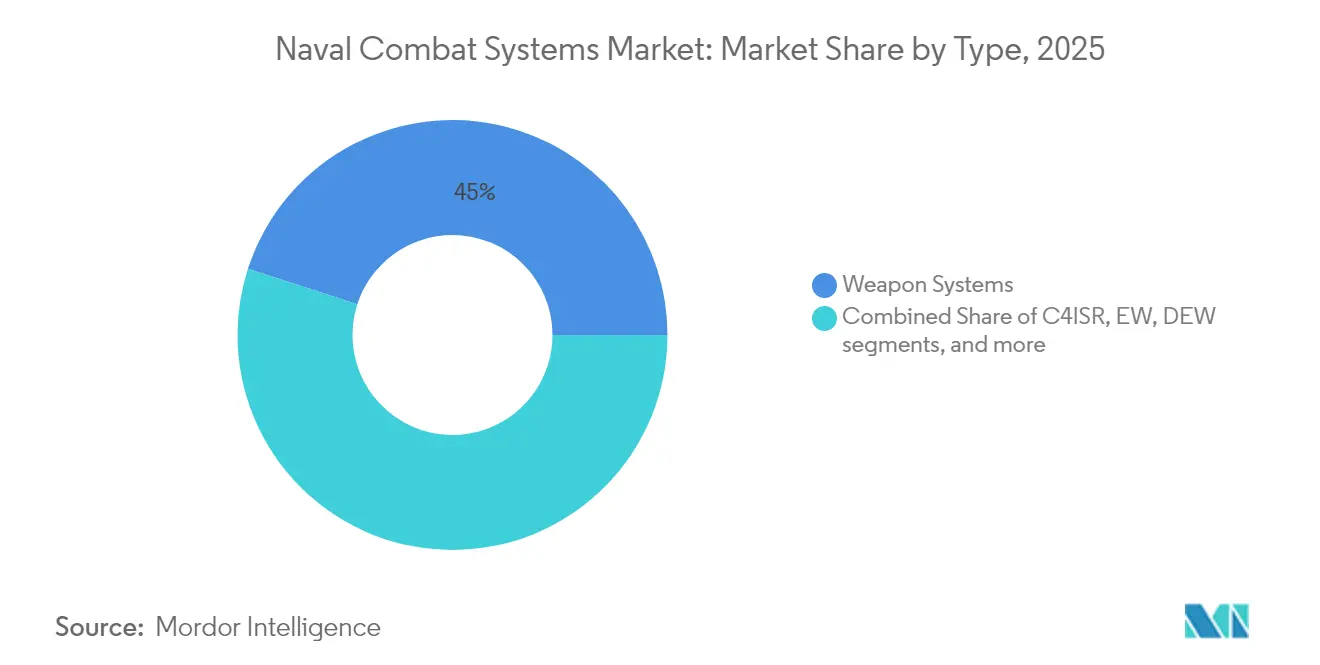
- By type, weapon systems led with 45.02% of the naval combat systems market share in 2025, while directed-energy weapons are forecasted to expand at a 9.44% CAGR to 2031.
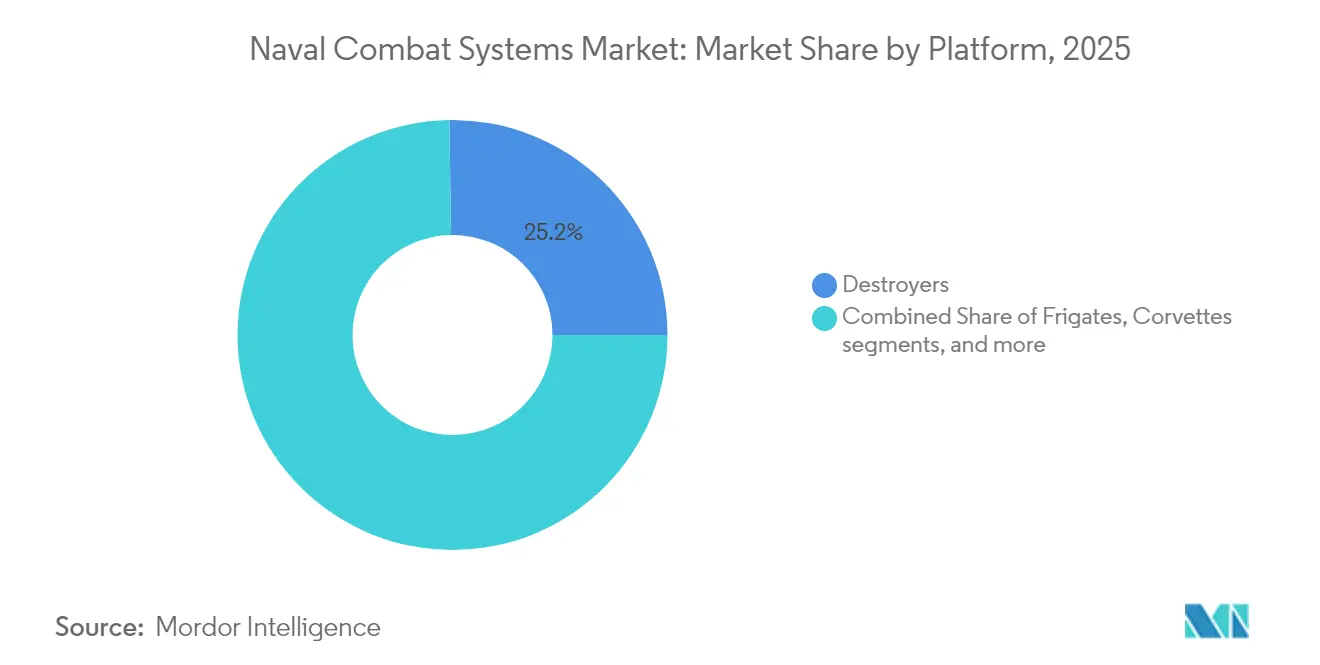
- By platform, destroyers accounted for 25.23% of the naval combat systems market size in 2025; unmanned surface vessels are projected to grow at an 8.18% CAGR through 2031.
- By geography, North America held 37.44% revenue share in 2025, but Asia-Pacific records the highest projected CAGR at 6.58% to 2031.
Note: Market size and forecast figures in this report are generated using Mordor Intelligence’s proprietary estimation framework, updated with the latest available data and insights as of 2026.
Global Naval Combat Systems Market Trends and Insights
Drivers Impact Analysis*
| Driver | (~) % Impact on CAGR Forecast | Geographic Relevance | Impact Timeline |
|---|---|---|---|
| Fleet-modernization programs in major navies | +1.8% | North America, Asia-Pacific, Europe | Medium term (2-4 years) |
| Rising Indo-Pacific geopolitical tensions | +1.5% | Asia-Pacific, spill-over to North America and Europe | Short term (≤ 2 years) |
| Rapid uptake of integrated combat-management suites | +1.2% | Global | Medium term (2-4 years) |
| Expansion of naval electronic warfare (EW) and C4ISR demand | +1.0% | Global contested maritime domains | Long term (≥ 4 years) |
| Shift to distributed unmanned surface/underwater fleets | +0.9% | North America and Asia-Pacific | Long term (≥ 4 years) |
| DevSecOps-based “continuous upgrade” architectures | +0.7% | North America and Europe | Medium term (2-4 years) |
| Source: Mordor Intelligence | |||
Fleet-modernization programs in major navies
Global fleet-renewal initiatives are moving away from hull-replacement cycles and toward capability-centric buys that demand plug-and-play combat suites. Gray Flag 2024 validated joint software baselines that let allied warships share targeting data in minutes rather than hours.[1]Kyle Mizokami, “Gray Flag 24 Demonstrates Joint Maritime Integration,” navy.mil Australia’s pledge to more than double its surface force by 2034 drives a pivot from frigate-heavy constructs to distributed formations requiring advanced sensor fusion.[2]Mike Yeo, “Australia’s New Surface Fleet Plan,” defensenews.com Germany’s 2035 blueprint stresses modular mission packages, confirming that future hulls will outlive their first combat-system fit. Japan’s co-development of next-generation frigates with Australia shows how partners pool R&D to speed entry into service. Together, these actions channel steady funding into the naval combat systems market and ensure multi-decade sustainment demand.
Rising Indo-Pacific Geopolitical Tensions
Beijing’s deployment of the carrier Fujian has compressed acquisition lead times across Asia-Pacific, pushing navies to field hardware ahead of schedule.[3]Jackson Kwok, “Fujian Carrier Readies for Sea Trials,” scmp.com Multilateral patrols in the South China Sea illustrate how operational coalitions dictate real-time capability swaps rather than paper upgrades. Amphibious capacity is surging as regional states prepare for distributed operations, raising demand for integrated air-defence and strike packages. Japan’s dual-carrier tasking during RIMPAC underscores an elevated sortie tempo that tests combat-system resilience in prolonged deployments. New bilateral forums on defence industrial cooperation institutionalise technology transfers that expand the naval combat systems market footprint.
Rapid Uptake of Integrated Combat-Management Suites
The first shipboard certification of a virtualised Aegis baseline signals a decisive shift toward software-defined warfighting. NAVWAR’s classified DevSecOps pipeline enables overnight code drops that bypass multi-month certification lags. The “Compile to Combat in 24 Hours” mandate now frames acquisition milestones, forcing primes to re-architect legacy suites for continuous delivery. Saab’s AI-enabled decision agents point to future consoles where human operators supervise rather than direct engagements. As a result, software agility—rather than displacement tonnage—has become the primary value driver within the naval combat systems market.
Expansion of Naval Electronic-Warfare and C4ISR Demand
Modern maritime operations are fought in the electromagnetic spectrum. L3Harris milestones on the F/A-18 upgrade refresh airborne jamming lethality. The Next Generation Jammer reached IOC in 2024 and can evolve threats through software patches alone. Northrop Grumman’s GaN radar modules raise power density but depend on a fragile minerals supply chain. French patrol vessels now ship with counter-UAS kits as a baseline fit, reflecting how the navy C4I extends to drone engagement. Fleet-wide installation contracts awarded to HII confirm that every hull, not only flagships, now requires robust electronic-warfare nodes.
Restraints Impact Analysis*
| Restraint | (≈) % Impact on CAGR Forecast | Geographic Relevance | Impact Timeline |
|---|---|---|---|
| Budget caps delaying surface-combatant procurement | −0.8% | Europe, secondary markets | Short term (≤ 2 years) |
| Extended weapon-integration certification cycles | −0.6% | North America and Europe | Medium term (2-4 years) |
| Cyber-vulnerability of network-centric warships | −0.4% | Global | Long term (≥ 4 years) |
| GaN radar-chip supply-chain bottlenecks | −0.3% | Global | Short term (≤ 2 years) |
| Source: Mordor Intelligence | |||
Budget Caps Delaying Surface-Combatant Procurement
Tight ceilings have pushed the Constellation frigate two years right, rippling across allied co-production slots and stretching supplier cash-flow profiles.[4]Government Accountability Office, “2025 Weapon Systems Annual Assessment,” gao.gov French planners face hard trade-offs between sustaining today’s fleet and funding Horizon destroyer renewals. Canberra’s massive shipbuilding plan must juggle domestic yard throughput with imported subsystems, risking schedule mismatch. When budgets lag, yards struggle to maintain skilled labor pipelines, raising cost per tonne and deferring combat-system buys that feed the naval combat systems market.
Extended Weapon-Integration Certification Cycles
Average 38-month certification windows hamper rapid fire-control handoff across new missiles and sensors. LRASM integration on the F-35 reveals how each new weapons pair multiplies lab, range, and cyber-safety test points. DOT&E reporting shows CVN 78 test events stretching into FY27, proving that big-deck weapon clearances can span several budget cycles. Unless risk-based pathways mature, these lags will curb the speed at which fresh capability flows into the naval combat systems market.
*Our forecasts treat driver/restraint impacts as directional, not additive. The impact forecasts reflect baseline growth, mix effects, and variable interactions.
Segment Analysis
By Type: Directed-Energy Systems Accelerate Transition
Directed Energy Weapons claimed the fastest trajectory with a 9.44% CAGR forecast, supported by successful HELIOS proofs aboard Burke-class destroyers that validated beam-control stability at sea. Weapon Systems still hold a 45.02% slice of the naval combat systems market share for 2025, reflecting enduring demand for kinetic strike but acknowledging an inflection toward energy arms. Electronic-warfare suites secured multiyear funding upticks because electromagnetic denial dominates early-phase conflict. C4ISR packages ride the same wave, driven by a joint all-domain doctrine that links space, air, and surface sensors. Integrated combat software anchors every package, allowing navies to deploy updates between patrols and protecting the naval combat systems market size advantage for primes able to scale agile pipelines. Unmanned sea-system payload bays are being pre-wired for directed-energy turrets, ensuring backwards compatibility with future high-power modules. Training and simulation investments keep pace, as evidenced by the USD 563 million contract to J.F. Taylor, without which crews could not rehearse complex multi-domain kill chains.


By Platform: Unmanned Surface Vessels Redefine Force Design
Destroyers dominate high-end integration budgets, holding 25.23% of 2025 spending yet sharing the spotlight with unmanned surface vessels that grow at 8.18% CAGR. Jack H. Lucas (DDG 125) delivered with SPY-6 and virtualized Aegis stacks, cementing destroyers as premier test beds for next-gen suites. Frigates are rebounding as cost-controlled multi-mission assets; Australia is weighing Japan’s Mogami-class to hedge delivery risk. Corvettes maintain regional deterrence roles but rely on exportable combat suites rather than bespoke fits. Submarines remain strategic, validated by Norway’s Ula-class mid-life upgrade contract. Aircraft carriers carry the heaviest integration burden yet face protracted certification gates, demonstrated by USS Gerald R. Ford’s extended trials. Littoral Combat Ships pivot to mine-countermeasure conversion as survivability debates erode blue-water missions. Unmanned underwater vehicles join surface drones to deliver distributed lethality. Collectively, these patterns elevate software portability, ensuring any hull—manned or unmanned can run common combat-system kernels, sustaining long-term expansion of the naval combat systems market.
Geography Analysis
North America retained 37.44% of 2025 revenue as the largest regional naval combat systems market contributor. The US Navy’s FY25 topline preserved multi-billion funding lines for Aegis, Next Generation Jammer, and the long-range surface drone program that added 49 hulls in 2024. HII’s USD 3 billion umbrella contract amplifies the region’s pull-through effect on subsystem suppliers. At the same time, partnerships with South Korean yards hint at a blended production model that externalises capacity to allies. Canada’s CSC frigate and Mexico’s OPV modernization widen the customer base, though still modest in dollar terms. Across the region, primes prioritise secure DevSecOps pipelines to comply with zero-trust directives and protect an expansive naval combat systems market.
Asia-Pacific is the fastest-growing theatre at 6.58% CAGR to 2031. Fujian’s sea trials triggered accelerated Japanese, Indian, and Korean fleet renewals; each now embeds open-architecture combat suites to guarantee allied plug-in during coalition missions. Australia’s decision to double its surface fleet unleashes a USD 10 billion opportunity actively courted by Japanese yards offering the Mogami-class. The Hudson Institute reports that Japan could fill US capacity gaps by exporting turnkey combatants, a scenario that multiplies subsystem orders anchored in the naval combat systems market. India’s adoption of KONGSBERG logistics suites for five ships widens Scandinavian supplier reach.
Europe shows steady, policy-driven growth. Berlin’s 2035 naval plan funds modular combat suites for F126 frigates, prioritising software refresh over hull count. Paris co-finances Horizon destroyer upgrades with Rome, reinforcing Franco-Italian radar and missile chains. London’s Type 83 concept champions a software-centric core but grapples with pacing against cyber-hardening targets. Madrid and Oslo upgrade legacy tonnage through competitively tendered CMS refits. While aggregated European budgets trail US outlays, pooled R&D and standardised interfaces sustain a robust, export-oriented Naval Combat Systems market.

Regulatory Landscape
Naval combat systems procurement and modernization are shaped by defense-specific airworthiness, safety, and qualification rules that affect integration schedules and cost. In the United States, shipboard combat-system changes must align with Navy technical authority requirements and qualification regimes such as OPNAVINST 9072.2B (updated 2024), which drives shock-hardness demonstration and verification for new and modernized integrated ship systems, affecting radar, consoles, launchers, and mission-system cabinets.
Interoperability and coalition operations add another compliance layer through NATO standardization. NATO Interoperability Standards and Profiles (NISP) and STANAG-driven interface requirements influence C2, data links, and combat-management software baselines, which pushes vendors toward demonstrable compliance across allied fleets. In Europe, EU-level security and defense actions (for example, SAFE-related procurement financing mechanisms and Council decisions tied to maritime security operations) reinforce demand for compliant, interoperable systems and can affect procurement timelines for Member States conducting urgent buys.
Value Chain Analysis
The naval combat systems value chain runs from R&D (sensors, EW, combat-management software, weapons interfaces, and cyber-hardening) through government contracting and platform selection, then into shipyard production and combat-system integration, followed by long-term sustainment, updates, and mid-life modernizations. Prime shipbuilders and combat-system integrators coordinate multi-vendor architectures (including Aegis-led integration models), while subsystem specialists supply radars, sonars, EW suites, launchers, and mission computing that must be qualified as an integrated ship system.
Integration and sustainment capture a large share of lifetime value as fleets move toward continuous software upgrade models (DevSecOps) and modular refreshes rather than one-time hardware fits. Upstream constraints remain influential, particularly microelectronics and strategic materials for GaN-based radars, as well as castings/forgings, munitions, and energy storage components. Recent shipbuilding governance choices, including the U.S. Navy using a Vessel Construction Manager approach for the Medium Landing Ship program, also illustrate how navies are expanding the industrial base and changing execution models, which affects supplier qualification, interfaces, and test/acceptance workflows for combat-system equipment.
Competitive Landscape
Market concentration remains moderate as primes exploit integration track records while new entrants target micro-niches. Lockheed Martin virtualised Aegis to cut upgrade windows from months to hours, preserving incumbency on US and allied programs. BAE Systems leverages combat-air synergies to pitch cross-domain mission data clouds. RTX doubles down on gallium-nitride radar monopolies but hedges supply risk by co-funding alternative wafer fabrication lines. HII couples shipbuilding with autonomous-systems IP, evidenced by the Lionfish SUUV milestone shipment. Saab and Babcock form mid-tier coalitions to chase exportable surface combatants that tilt European market share.
Competitive energy swings to software agility. Small firms offering containerised cyber-defence agents win carve-outs on legacy fleet refreshes. AI-enabled fire-control add-ons, exemplified by Saab’s BVR agent, threaten to displace larger primes in point solutions.[5]Gareth Jennings, “Saab AI Agent Advances,” flightglobal.com Supply-chain resilience is now a big discriminant; vendors with secure gallium and rare-earth sources score higher in risk evaluations. International joint ventures proliferate, aligning R&D cost pools with alliance defence strategies and widening naval combat systems market access.
Primes respond by embedding DevSecOps into conops. Continuous Authority to Operate frameworks let fleet commanders field patches during patrols, eroding prior barriers where hardware primes dominated post-delivery sustainment. The race now pivots to who can prove machine-speed integration testing without compromising safety cases. Over the forecast horizon, expect deeper vertical tie-ups between chip foundries, software houses, and shipbuilders to defend position in the expanding naval combat systems market.
Naval Combat Systems Industry Leaders
Lockheed Martin Corporation
RTX Corporation
Thales Group
BAE Systems plc
Northrop Grumman Corporation
- *Disclaimer: Major Players sorted in no particular order


Market Opportunities and Future Outlook
The clearest opportunity is fleetwide modernization that pairs advanced sensors and EW with software-defined combat-management baselines, creating repeatable upgrade demand across existing destroyers, frigates, and amphibious fleets. In 2026, the U.S. Navy acceptance of two modernized Arleigh Burke-class destroyers ahead of schedule, using SEWIP Block 3 electronic attack systems and SPY-6 radar variants, provides evidence of accelerated retrofit cycles. The U.S. Navy awarding RTX a USD 515 million SPY-6 family contract further indicates the scale of the radar refresh pipeline. Parallel momentum in combat-system software architectures is reflected in the delivery of the first Integrated Combat System enabled baseline (Aegis BL9.C3.0) to the U.S. Navy, supporting recurring cycles of integration, certification, and deployment across multiple hulls.
International mid-life upgrades and new-build combat-system packages add additional whitespace beyond the largest U.S. programs, especially where navies look for interoperable, open-architecture suites with sovereign sustainment options. Examples during 2026 include Leonardo signing a EUR 320 million contract to provide next-generation naval combat systems for the Kuwait Navy Al Dorra missile boat program, and Greece progressing a Hydra-class frigate modernization centered on Thales Nederland combat-system integration. In Europe, BAAINBw commissioning Rheinmetall and MBDA to develop a high-energy laser weapon system for the German Navy (targeted for operational status by 2029) supports a pipeline for directed-energy integration, power and thermal management upgrades, and combat-management/fire-control adaptations that extend beyond initial demonstrators.
Recent Industry Developments
- July 2026: Lockheed Martin received a USD 1.38 billion U.S. Navy contract for Aegis ship integration and testing support services. The award reinforces Aegis as a core integration framework across multiple ship classes and sustains demand for certification, lab testing, and fleetwide software and hardware integration services.
- June 2026: RTX (Raytheon) won a USD 515 million U.S. Navy contract for the SPY-6 family of radars, covering production and upgrade activity across variants. The contract supports high-end air and missile defense modernization and anchors a radar supply chain spanning arrays, processors, and shipboard integration work.
- December 2024: RTX (Raytheon) was awarded a USD 590 million production contract for the Next Generation Jammer Mid-Band system for the U.S. Navy and the Royal Australian Air Force. Multi-nation fielding of an advanced EW system strengthens the installed base for electronic attack upgrades and associated mission-system integration on carrier air wings and allied platforms.


Research Methodology Framework and Report Scope
Market Definition and Coverage
For this study, the market is defined as the value of onboard combat-related systems procured, integrated, or upgraded on naval platforms, covering the core mission systems that enable detection, decision support, and engagement at sea.
Scope exclusions: Land-based coastal-defense batteries and shore command centers are not counted in this market sizing.
Segmentation Overview
- By Type
- Weapon Systems
- Electronic Warfare (EW)
- C4ISR
- Directed Energy Weapons (DEW)
- Integrated Combat Systems
- Unmanned Sea Systems
- Simulation and Training Systems
- Combat-Management Software
- By Platform
- Aircraft Carriers
- Destroyers
- Frigates
- Corvettes
- Submarines
- Littoral Combat Ships (LCS)
- Unmanned Surface Vessels (USV)
- Unmanned Underwater Vehicles (UUV)
- Other Platforms
- By Geography
- North America
- United States
- Canada
- Mexico
- Europe
- United Kingdom
- France
- Germany
- Italy
- Spain
- Rest of Europe
- Asia-Pacific
- China
- India
- Japan
- Australia
- Rest of Asia-Pacific
- South America
- Brazil
- Rest of South America
- Middle East and Africa
- Middle East
- Saudi Arabia
- Israel
- Rest of Middle East
- Africa
- Egypt
- South Africa
- Rest of Africa
- Middle East
- North America
Data Sources, Market Sizing, and Validation
Desk Research
Desk research is used to set the market boundaries clearly and to build the first version of the demand and supply picture using public defense signals. We rely on sources such as government budget documents and procurement releases, defense ministry and naval force publications, parliamentary or audit reports, and customs or trade statistics where they exist for relevant electronics and defense subassemblies.
To keep assumptions grounded, we also review think tank and defense policy briefs, peer-reviewed journals on maritime systems, and standards or technical references related to naval communications, radar, and interoperability. For supplier context, we use public annual reports, investor presentations, and contract announcements, supported by paid subscriptions for company financials and intelligence, news and financials, global contracts and tenders, and patent databases when contract details are not available in open sources. The sources named here are illustrative and not exhaustive, and many other public materials were also used for data collection, validation, and clarification.
Primary Interviews and Surveys
Primary work is used to test what desk research suggests and to close gaps around platform fit, upgrade timing, and typical contract value ranges. We speak with a mix of naval procurement and operations stakeholders, system integration teams, subsystem specialists, and aftermarket support participants across major shipbuilding and modernization regions, which helps us validate demand drivers and correct assumptions that were too broad from public procurement signals.
Distribution of primary research fieldwork respondents
| Company type | Respondent position | Region |
|---|---|---|
| Top tier: 31% | CXOs: 14% | APAC: 38% |
| Mid tier: 52% | Functional/Unit leaders: 29% | EMEA: 35% |
| Smaller Players: 17% | Managers: 57% | Americas: 27% |
Market-Sizing & Forecasting
Sizing begins with a top-down build that reconstructs the addressable demand pool from fleet plans and defense procurement patterns, then applies platform-level fit rates for combat-system installation and modernization cycles. The totals are corroborated using selective bottom-up approximations, such as sampling disclosed contract values for combat management upgrades, sensor and C4ISR refresh programs, and weapon-control integration work, followed by simple ASP times shipset checks where disclosure is sufficient.
A few practical inputs steer the model and keep it repeatable, including active fleet size by major platform classes, new-build deliveries versus refit volumes, typical mid-life upgrade cadence for sensors and mission systems, the adoption intensity of electronic warfare and countermeasure suites, and the share of budgets moving toward integrated combat systems and unmanned surface or underwater packages. When country program detail is limited, proxy indicators like published ship-class roadmaps, budget direction, and regional spending shares are used, then corrected based on expert feedback.
For forecasting, scenario analysis is used because naval procurement is lumpy and tied to multi-year planning, and the scenarios reflect budget stability, upgrade acceleration, and delivery slippage. The forward path is finally checked against expert views on replacement cycles and integration capacity so the growth curve stays realistic.
Data Validation & Update Cycle
Outputs are triangulated against independent signals such as contract award flow, fleet delivery calendars, and country defense spending direction, which helps flag outliers early. Variance checks are run at platform and regional levels, and anomalies are reviewed in multiple steps before sign-off, including a second-analyst review of key inputs and calculation links.
If a major modernization program is delayed, re-scoped, or accelerated, relevant experts are re-contacted to confirm timing and value impact, and the model is updated. The report is refreshed annually, with interim updates for material events, and a final pre-delivery pass is completed so clients receive the latest updated view.
Mordor Intelligence's Naval Combat Systems Market Size Versus Other Published Estimates
Published market sizes for naval combat systems often do not match because the included spend pool can shift between onboard combat suites and wider naval defense spending. Gaps also occur when one source uses constant dollars and another uses current-year currency, or when upgrade work is treated as irregular rather than a recurring modernization cycle.
Key drivers behind the differences are usually scope inclusions and the way platform coverage is handled. Some estimates widen the market by combining adjacent areas like broader ship electronics and training tools, and others narrow it by excluding integration-heavy portions that are harder to observe from public sources.
Benchmark comparison
| Source | Market Size | Gaps in Research Methodology |
|---|---|---|
| Mordor Intelligence | USD 57.08 B (2026) | |
| Industry Research Publisher A | USD 36.48 B (2025) | Uses a smaller starting base year and appears to count a narrower set of combat-system categories, which can miss multi-year integration and upgrade work spread across several platform classes. |
| Industry Research Publisher B | USD 57.60 B (2026) | Reaches a similar year value but seems to apply a wider basket of naval electronics, which can blur the split between onboard combat suites and other shipborne electronics spending. |
The table shows that alignment on the year alone does not remove the spread, since what gets counted still varies. Under Mordor Intelligence's scope, the value is tied to onboard combat-system procurement and modernization on naval platforms, and land-based coastal-defense batteries and shore command centers sit outside scope, which is one concrete reason totals differ across sources.


Key Questions Answered in the Report
What is the current size of the Naval Combat Systems market?
The naval combat systems market is valued at USD 57.08 billion in 2026.
How fast will the Naval Combat Systems market grow by 2031?
It is forecasted to expand at a 6.40% CAGR, reaching USD 77.83 billion.
Which platform segment is growing the quickest?
Unmanned surface vessels (USV) show the fastest rise with an 8.18% CAGR through 2031.
What technology trend is reshaping procurement decisions?
Virtualised, software-defined combat-management suites that can receive overnight updates now guide many acquisition strategies.
Why are gallium-nitride chips a concern for the market?
Export restrictions on key gallium compounds threaten radar production schedules, posing a short-term drag on deployment timelines.
Which region will see the strongest demand acceleration?
Asia-Pacific is projected to grow at 6.58% CAGR, buoyed by intensified geopolitical tensions and large fleet-expansion programs.
Page last updated on:


