Natural Fiber Reinforced Composites Market Size and Share
Market Overview
| Study Period | 2021 - 2031 |
|---|---|
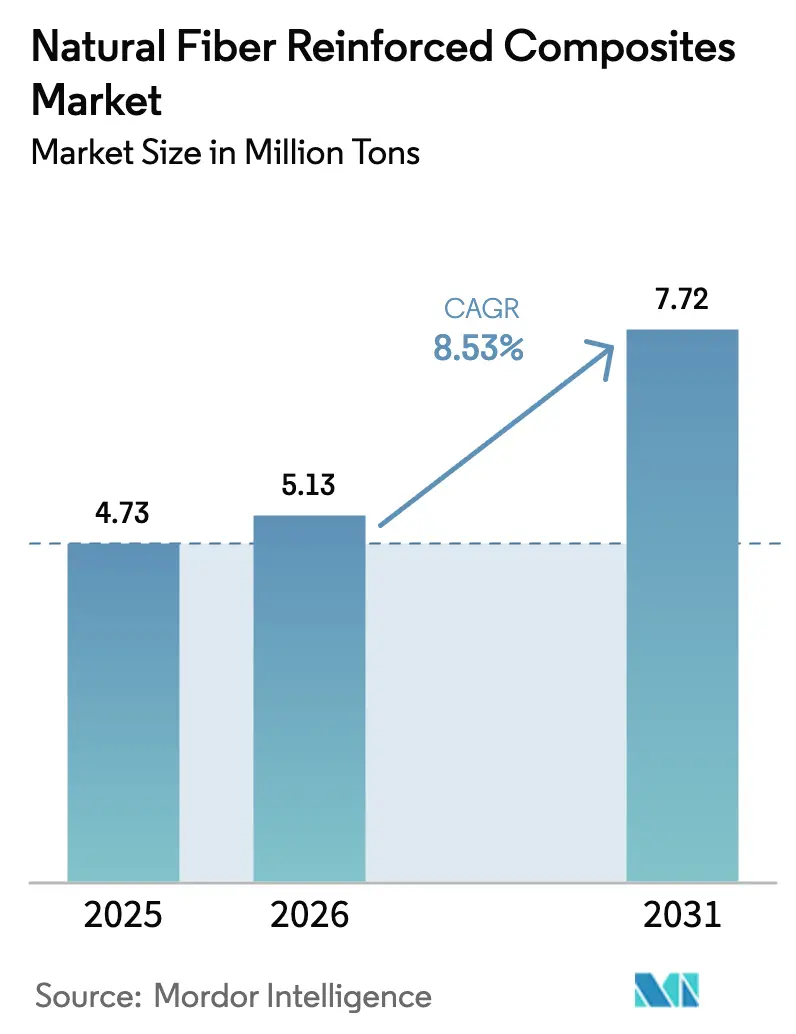
| Market Volume (2026) | 5.13 Million tons |
| Market Volume (2031) | 7.72 Million tons |
| Growth Rate (2026 - 2031) | 8.53% CAGR |
| Fastest Growing Market | Asia-Pacific |
| Largest Market | Asia Pacific |
| Market Concentration | Low |
Major Players *Disclaimer: Major Players sorted in no particular order Image © Mordor Intelligence. Reuse requires attribution under CC BY 4.0. | |
Natural Fiber Reinforced Composites Market Analysis by Mordor Intelligence
The Natural Fiber Reinforced Composites Market size is expected to grow from 4.73 Million tons in 2025 to 5.13 Million tons in 2026 and is forecast to reach 7.72 Million tons by 2031 at 8.53% CAGR over 2026-2031. Demand acceleration stems from electrified-vehicle lightweighting mandates, construction-sector green-building credits, and renewable-energy blade redesigns that specify bio-based content. Automotive tier-1 suppliers are aligning bills-of-materials with the European Union’s End-of-Life Vehicle Directive, swapping glass fiber for bast fibers to meet 85% reusability targets. Construction specifiers now earn LEED and BREEAM points for decking or cladding that embeds lignocellulosic fillers, lifting order volumes for wood-plastic composites. Thermoplastic matrices dominate because polypropylene can be injection-molded at high throughput, while new bio-based polymers are cutting resin costs by more than 20% at NatureWorks’ 75,000 tpa Thailand plant. Asia-Pacific leads volume on the strength of China’s recyclability rulings and India’s home-improvement boom; Europe ranks second yet sets the technology pace through supercritical-CO₂ fiber treatment and servo-hydraulic compression presses.
Key Report Takeaways
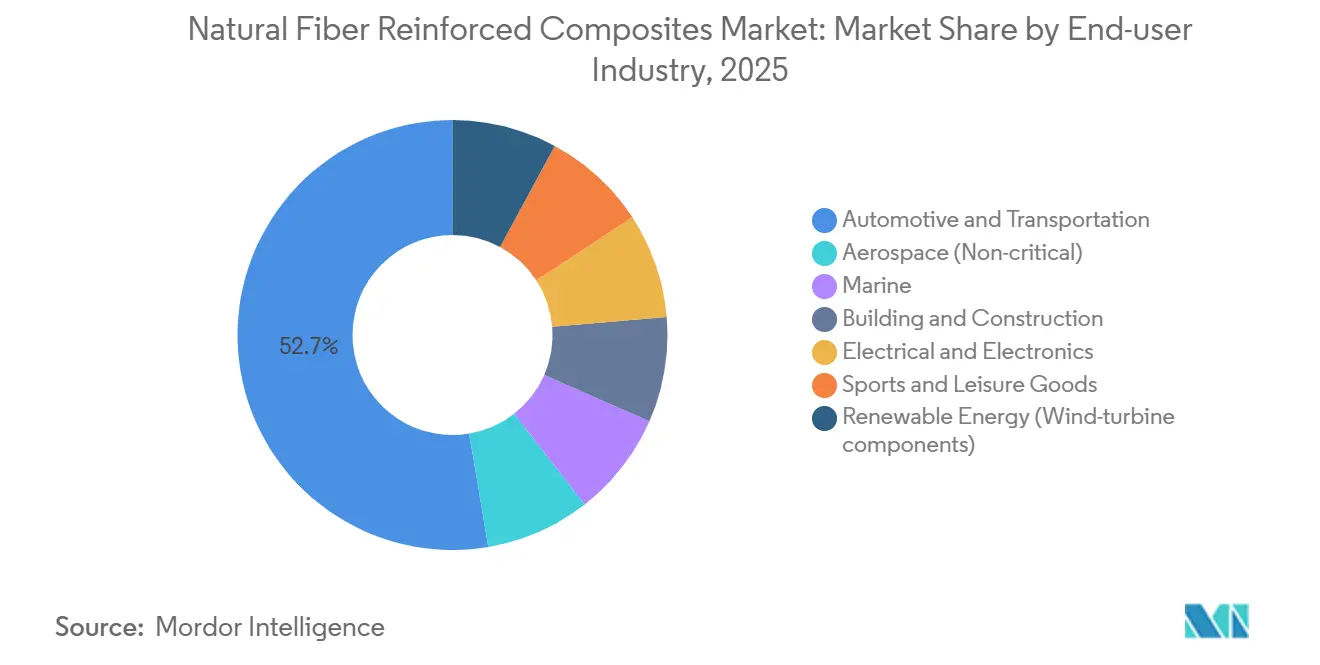
- By end-user industry, automotive accounted for 52.66% of natural fiber reinforced composites market share in 2025, whereas renewable energy is advancing at a 9.91% CAGR through 2031.
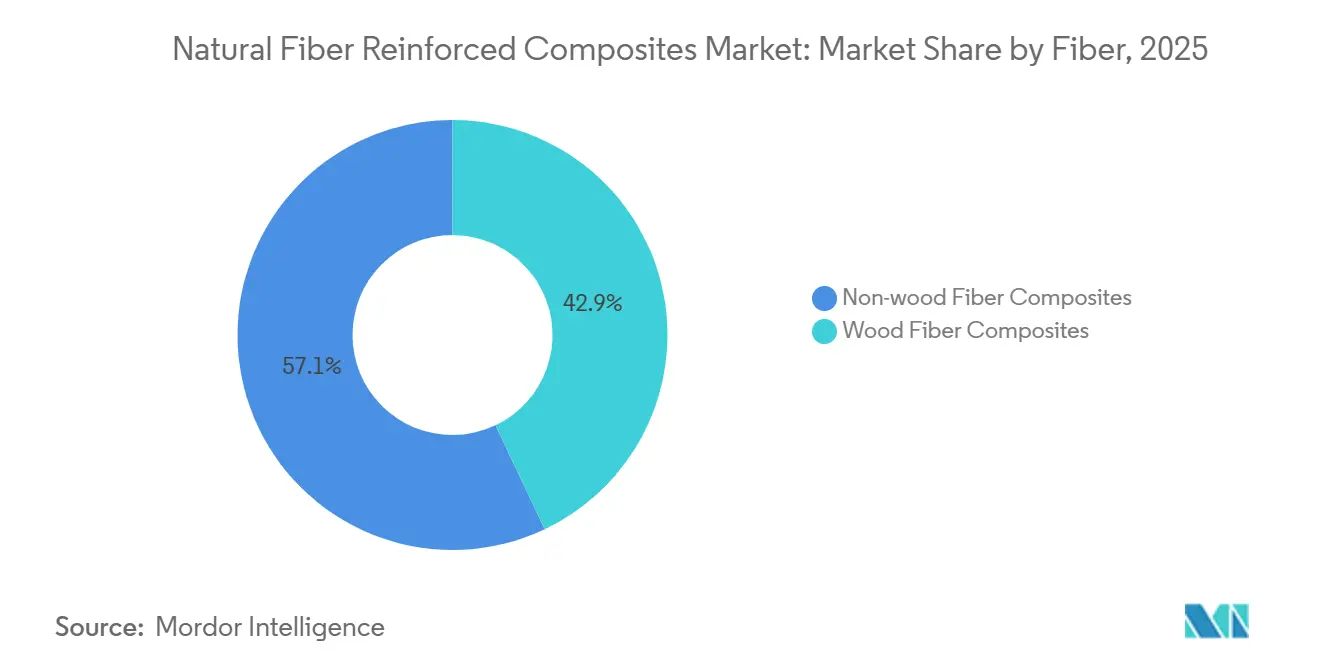
- By fiber type, wood commanded 42.94% share of natural fiber reinforced composites market size in 2025, while non-wood fibers are expanding at a 9.45% CAGR.
- By polymer matrix, thermoplastics led with 55.82% of natural fiber reinforced composites market share in 2025; bio-based polymers hold the fastest-growing lane at 9.21% CAGR.
- By processing route, compression molding contributed 47.65% of the natural fiber reinforced composites market size in 2025, yet additive manufacturing is forecast to climb at a 9.67% CAGR through 2031.
- By geography, Asia-Pacific captured 42.25% natural fiber reinforced composites market share in 2025 and is forecast to rise at 9.10% CAGR through 2031.
Note: Market size and forecast figures in this report are generated using Mordor Intelligence’s proprietary estimation framework, updated with the latest available data and insights as of January 2026.
Global Natural Fiber Reinforced Composites Market Trends and Insights
Drivers Impact Analysis*
| Drivers | (~) % Impact on CAGR Forecast | Geographic Relevance | Impact Timeline |
|---|---|---|---|
| Legislative pressure for vehicle recyclability targets | +2.1% | Europe, North America, China | Medium term (2-4 years) |
| Rapid adoption of lightweighting in EV platforms | +2.5% | Global, APAC core with spill-over to North America | Short term (≤ 2 years) |
| Advancements in high-throughput injection and compression molding lines | +1.4% | North America, Europe, APAC manufacturing hubs | Medium term (2-4 years) |
| Shift toward green-building certifications in construction materials | +1.2% | North America, Europe, select APAC metros | Long term (≥ 4 years) |
| Emergence of super-critical CO₂ fiber-modification lines enabling semi-structural parts | +0.9% | Europe, North America R&D clusters | Long term (≥ 4 years) |
| Source: Mordor Intelligence | |||


Legislative Pressure for Vehicle Recyclability Targets
The updated EU End-of-Life Vehicle Directive active since 2024 obliges automakers to achieve 85% mass recyclability or face fines of EUR 500 per non-compliant car, stimulating immediate substitutions toward flax and hemp door modules. China’s Ministry of Industry and Information Technology followed with a 90% recyclability rule for domestic brands by 2030, triggering pilot procurement of bast-fiber battery enclosures. OEMs feel indirect pressure because California assigns lifecycle carbon scores to part dossiers, tilting sourcing toward bio-based compounds with 60% lower embodied CO₂ than virgin polypropylene. BMW secured a long-term offtake contract with Bcomp in 2025 to guarantee flax supply and avoid regulatory penalties[1]BMW Group, “BMW Expands Use of Flax Composites,” bmwgroup.com. As legislative deadlines converge, the natural fiber reinforced composites market experiences embedded demand pull across three continents.
Rapid Adoption of Lightweighting in EV Platforms
Battery-electric cars carry 200 kg extra mass that erodes driving range; substituting glass fiber with hemp composite trims 15% weight from seat backs and parcel shelves, translating to roughly 0.3 km additional range per kilogram saved and USD 15 battery savings per car. Laboratory tests in 2025 showed hemp-PP compounds achieving 85 MPa tensile strength and 6.5 GPa flexural modulus, closing the performance gap with glass fiber. Tesla flagged natural fiber parts as a cost-down lever for its forthcoming Model 2, indicating diffusion beyond premium European marques[2]Tesla, “Supplier Summit 2024 Materials Brief,” tesla.com. Chinese start-ups NIO and XPeng have moved flax door-panel programs into validation for 2027 production, underscoring the global scope of EV-linked pull. These moves accelerate penetration in the natural fiber reinforced composites market ahead of drivetrain parity timelines.
Advancements in High-Throughput Injection and Compression Molding Lines
Cycle times for compression-molded natural fiber sheets fell from 180 s in 2020 to below 90 s after the installation of servo-hydraulic presses with closed-loop temperature and fiber-length control. Twin-screw extruders maintain bast-fiber aspect ratios above 20:1, elevating tensile strength by 25% and enabling substitution in semi-structural brackets. FlexForm’s 2025 Michigan expansion adds 12 large-tonnage machines, validating economies of scale for 50,000-unit automotive programs. Tool life has risen past 500,000 shots, bringing cost parity with glass-fiber molds and smoothing procurement hurdles for tier-1 suppliers. These throughput gains make the natural fiber reinforced composites market competitive in high-volume settings that were formerly out of reach.
Shift Toward Green-Building Certifications in Construction Materials
LEED v4.1 and BREEAM 2024 award credits when bio-based content tops 25% by mass, prompting architects to select wood-plastic composites for decking and cladding. Trex reported that 68% of its Q3 2024 revenue stemmed from decking that qualifies for LEED points, proving pricing power in certified projects. Germany’s DGNB introduced a carbon threshold in 2025 that façade materials must meet, favoring wood-fiber PVC profiles able to sequester 15 kg CO₂ per square meter. UPM Formi earned BREEAM Excellent ratings on three U.K. offices in 2025, illustrating that certification has become a ticket to play. The 3%–5% price premium on certified composites offsets their 10%–15% material cost penalty, reinforcing growth in the natural fiber reinforced composites market.
Restraints Impact Analysis*
| Restraints | (~) % Impact on CAGR Forecast | Geographic Relevance | Impact Timeline |
|---|---|---|---|
| Moisture absorption causing dimensional instability | -1.3% | Global, acute in tropical and coastal regions | Short term (≤ 2 years) |
| Limited thermal stability restricting high-temperature processing | -0.9% | Global, particularly Europe and North America | Medium term (2-4 years) |
| Rising biodigestion demand competing for lignocellulosic feedstock | -0.7% | Europe, North America agricultural zones | Long term (≥ 4 years) |
| Source: Mordor Intelligence | |||
Moisture Absorption Causing Dimensional Instability
Natural fibers absorb 8%–12% water at 85% relative humidity, swelling parts and weakening matrix bonds. Secondary polyurethane coatings or poly-ethylene co-extrusion add USD 0.40–0.60 per kg to manufacturing costs, while acetylation cuts moisture uptake to 4% but inflates fiber prices by 25%. A 2025 ORNL study showed 15% flexural-strength loss after 1,000 h exposure to 95% humidity for hemp-PP panels. Marine uses remain confined to above-waterline cabin modules, and automotive exterior-body integration is delayed until multilayer barriers or hybrid glass skins become routine. This constraint slows adoption in the natural fiber reinforced composites market for moisture-exposed applications.
Limited Thermal Stability Restricting High-Temperature Processing
Cellulosic fibers start degrading at 180 °C, capping processing windows at 160 °C–180 °C. Polyamide 6 and polybutylene terephthalate require ≥220 °C melt temperatures, preventing bast-fiber reinforcement. Under-hood parts facing 120 °C ambient and 150 °C spikes therefore stick with glass-fiber PA6. Thermosets cure at lower temperatures but hinder recyclability. TECNARO’s lignin-based ARBOFORM resin illustrates partial mitigation but still degrades fibers during compounding above 190 °C. Without breakthroughs that lift the temperature ceiling, the natural fiber reinforced composites market remains skewed toward interior and semi-structural parts, limiting penetration to roughly 60% of the broader composites opportunity set.
*Our forecasts treat driver/restraint impacts as directional, not additive. The impact forecasts reflect baseline growth, mix effects, and variable interactions.
Segment Analysis
By Fiber: Wood Dominates, Non-Wood Accelerates on Performance Gains
Wood fiber captured 42.94% natural fiber reinforced composites market share in 2025 owing to its low feedstock cost and established decking supply chains. Non-wood bast fibers will post a 9.45% CAGR through 2031 as BMW and Volvo integrate flax door panels that are 25% thinner yet meet crash stiffness. Hemp decortication capacity in Canada and the U.S. quadrupled between 2024 and 2026, ensuring supply for automotive programs. European projects also blend kenaf and jute into seat shells, raising mechanical efficiency per kilogram.
In parallel, cotton waste feeds sound-insulation mats for EV cabins, and banana and sisal fibers support trunk-liner production in Brazil. Bcomp’s ampliTex woven flax unlocks semi-structural aerospace panels that carry 40% premiums over commodity wood flour, nudging suppliers up the value chain. As carbon-reduction metrics grow stricter, OEMs favor fibers that deliver the highest stiffness-to-CO₂ ratio, tilting future growth toward premium bast fibers within the natural fiber reinforced composites market.

By Polymer Matrix: Thermoplastics Lead, Bio-Based Polymers Gain Traction
Thermoplastics comprised 55.82% of the 2025 volume, driven by polypropylene’s compatibility with 170 °C molding windows. Mechanical recycling loops lower lifecycle costs for injection-molded interior trims. However, bio-based polymer demand is rising at a 9.21% CAGR. NatureWorks’ Ingeo PLA cost fell to USD 2.20 per kg after its Thai expansion, enabling PLA-flax blends in consumer electronics casings at cost parity with ABS. Thermosets stay relevant for wind-turbine spars and marine hulls where resin-transfer molding locks in high glass-transition temperatures, despite recycling obstacles. Polyvinyl chloride with pine flour reinforces window profiles for stringent fire codes, sidestepping halogenated flame retardants. Overall, divergent resin paths reflect end-market needs: automotive pushes recycled PP blends, construction prefers PVC wood composites, and renewable-energy players shift toward epoxy bast-fiber hybrids.
By Processing Technology: Compression Molding Prevails, Additive Manufacturing Emerges
Compression molding accounted for 47.65% natural fiber reinforced composites market size in 2025, as servo-hydraulic presses process large underbody shields in 75 s cycles. Additive manufacturing is the fastest-growing route at 9.67% CAGR, buoyed by large-format 3D printers that deposit 40% flax PLA pellets. Wind-turbine service providers now print topology-optimized inspection drone housings, cutting turnaround time from six weeks to five days. Injection molding owns complex geometries, maintaining fiber lengths above 3 mm with twin-screw extruders. Pultrusion produces utility-pole cross-arms with 55% flax volume fractions, lowering mass by 30% vs. steel. As tool makers integrate real-time fiber-orientation sensing, scrap rates fall below 2%, elevating buyer confidence within the natural fiber reinforced composites market.
By End-User Industry: Automotive Dominates, Renewable Energy Surges
Automotive deliveries represented 52.66% natural fiber reinforced composites market share in 2025; OEM programs scale rapidly because every kilogram removed from an EV saves USD 15 in battery cost. Renewable energy will record the fastest growth, 9.91% CAGR, because offshore blade OEMs adopt flax trailing edges that trim logistic mass 8%. Construction decks and façades retain steady growth through LEED credit pull, while marine adoption remains niche pending moisture-barrier breakthroughs. Aerospace cabin interior penetration continues because natural fibers outperform aluminum on vibration damping and smoke toxicity. These shifts demonstrate that downstream regulations and cost savings jointly steer demand across the natural fiber reinforced composites market.

Geography Analysis
Asia-Pacific held 42.25% natural fiber reinforced composites market share in 2025, pacing at 9.10% CAGR through 2031 on the back of Chinese recyclability mandates and India’s home-upgrade wave. The region’s natural fiber reinforced composites market size will surpass 3.5 million tons by 2031. China’s MIIT rules elevate bast-fiber trims for battery enclosures, while Wuhu Haoxuan’s new 15,000 t extrusion line supplies decking for municipal walkways. Southeast Asian plants process coconut and banana fibers at sub-USD 300 t feeds, making extruded profiles cost-competitive with vinyl siding.
Europe ranks second in volume yet leads innovation. Germany’s suppliers operate supercritical-CO₂ treatment to raise flax stiffness 33%, enabling semi-structural seat frames. The U.K.’s BREEAM regime and France’s RE2020 code award carbon points for bio-based façades, pushing architects toward wood-fiber PVC cladding. Nordic mills divert forestry by-products into polypropylene Formi blends, tightening circular loops.
North America leverages reclaimed sawdust and post-consumer film. Trex harvests 95% waste inputs, improving gross margins to 38% in 2025. USMCA rules foster regionalized supply chains; Mexican tier-1s mold natural-fiber trunk liners for Detroit automakers. South America sits on abundant bagasse, banana, and sisal feedstocks, yet limited compounding capacity caps domestic conversion.
Middle East and Africa remain exploratory; UAE projects use date-palm fiber core panels in LEED Platinum towers, but broad supply logistics are nascent. These regional dynamics show that regulatory pressure and raw material availability shape the natural fiber reinforced composites market trajectory.


Competitive Landscape
The natural fiber reinforced composites market is moderately fragmented. Market leaders are driving growth through continuous product innovation and strategic expansions. Companies are allocating substantial investments toward research and development to engineer high-performance, eco-friendly composite solutions with low maintenance requirements. Vertical integration of recycling facilities with manufacturing operations demonstrates operational efficiency, enabling better control over raw material quality and supply chain optimization. Strategic alliances with raw material suppliers and recycling firms are ensuring sustainable sourcing of natural fibers and polymers. To capitalize on opportunities in regions with expanding construction and automotive sectors, key players are extending their geographical reach via distribution partnerships and the establishment of new manufacturing facilities. The industry is also prioritizing the development of products with superior durability, weather resistance, and aesthetic appeal to align with evolving consumer demands.
Natural Fiber Reinforced Composites Industry Leaders
Trex Company Inc.
The AZEK Company Inc.
Fiberon
UPM
TECNARO GmbH
- *Disclaimer: Major Players sorted in no particular order

Recent Industry Developments
- June 2025: Bcomp and BMW Group signed a multi-year deal to supply 150,000 flax-reinforced door panels and instrument carriers annually, slashing part-level CO₂ by 40% .
- January 2025: Bcomp inaugurated a CHF 12 million expansion at its Fribourg plant, adding a supercritical-CO₂ fiber line capable of 200 t year, targeting semi-structural car and aerospace parts.
- July 2024: FlexForm Technologies unveiled an USD 18 million investment for 12 large-tonnage compression presses in Michigan to supply long-fiber thermoplastic panels for 2026 automotive programs.


Global Natural Fiber Reinforced Composites Market Report Scope
Natural fiber-reinforced composites are composite materials in which at least one fiber is derived from renewable and carbon dioxide-neutral resources such as wood and plants. These composites offer greater physical strength, durability, biodegradability, and fuel efficiency. Such properties make it ideal for the aerospace, automotive, building, and construction industries.
The natural fiber-reinforced composites market is segmented by fiber, polymer, processing technology, end-user industry, and geography. By fiber, the market is segmented into wood fiber composites and non-wood fiber composites. By polymer, the market is segmented into thermosets, thermoplastics, and bio-based polymers. By processing technology, the market segmented into injection molding, compression molding, pultrusion, resin transfer molding / VARTM, and additive manufacturing (3-D printing with NFC pellets). By end-user industry, the market is segmented into automotive and transportation, aerospace (non-critical), marine, building and construction, electrical and electronics, sports and leisure goods, and renewable energy (wind turbine components). The report also covers market size and forecasts for the natural fiber reinforced composites market in 27 countries across major regions. For each segment, the market sizing and forecasts have been done based on volume (tons).
| Wood Fiber Composites | |
| Non-wood Fiber Composites | Cotton |
| Flax | |
| Kenaf | |
| Hemp | |
| Other Non-wood Fibers (Jute, Sisal, Abaca, Coir, PALF, Banana) |
| Thermosets | |
| Thermoplastics | Polyethylene |
| Polypropylene | |
| Polyvinyl Chloride | |
| High-performance Thermoplastics (PC, PA, PBT) | |
| Bio-based Polymers (PLA, PHAs, PBS) |
| Injection Molding |
| Compression Molding |
| Pultrusion |
| Resin Transfer Molding / VARTM |
| Additive Manufacturing (3-D printing with NFC pellets) |
| Automotive and Transportation |
| Aerospace (Non-critical) |
| Marine |
| Building and Construction |
| Electrical and Electronics |
| Sports and Leisure Goods |
| Renewable Energy (Wind-turbine components) |
| Asia-Pacific | China |
| India | |
| Japan | |
| South Korea | |
| Malaysia | |
| Thailand | |
| Indonesia | |
| Vietnam | |
| Rest of Asia-Pacific | |
| North America | United States |
| Canada | |
| Mexico | |
| Europe | Germany |
| United Kingdom | |
| France | |
| Italy | |
| Spain | |
| Nordic Countries | |
| Turkey | |
| Russia | |
| Rest of Europe | |
| South America | Brazil |
| Argentina | |
| Colombia | |
| Rest of South America | |
| Middle East and Africa | Saudi Arabia |
| Qatar | |
| United Arab Emirates | |
| Nigeria | |
| Egypt | |
| South Africa | |
| Rest of Middle East and Africa |
| By Fiber | Wood Fiber Composites | |
| Non-wood Fiber Composites | Cotton | |
| Flax | ||
| Kenaf | ||
| Hemp | ||
| Other Non-wood Fibers (Jute, Sisal, Abaca, Coir, PALF, Banana) | ||
| By Polymer Matrix | Thermosets | |
| Thermoplastics | Polyethylene | |
| Polypropylene | ||
| Polyvinyl Chloride | ||
| High-performance Thermoplastics (PC, PA, PBT) | ||
| Bio-based Polymers (PLA, PHAs, PBS) | ||
| By Processing Technology | Injection Molding | |
| Compression Molding | ||
| Pultrusion | ||
| Resin Transfer Molding / VARTM | ||
| Additive Manufacturing (3-D printing with NFC pellets) | ||
| By End-user Industry | Automotive and Transportation | |
| Aerospace (Non-critical) | ||
| Marine | ||
| Building and Construction | ||
| Electrical and Electronics | ||
| Sports and Leisure Goods | ||
| Renewable Energy (Wind-turbine components) | ||
| By Geography | Asia-Pacific | China |
| India | ||
| Japan | ||
| South Korea | ||
| Malaysia | ||
| Thailand | ||
| Indonesia | ||
| Vietnam | ||
| Rest of Asia-Pacific | ||
| North America | United States | |
| Canada | ||
| Mexico | ||
| Europe | Germany | |
| United Kingdom | ||
| France | ||
| Italy | ||
| Spain | ||
| Nordic Countries | ||
| Turkey | ||
| Russia | ||
| Rest of Europe | ||
| South America | Brazil | |
| Argentina | ||
| Colombia | ||
| Rest of South America | ||
| Middle East and Africa | Saudi Arabia | |
| Qatar | ||
| United Arab Emirates | ||
| Nigeria | ||
| Egypt | ||
| South Africa | ||
| Rest of Middle East and Africa | ||


Key Questions Answered in the Report
What is the projected volume for natural fiber reinforced composites in 2031?
The natural fiber reinforced composites market is forecast to reach 7.72 million tons by 2031.
Which end-user will grow fastest through 2031?
Renewable-energy components, particularly wind-turbine blades, are expected to grow at 9.91% CAGR, the highest among end users.
Why are thermoplastics preferred in natural fiber composites?
Thermoplastics such as polypropylene process below 180 °C, match bast-fiber thermal limits, and can be mechanically recycled, making them cost-effective for high-volume applications.
How does lightweighting benefit electric vehicles?
Replacing glass fiber with natural fibers reduces component mass by 15%–20%, adding roughly 0.3 km driving range per kilogram saved and lowering battery cost by USD 15–20.
What limits natural fiber use in high-temperature parts?
Cellulosic fibers degrade above 180 °C, preventing their integration with high-melt polymers like polyamide 6, which under-hood applications require.
Page last updated on:


