National Basketball Association (NBA) Market Size and Share
Market Overview
| Study Period | 2020 - 2031 |
|---|---|
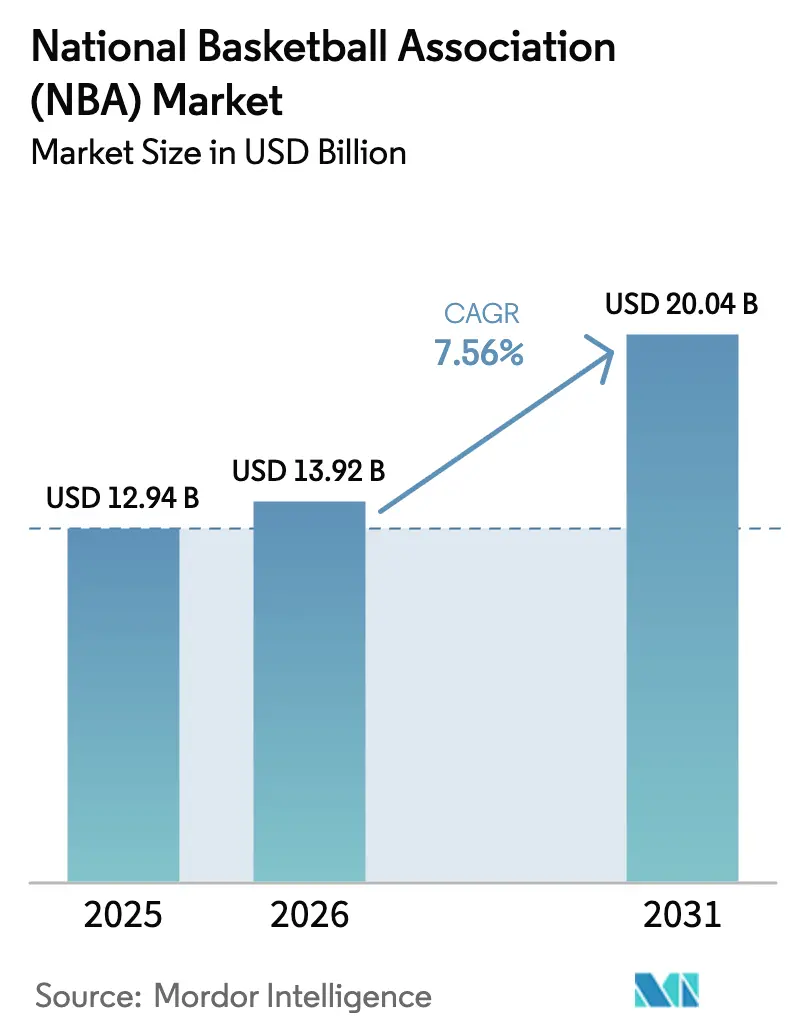
| Market Size (2026) | USD 13.92 Billion |
| Market Size (2031) | USD 20.04 Billion |
| Growth Rate (2026 - 2031) | 7.56% CAGR |
| Fastest Growing Market | Asia Pacific |
| Largest Market | North America |
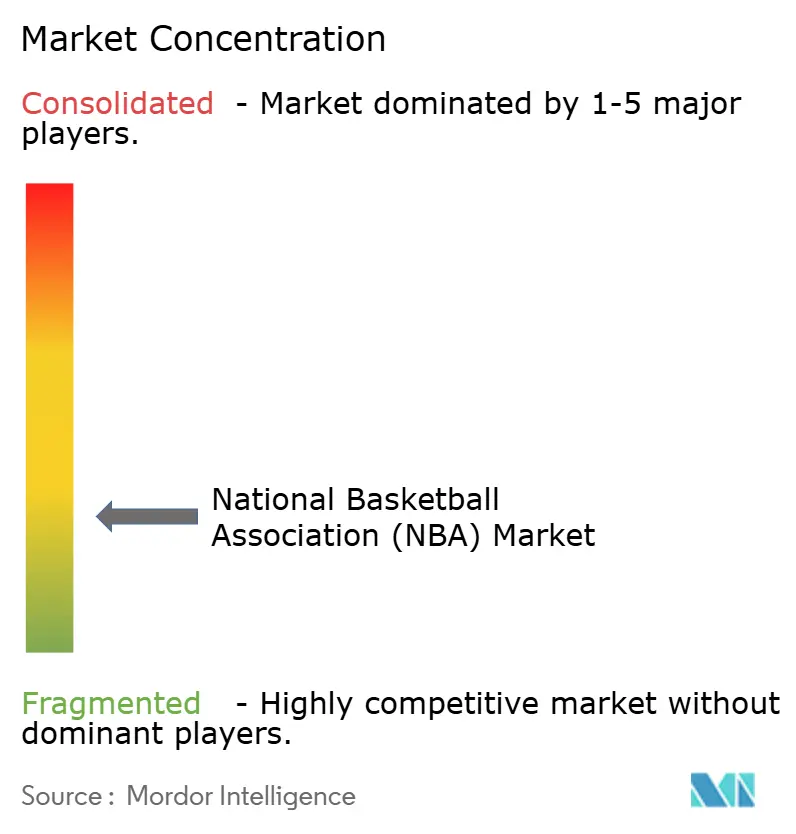
| Market Concentration | Low |
Major Players *Disclaimer: Major Players sorted in no particular order Image © Mordor Intelligence. Reuse requires attribution under CC BY 4.0. | |
National Basketball Association (NBA) Market Analysis by Mordor Intelligence
The National Basketball Association Market size is expected to increase from USD 12.94 billion in 2025 to USD 13.92 billion in 2026 and reach USD 20.04 billion by 2031, growing at a CAGR of 7.56% over 2026-2031.
Recent growth stems from a structural pivot toward direct-to-consumer streaming, a USD 77 billion domestic media-rights cycle that began in the 2025-26 season, and a fast-rising global fan base that embraces on-demand digital access. Broadcasting still delivers the single largest slice of revenue, yet digital subscriptions are expanding faster than every other stream, propelled by NBA League Pass upgrades and team-owned apps. International outreach, particularly in China, India, and Africa, is unlocking new sponsorships and merchandise sales while insulating the league from North America’s maturing demand. Simultaneously, franchises are hedging against cord-cutting by investing in mixed-use arenas that capture year-round hospitality
Key Report Takeaways
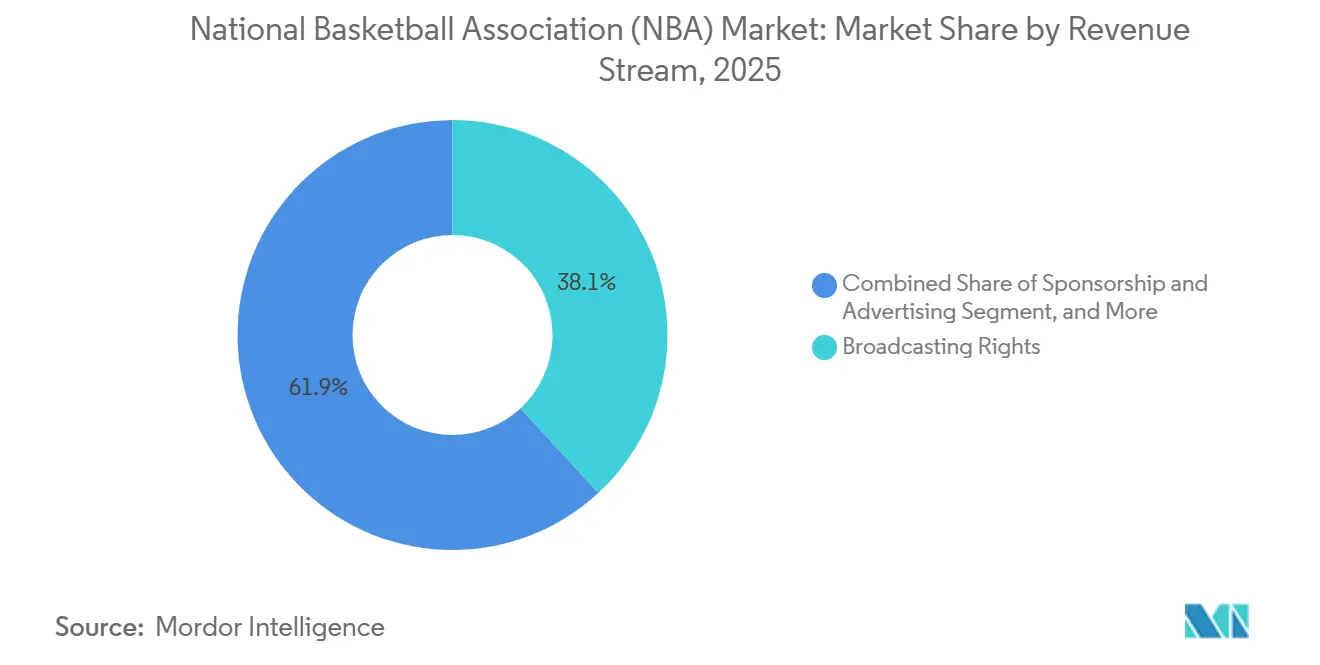
- By revenue stream, broadcasting rights captured 38.12% of the 2025 income of the National Basketball Association (NBA) market, while digital media subscriptions are forecast to advance at an 8.73% CAGR through 2031.
- By fan type, national fans represented 47.13% of the 2025 audience, yet global fans are poised for an 8.02% CAGR during 2026-31.
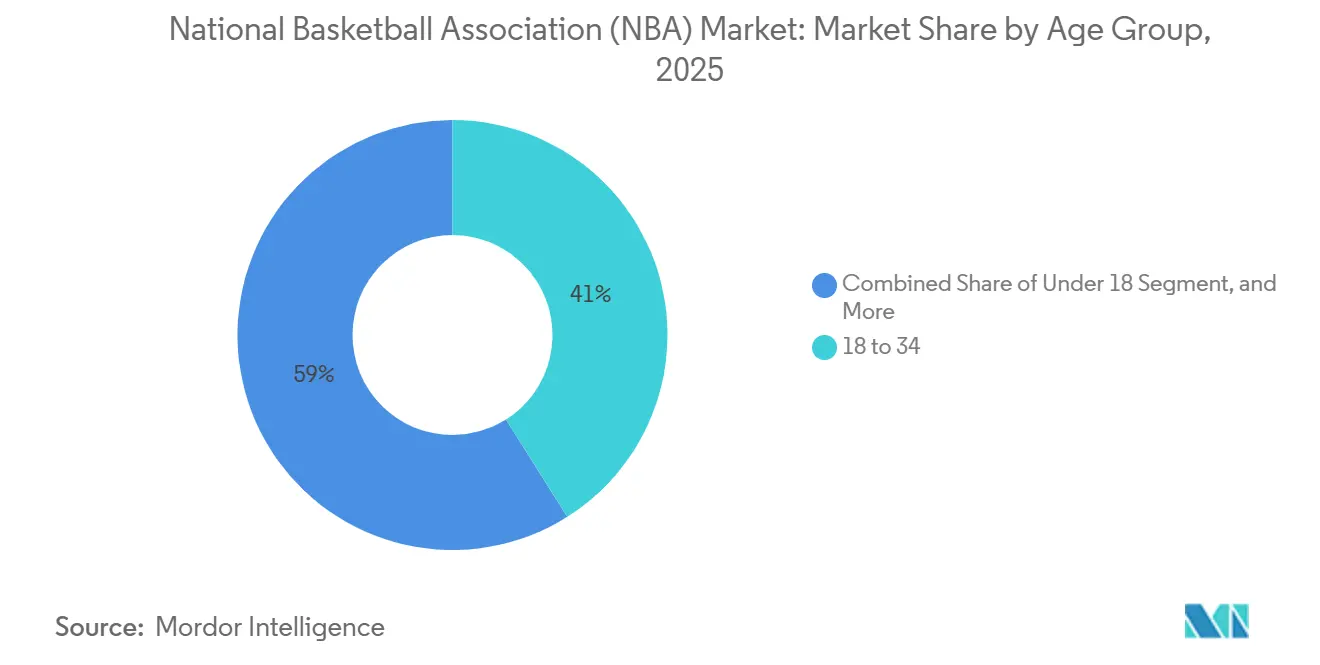
- By age group, adults aged 18 to 34 commanded 41.03% engagement in 2025 of the National Basketball Association (NBA) market, whereas the under-18 cohort is projected to post an 8.21% CAGR.
- By engagement platform, television held 52.19% share in 2025, but social media and apps are expected to expand at an 8.37% CAGR.
- By geography, North America delivered 74.78% of 2025 value of the National Basketball Association (NBA) market, although Asia-Pacific is on course for the fastest 8.63% annual rise.
Note: Market size and forecast figures in this report are generated using Mordor Intelligence’s proprietary estimation framework, updated with the latest available data and insights as of January 2026.
Global National Basketball Association (NBA) Market Trends and Insights
Drivers Impact Analysis*
| Driver | (~) % Impact on CAGR Forecast | Geographic Relevance | Impact Timeline |
|---|---|---|---|
| Youth Embrace Basketball, Fuelling Market Expansion | +1.2% | Global, concentrated in North America, China, India, and Africa | Medium term (2-4 years) |
| Global Interest Surge in Live Sports Media Rights | +2.1% | Global, led by North America with gains in Europe and Asia-Pacific | Short term (≤ 2 years) |
| Growth of Sports Betting Partnerships | +1.5% | North America, emerging in Europe and select Asia-Pacific markets | Short term (≤ 2 years) |
| Esports Integration and Cross-Platform Engagement | +0.9% | Global, strongest in North America and Asia-Pacific | Medium term (2-4 years) |
| Expansion of Direct-to-Consumer Streaming Platforms | +1.8% | Global, early adoption in North America and urban Asia-Pacific hubs | Medium term (2-4 years) |
| Rise of Women's Basketball Creating New Audiences | +0.9% | North America, with spillover to Europe and Asia-Pacific | Long term (≥ 4 years) |
| Source: Mordor Intelligence | |||
Global Interest Surge in Live Sports Media Rights
The current USD 77 billion domestic agreement with ESPN, NBC, and Amazon confirms that premium advertisers still chase live sports inventory despite shrinking linear audiences. Splitting inventory among broadcast, cable, and streaming broadens reach, secures upfront guarantees, and preserves flexibility to migrate more games online as cord-cutting accelerates. Parallel negotiations in India and China show the league’s ability to structure region-specific packages that avoid cannibalizing U.S. rights. Advertisers gain a data-rich environment through Amazon’s streaming interface, raising CPMs and sharpening targeting. The result is a bigger, longer visibility runway that underpins topline growth for the National Basketball Association market.
Expansion of Direct-to-Consumer Streaming Platforms
Reclaiming NBA TV and placing 60 exclusive games on League Pass signals intent to own the distribution stack. Subscriptions jumped 15% in 2024-25, led by international customers drawn to 12-language commentary and real-time stat overlays. Azure-powered features such as multi-angle viewing and AI-generated highlights differentiate the product from one-feed television broadcasts. Teams facing 30%-40% RSN fee declines, spurred by Diamond Sports Group’s bankruptcy, now pilot local streaming apps to recapture lapsed linear revenue. Together, these moves deepen recurring digital income, enhance fan data capture, and elevate margin potential across the National Basketball Association market.
Growth of Sports Betting Partnerships
Legal sports betting produced USD 13.7 billion in 2024 operator revenue, and the NBA monetizes the trend through data licensing and integrated broadcast odds[1]American Gaming Association, “U.S. Sports Betting Revenue Hits Record,” americangaming.orgBetMGM, DraftKings, and FanDuel supply live lines that keep viewers tuned longer and encourage dual-screen consumption. Clubs can ink territorial sportsbook deals, positioning franchises like Dallas to benefit when state laws change. Jersey-patch sponsorships from gaming brands add a fresh revenue layer, although regulators scrutinize youth exposure. Net impact is a stickier viewing experience that increases average revenue per fan for the National Basketball Association (NBA) market.
Youth Embrace Basketball, Fuelling Market Expansion
About 28.1 million Americans played basketball in 2024, ranking it the third-largest participation sport.[2]Sports and Fitness Industry Association, “2024 Basketball Participation Report,” sfia.org The Jr. NBA already touches 26 million kids across 75 nations, embedding hoops inside school curricula and community centers. A February 2025 YMCA alliance extended structured programming into 2,700 U.S. facilities, targeting underserved areas. China’s estimated 300 million recreational players dwarf U.S. numbers and help explain why the under-18 fan segment is set to grow at 9.21% annually. Early engagement turns into lifelong consumption, seeding future revenues for the National Basketball Association market.
Restraints Impact Analysis*
| Restraint | (~) % Impact on CAGR Forecast | Geographic Relevance | Impact Timeline |
|---|---|---|---|
| Intensifying Competition from Alternative Entertainment | -0.7% | Global, most acute in North America and Europe | Short term (≤ 2 years) |
| Rising Player Salary Cap Pressures on Profit Margins | -0.5% | North America, indirect effects on international expansion budgets | Medium term (2-4 years) |
| Broadcast Cord-Cutting Reducing Traditional TV Revenues | -0.6% | North America and Europe, delayed impact in Asia-Pacific | Short term (≤ 2 years) |
| Geopolitical Risks Affecting International Events | -0.4% | China, Middle East, and select Asia-Pacific markets | Long term (≥ 4 years) |
| Source: Mordor Intelligence | |||
Intensifying Competition from Alternative Entertainment
Netflix streamed two NFL games in December 2024 to 65 million viewers, illustrating how big tech and entertainment firms muscle into premium sports. Short-form platforms teach Gen Z to snack on 60-second clips, reducing appetite for two-hour games. Although the NBA posted 8.9 billion TikTok views in 2024, linear averages slipped to 1.6 million per ESPN telecast.[3]Sports Media Watch, “NBA National TV Ratings 2025 Season,” sportsmediawatch.com Social media impressions, while valuable, are currently being monetized at rates that are only a fraction of those seen in traditional advertising. This trend is leading to a decrease in revenue generated per viewer. If these changes aren't counterbalanced by more effective monetization strategies targeting fans, they could potentially dampen the National Basketball Association's (NBA) market growth in the near future.
Broadcast Cord-Cutting Reducing Traditional TV Revenues
Cord-cutting in North America continues to shrink cable households, eroding the RSN model that once guaranteed stable local cash flows. Thirteen clubs absorbed 30%-40% rights-fee hits after Diamond Sports Group’s 2024 bankruptcy, prompting Phoenix and Dallas to launch direct-to-consumer apps. League-wide fixes include in-house streaming and shared digital infrastructure, yet local blackouts still frustrate subscribers. Lower linear reach also pressures sponsor valuations tied to broadcast impressions. If the digital uptake doesn't completely bridge the existing gap, it could hinder the top-line growth of the National Basketball Association market, potentially tempering its projected CAGR.
*Our forecasts treat driver/restraint impacts as directional, not additive. The impact forecasts reflect baseline growth, mix effects, and variable interactions.
Segment Analysis
By Revenue Stream: Digital Subscriptions Gain Momentum
Broadcasting rights accounted for 38.12% of 2025 revenue of the National Basketball Association (NBA) market, underscoring that television still anchors the National Basketball Association market. The National Basketball Association's digital media market share is growing rapidly as League Pass adds multi-angle views, and team-specific apps replicate that template in local territories. Sponsorship income reached USD 1.62 billion in the 2024-25 season following a surge in jersey-patch deals that attracted 450 new brands. Merchandise gains reflect star power from 135 international players, while WNBA-driven apparel demand amplified post-Caitlin Clark. Ticket sales remain cyclical, yet premium courtside packages in New York and Los Angeles command record prices, cushioning the impact of soft volume.
Digital subscriptions are forecast to expand at 8.73% yearly through 2031, fastest among streams, as more exclusive games migrate online. Real-time data overlays and wagering integrations make digital viewing more interactive than cable. Sponsorship value grows alongside expanded fan touchpoints, and franchises are designing mixed-use arenas to tap non-game revenue. The Philadelphia 76ers’ USD 1.3 billion downtown facility, set to open in 2031, exemplifies this strategy. Collectively, these shifts reposition direct digital income as the long-term growth engine inside the National Basketball Association market.


By Fan Type: Global Cohort Drives Scale
National fans still accounted for 47.13% of the 2025 audience, but overseas viewers drove the most incremental growth in the National Basketball Association market. The league’s first Macao preseason games since 2019 signaled renewed China outreach, where 300 million people play basketball. Alibaba Cloud now localizes e-commerce and highlights to accelerate conversion. In India, YouTube and Amazon Prime distribute live games to 115 million unique viewers who rely on mobile devices. Local fan spending is maximized by new urban arenas such as San Antonio’s USD 811 million project that will anchor downtown redevelopment.
Global fans are projected to grow 8.02% annually, outperforming domestic segments. The Basketball Africa League’s franchise model offers a grassroots ladder to the NBA while nurturing local brand deals. International viewers often skip cable and go straight to streaming, raising digital ARPU. National Basketball Association market share in emerging regions should therefore rise as broadband access widens, balancing revenue risks from plateauing U.S. engagement.
By Age Group: Youth Pipeline Secures Future Demand
The 18-34 cohort captured 41.03% of 2025 engagement, maintaining its position as the commerce engine that buys jerseys, streams games, and influences social chatter. However, the under-18 segment is expected to expand at 8.21% yearly, the fastest of any band. Jr. NBA programs and YMCA partnerships seed early attachment that matures into adult spending. Early participation triples the likelihood of becoming a regular viewer, strengthening lifetime value across the National Basketball Association market.
Older groups still matter financially. Fans 35-54 purchase premium seats and luxury suites, while those over 55 provide steady weekend viewership. Betting integrations target 25-44-year-olds, who account for 65% of legal wagers at. Balancing content formats, long-form broadcasts for older audiences and snackable clips for teens, diversifies demand and protects the National Basketball Association market size from demographic shocks.
By Engagement Platform: Digital Growth Offsets Television Dominance
Television secured 52.19% of 2025 engagement of the National Basketball Association (NBA) market, thanks to guaranteed prime-time slots, and remained the largest platform in the National Basketball Association market. Yet social media and apps are projected to grow 8.37% a year, mirroring an 89% digital viewership spike in 2024-25. Azure-enabled app features, such as real-time player tracking, deliver personalization that traditional broadcasts lack. Streaming also benefits from India’s “NBA on Prime” debut and YouTube deals that reach smartphone-centric audiences.
In-arena experiences yield the highest per-capita spend despite limited physical capacity. Immersive venues from the Cosm partnership beam 360-degree game feeds onto theater-size LED screens, blending social atmosphere with remote convenience. Digital-twin arenas like the Detroit Pistons’ metaverse project create new monetization experiments. As teams reclaim local rights and integrate micro-transactions, the National Basketball Association market share held by digital engagement platforms is poised to widen.
Geography Analysis
North America supplied 74.78% of the 2025 value, underpinned by USD 1.62 billion in sponsorship and 30 franchises that generated USD 11.3 billion in combined 2023-24 revenue. The National Basketball Association market nevertheless faces local media turbulence as RSN fees crumble, nudging clubs to create subscription apps and invest in mixed-use arenas that hedge linear risk. Philadelphia’s and San Antonio’s downtown projects illustrate this pivot and should lift ancillary income streams once operational.
Asia-Pacific is forecast to expand at a 8.63% CAGR, the fastest of all regions. China’s market reopened with Macao preseason contests, and NBA China supports more than 5,000 retail touchpoints despite recent political headwinds. India’s 115 million unique viewers watch primarily on mobile, aligning perfectly with streaming-first strategies. The long-term Abu Dhabi partnership, valued at over USD 300 million, cements a Gulf presence and serves as a hub for broader Middle East youth programs, reinforcing the National Basketball Association's market position.
Europe, South America, and Africa add smaller but strategic contributions. The Basketball Africa League logged USD 15 million in 2024 revenue, functions as a talent funnel, and reported a USD 250 million GDP impact across host nations.[4]American Gaming Association, “U.S. Sports Betting Revenue Hits Record,” americangaming.org Annual NBA Global Games in Germany, France, and Spain build European brand equity, though Russia’s absence removes a former growth pocket. Brazil and Argentina host NBA Basketball Schools that stimulate grassroots interest and merchandise demand. Collectively, these geographies diversify earnings and mitigate single-region risk within the National Basketball Association market.
Competitive Landscape
The NBA operates a closed 30-team structure that moderates external competition yet intensifies internal rivalry for talent and sponsorship. High-revenue clubs like Golden State paid USD 176 million in luxury tax for 2023-24, pushing payroll past USD 400 million, a level smaller-market peers cannot match. Revenue sharing reallocates roughly USD 400 million annually, but valuations still range from USD 9.4 billion for the Warriors to USD 2.35 billion for New Orleans, fueling strategic gaps.
International expansion offers new white-space. The franchise-model Basketball Africa League, the nine-year Abu Dhabi partnership, and India’s digital deals indicate how the league monetizes untapped fans and sponsors. Technology is a parallel battleground: Detroit’s metaverse arena, Cosm’s 360-degree venues, and Azure-powered multi-angle streams exemplify differentiated fan experiences. Ownership changes such as the USD 3.5 billion sale of the Dallas Mavericks and the USD 1.5 billion acquisition of the Minnesota Timberwolves highlight ongoing investor appetite for participation in the National Basketball Association market.
Looking ahead, an expected expansion into Las Vegas and Seattle around 2026 would raise the franchise count to 32, diversify geographic coverage, and trigger a new round of media-rights negotiations. Salary-cap inflation favors owners with deeper pockets, although luxury tax penalties can temper overspending. Overall, competitive dynamics remain robust, supporting a resilient yet evolving National Basketball Association market.
National Basketball Association (NBA) Industry Leaders
Los Angeles Lakers
Golden State Warriors
New York Knicks
Boston Celtics
Chicago Bulls
- *Disclaimer: Major Players sorted in no particular order

Recent Industry Developments
- January 2026: The NBA and Comcast Spectacor finalized a USD 1.3 billion arena joint venture in Philadelphia, with construction set for 2028 and completion in 2031.
- March 2026: The Basketball Africa League began its sixth season under a franchise format that mirrors the NBA, maintaining momentum despite a USD 19 million 2024 operating loss.
- October 2025: The NBA staged preseason games in Macao, recording 10,000 attendees per game and marking its first Greater China action since 2019.
- October 2025: Alibaba Cloud and the NBA signed a multi-year pact for localized digital content, e-commerce, and cloud fan experiences in China.


Global National Basketball Association (NBA) Market Report Scope
The National Basketball Association (NBA) Market Report is Segmented by Revenue Stream (Broadcasting Rights, Sponsorship and Advertising, Merchandising, Ticket Sales, Digital Media Subscriptions), Fan Type (Local, National, Global), Age Group (Under 18, 18-34, 35-54, 55 and Above), Engagement Platform (Television, Digital Streaming, Social Media and Apps, In-arena Experiences), and Geography (North America, Europe, Asia-Pacific, South America, Middle East, Africa). Market Forecasts are Provided in Terms of Value (USD).
| Broadcasting Rights |
| Sponsorship and Advertising |
| Merchandising |
| Ticket Sales |
| Digital Media Subscriptions |
| Local Fans |
| National Fans |
| Global Fans |
| Under 18 |
| 18 to 34 |
| 35 to 54 |
| 55 and Above |
| Television |
| Digital Streaming |
| Social Media and Apps |
| In-arena Experiences |
| North America | United States |
| Canada | |
| Mexico | |
| Europe | Germany |
| United Kingdom | |
| France | |
| Russia | |
| Spain | |
| Rest of Europe | |
| Asia-Pacific | China |
| India | |
| Japan | |
| Rest of Asia-Pacific | |
| South America | Brazil |
| Argentina | |
| Rest of South America | |
| Middle East | United Arab Emirates |
| Saudi Arabia | |
| Rest of Middle East | |
| Africa | South Africa |
| Nigeria | |
| Rest of Africa |
| By Revenue Stream | Broadcasting Rights | |
| Sponsorship and Advertising | ||
| Merchandising | ||
| Ticket Sales | ||
| Digital Media Subscriptions | ||
| By Fan Type | Local Fans | |
| National Fans | ||
| Global Fans | ||
| By Age Group | Under 18 | |
| 18 to 34 | ||
| 35 to 54 | ||
| 55 and Above | ||
| By Engagement Platform | Television | |
| Digital Streaming | ||
| Social Media and Apps | ||
| In-arena Experiences | ||
| By Geography | North America | United States |
| Canada | ||
| Mexico | ||
| Europe | Germany | |
| United Kingdom | ||
| France | ||
| Russia | ||
| Spain | ||
| Rest of Europe | ||
| Asia-Pacific | China | |
| India | ||
| Japan | ||
| Rest of Asia-Pacific | ||
| South America | Brazil | |
| Argentina | ||
| Rest of South America | ||
| Middle East | United Arab Emirates | |
| Saudi Arabia | ||
| Rest of Middle East | ||
| Africa | South Africa | |
| Nigeria | ||
| Rest of Africa | ||


Key Questions Answered in the Report
How large is the National Basketball Association market in 2026?
The National Basketball Association market size stands at USD 13.92 billion in 2026.
What is the forecast value for the National Basketball Association market by 2031?
Market value is projected to reach USD 20.04 billion by 2031.
Which revenue stream will grow fastest through 2031?
Digital media subscriptions are expected to expand at an 8.73% CAGR, outpacing all other streams.
Which region shows the highest growth outlook?
Asia-Pacific is projected to advance at an 8.63% CAGR between 2026 and 2031.
What age group is set to expand quickest?
The under-18 cohort is forecast to grow at an 8.21% CAGR through 2031.
Which engagement platform is gaining share most rapidly?
Social media and apps are forecast to increase engagement at an 8.37% CAGR, faster than television or in-arena experiences.
Page last updated on:


