Myasthenia Gravis Therapeutics Market Size and Share
Market Overview
| Study Period | 2020 - 2031 |
|---|---|
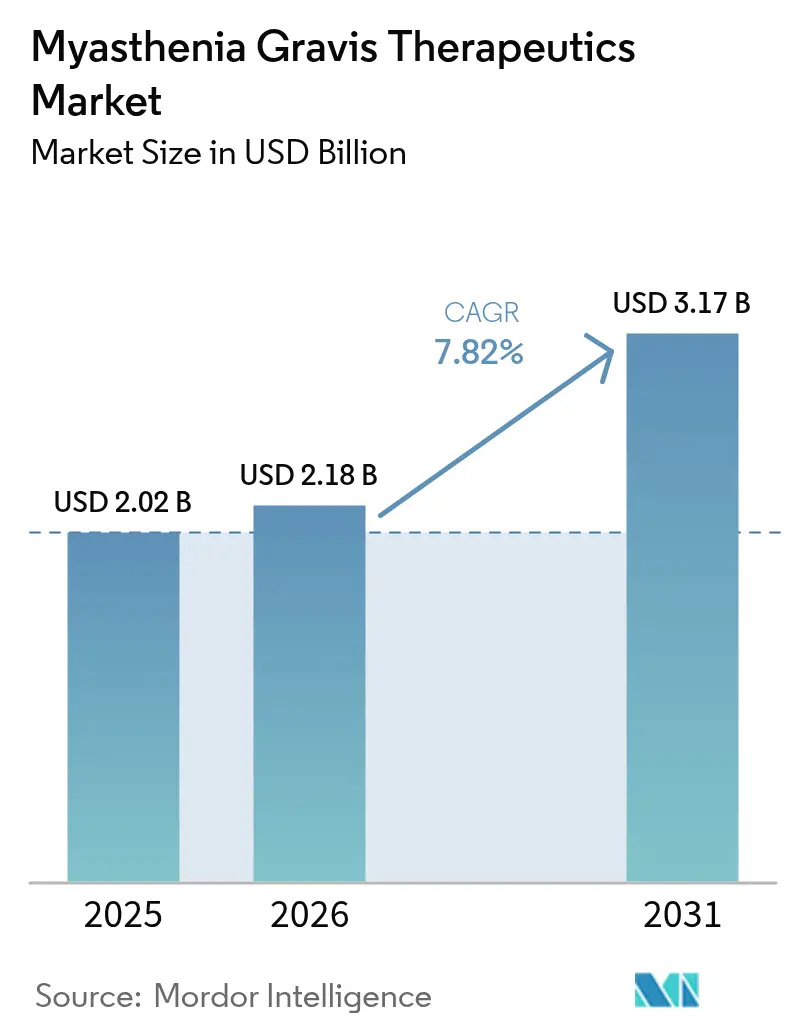
| Market Size (2026) | USD 2.18 Billion |
| Market Size (2031) | USD 3.17 Billion |
| Growth Rate (2026 - 2031) | 7.82% CAGR |
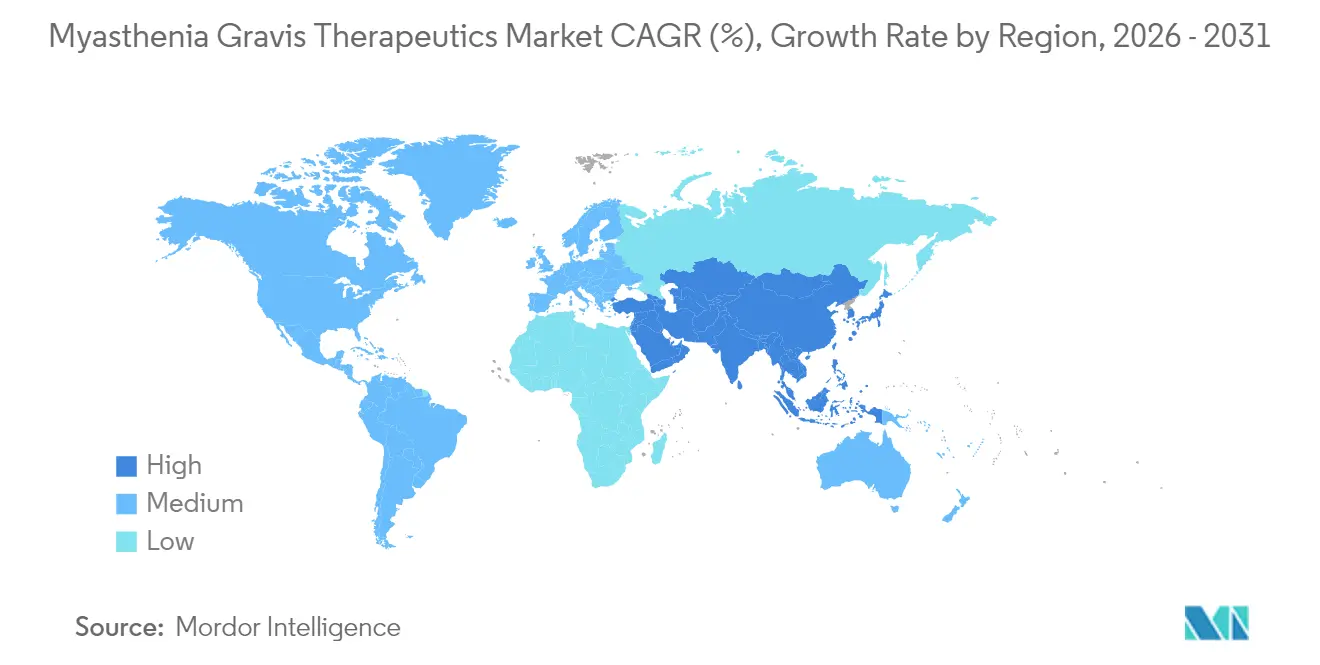
| Fastest Growing Market | Asia Pacific |
| Largest Market | North America |
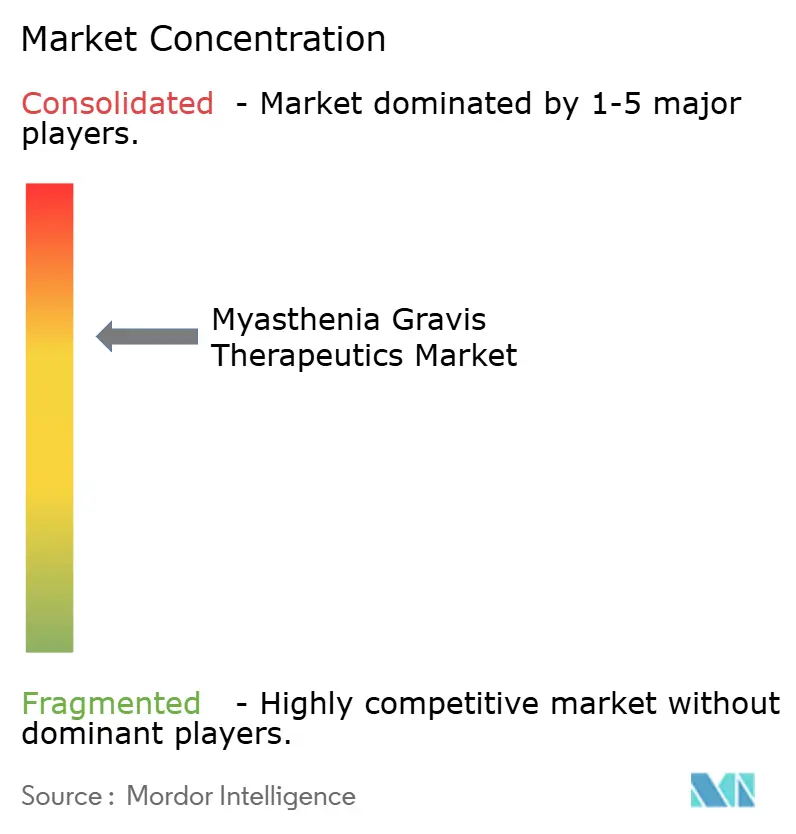
| Market Concentration | Medium |
Major Players *Disclaimer: Major Players sorted in no particular order Image © Mordor Intelligence. Reuse requires attribution under CC BY 4.0. | |
Myasthenia Gravis Therapeutics Market Analysis by Mordor Intelligence
Myasthenia gravis therapeutics market size in 2026 is estimated at USD 2.18 billion, growing from 2025 value of USD 2.02 billion with 2031 projections showing USD 3.17 billion, growing at 7.82% CAGR over 2026-2031. Rising biologic adoption, especially FcRn antagonists and complement inhibitors, is redefining care pathways and prompting payers to reassess reimbursement frameworks. Pipeline maturation, orphan-drug incentives and venture-backed collaborations have shortened development cycles, while subcutaneous (SC) formulations are accelerating treatment decentralization. Strong prevalence growth, earlier diagnosis through AI-enabled tools and premium pricing latitude further strengthen revenue prospects. Competitive intensity is expected to increase as Johnson & Johnson, argenx and UCB scale new launches and as biosimilar programs prepare post-2030 entries.
Key Report Takeaways
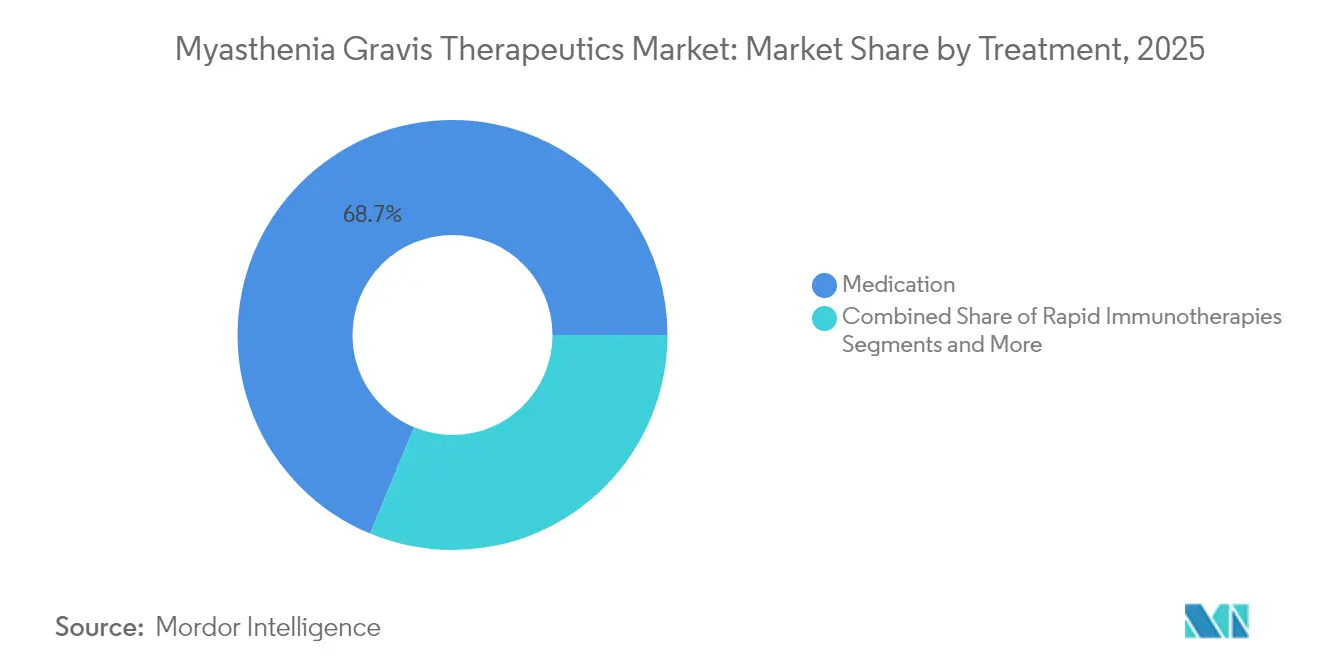
- By treatment, medication therapies led with 68.74% revenue share in 2025; gene and cell therapies are expanding at a 9.41% CAGR through 2031.
- By route of administration, intravenous delivery held 62.90% of the myasthenia gravis therapeutics market share in 2025, while the SC segment is advancing at a 9.85% CAGR through 2031.
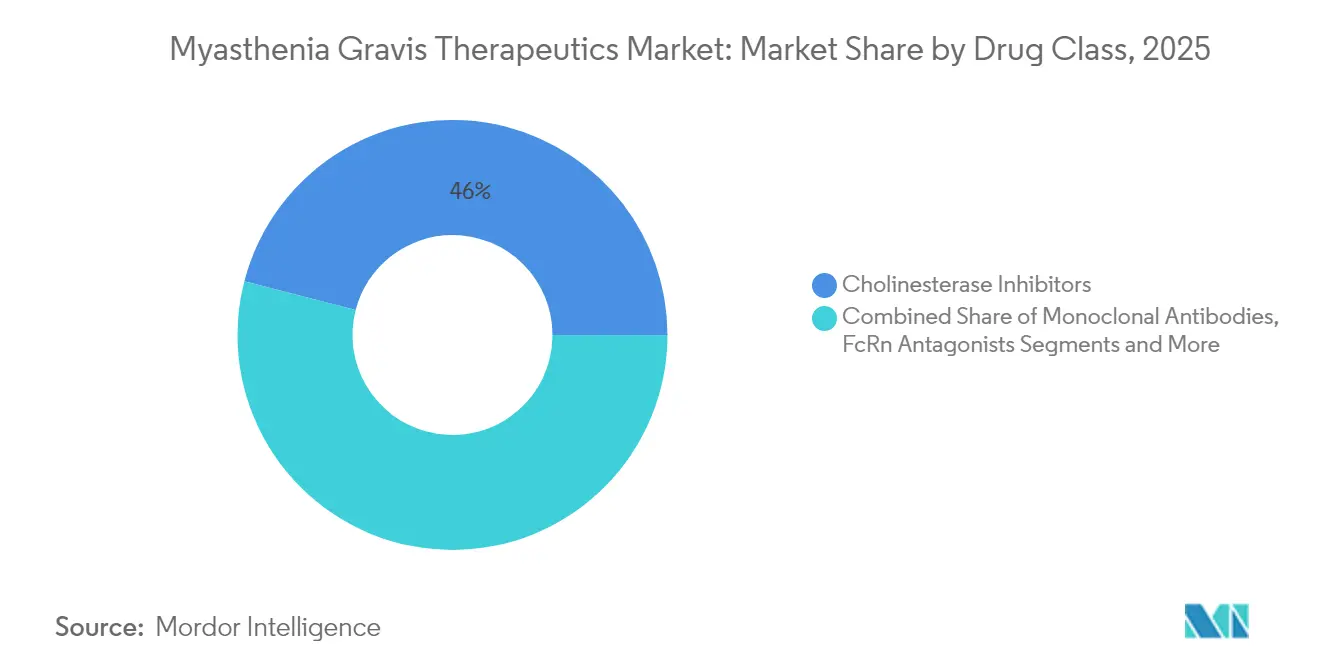
- By drug class, cholinesterase inhibitors accounted for a 45.98% share of the myasthenia gravis therapeutics market size in 2025; monoclonal antibodies are growing at 11.06% CAGR to 2031.
- By end-user, hospitals held 58.88% share in 2025, whereas home-care settings are rising at 10.54% CAGR as SC biologics enable self-administration.
- By geography, North America commanded 44.01% revenue in 2025; Asia-Pacific is the fastest-growing region at 9.46% CAGR through 2031.
Note: Market size and forecast figures in this report are generated using Mordor Intelligence’s proprietary estimation framework, updated with the latest available data and insights as of 2026.
Global Myasthenia Gravis Therapeutics Market Trends and Insights
Drivers Impact Analysis*
| Driver | (~) % Impact on CAGR Forecast | Geographic Relevance | Impact Timeline |
|---|---|---|---|
| Rising Incidence & Earlier Diagnosis Of MG | +1.2% | Global, with concentrated gains in North America & EU | Medium term (2-4 years) |
| Accelerating Approvals Of Complement- & FcRn-Targeted Biologics | +2.1% | Global, led by US & EU regulatory pathways | Short term (≤ 2 years) |
| Rare-Disease Incentives & Premium Pricing Leverage | +1.8% | North America & EU core markets | Long term (≥ 4 years) |
| Robust Clinical-Trial Pipeline Driven By Venture/Big-Pharma Deals | +1.5% | Global, with R&D concentrated in North America | Medium term (2-4 years) |
| Self-Administered SC Biologics Improving Adherence | +0.9% | Global, with early adoption in developed markets | Short term (≤ 2 years) |
| AI-Based Electromyography Analytics Enabling Earlier Intervention | +0.6% | North America & EU, expanding to APAC | Long term (≥ 4 years) |
| Source: Mordor Intelligence | |||
Rising incidence & earlier diagnosis
Incidence rose to 68.5 new U.S. cases per million in 2024, reflecting growing awareness and improved insurance coverage for neuromuscular testing. In tertiary clinics, AI-assisted ocular-motor analytics can identify fatigue signatures in under 60 seconds and have been associated with reducing average diagnostic lag from 2.3 years to under 12 months.[1]Yun Ye, “Epidemiology of myasthenia gravis in the United States,” Frontiers in Neurology, frontiersin.org Early confirmation allows clinicians to initiate immune-modifying therapy sooner, and centers that achieve a sub-one-year diagnosis report 40% higher minimal manifestation rates at two-year follow-up. Broader tele-neurology access, coupled with payer incentives for prompt work-ups, continues to enlarge the myasthenia gravis therapeutics market patient pool.
Accelerated approvals of FcRn/complement biologics
Between 2023 and 2025, four breakthrough drugs—rozanolixizumab, zilucoplan, nipocalimab and SC efgartigimod—completed regulatory review in just 6-8 months under priority pathways. Condensed timelines shorten cash-burn periods, encouraging venture investors and fostering big-pharma deal activity. Parallel approvals in the EU, Japan and Australia allow near-simultaneous launches, accelerating global revenue capture during exclusivity windows. These dynamics add scale and depth to the myasthenia gravis therapeutics market and validate precision immunology as a core growth theme.
Rare-disease incentives & premium pricing
Orphan-drug status grants seven-year exclusivity, a 25% R&D tax credit and waived FDA user fees, removing sizable regulatory costs. List prices exceed USD 800,000 per patient-year, yet outcomes-based contracts mitigate payer pushback while preserving strong net revenue flows. Manufacturers channel high margins into next-generation programs such as CAART and bispecific antibodies, reinforcing a virtuous investment cycle that keeps the myasthenia gravis therapeutics industry attractive for both incumbents and entrants.
SC biologics improving adherence
EMA clearance for self-injected rozanolixizumab and FDA approval of Vyvgart Hytrulo prefilled syringes shift treatment from infusion suites to the home, raising adherence from 65% to 89% within six months of rollout. Home dosing eliminates travel burdens, an advantage cited by 83% of survey respondents. Improved persistence yields steadier IgG suppression, fewer exacerbations and lower crisis-related hospitalizations, strengthening the clinical and economic rationale for biologic use in the myasthenia gravis therapeutics market.
Restraints Impact Analysis*
| Restraint | (~) % Impact on CAGR Forecast | Geographic Relevance | Impact Timeline |
|---|---|---|---|
| High Cost Of Long-Term Biologic Therapy | -1.8% | Global, most acute in emerging markets | Long term (≥ 4 years) |
| Low Disease Awareness In Emerging Economies | -1.1% | APAC, Latin America, MEA | Medium term (2-4 years) |
| Cold-Chain & Assay QA Complexity For mAbs | -0.7% | Global, infrastructure-dependent regions | Short term (≤ 2 years) |
| Price-Erosion Risk Post-Soliris LOE & Biosimilar Entry | -0.9% | North America & EU primarily | Long term (≥ 4 years) |
| Source: Mordor Intelligence | |||
High biologic therapy cost
Annual FcRn inhibitor expenditure approximates USD 833,000, while cost-utility studies suggest prices must fall by up to 88% to meet willingness-to-pay thresholds in the United States and Europe.[2] Young-Ah Heo, “Efgartigimod: A Review in Generalized Myasthenia Gravis,” Journal of Managed Care & Specialty Pharmacy, jmcp.org Budget caps trigger prior-authorization delays of four to six weeks, and emerging-market patients often default to steroids or plasmapheresis because of high co-payments. Wide affordability gaps therefore temper demand growth for the myasthenia gravis therapeutics market despite clinical superiority of novel agents.
Low disease awareness in emerging economies
Primary-care recognition of myasthenia gravis averages below 30% in many APAC and Latin American settings, with misdiagnosis at initial presentation exceeding 60%.[3]Yasar Zorlu, “Decoding myasthenia gravis with infrared spectroscopy,” Scientific Reports, nature.com Patients may rotate through ophthalmology and ENT services for up to a year before being referred to neurology, potentially delaying access to disease-modifying therapy. These factors restrict market penetration, keeping prescription volumes low even when products receive regulatory approval.
*Our forecasts treat driver/restraint impacts as directional, not additive. The impact forecasts reflect baseline growth, mix effects, and variable interactions.
Segment Analysis
By Treatment: Gene Therapies Accelerate Precision Care
Gene and cell therapies are the fastest-growing treatment category at a 9.41% CAGR, though medication regimens still captured 68.74% of 2025 revenue. Early CAR-T case studies show Quantitative MG scores dropping from 21 to 5, sustaining muscle strength gains without ongoing immunosuppression. Telitacicept’s 98.1% MG-ADL response in late-stage trials and CAART technology that selectively depletes pathogenic B cells reinforce growing confidence in curative approaches. Venture capital and disease-foundation grants provide critical funding, while regulators familiar with AAV vectors streamline IND reviews. As one-time interventions mature, the myasthenia gravis therapeutics market may shift toward front-loaded revenue, with chronic medication budgets gradually pivoting to post-treatment monitoring.
The existing medication segment remains sizeable because steroids, cholinesterase inhibitors and IVIg continue to manage mild or rapidly progressive episodes. Nonetheless, FcRn antagonists and complement inhibitors now enable steroid tapering in nearly half of patients, eroding dependence on broad immunosuppressants. Combination protocols blending biologics with targeted gene-editing may create hybrid models of care that preserve maintenance margins while unlocking durable remission for high-risk groups. Such innovation sustains revenue diversity in the myasthenia gravis therapeutics market and cushions drug makers against binary regulatory outcomes.


By Route of Administration: SC Delivery Redefines Convenience
Subcutaneous administration is growing 9.85% annually and is poised to chip away at intravenous dominance, which accounted for 62.90% of revenue in 2025. EMA endorsement of self-injected rozanolixizumab and FDA clearance for Vyvgart Hytrulo prefilled syringes confirm the safety and efficacy of patient-controlled delivery. SC dosing can be completed in five minutes at home, compared with several-hour infusion visits, lifting adherence to 89% and driving switch-over among patients eager to reduce clinic time. Such convenience broadens the myasthenia gravis therapeutics market size by engaging rural residents and mobility-limited patients who previously skipped biologic therapy.
Technology partnerships, like argenx’s USD 30 million expansion with Halozyme, target higher drug concentrations and smaller injection volumes, enhancing comfort and logistics. The shift frees infusion chairs for other specialties, a benefit valued by hospital administrators, and lowers payer facility costs. Oral formulations remain confined to legacy cholinesterase inhibitors and steroids, yet future extended-release or nanoparticle biologics could move additional therapies into home care. Broader SC penetration will therefore continue reshaping revenue allocation within the myasthenia gravis therapeutics market.
By Drug Class: Monoclonal Antibodies Outpace Legacy Drugs
Monoclonal antibodies posted the highest growth trajectory at an 11.06% CAGR through 2031, although cholinesterase inhibitors still generated 45.98% of 2025 revenue. FcRn antagonists such as efgartigimod, rozanolixizumab and nipocalimab deliver rapid IgG reduction, improving MG-ADL and QMG scores within weeks. Complement inhibitors remain critical for patients with complement-mediated pathology, offering remission prospects when autoantibody titers stay elevated despite FcRn therapy. Rituximab retains a niche in MuSK-positive disease, with 97% of recipients achieving improved clinical status yet limited by off-label reimbursement hurdles.
Pipeline diversification includes C2 inhibitors and MuSK agonists, suggesting fresh launch waves that keep prescribing decisions fluid and competitive. Network meta-analysis highlights batoclimab’s superior QMG response and rozanolixizumab’s leading MG-ADL gains, implying eventual algorithm-based drug selection. Such data-driven personalization supports sustained biologic share expansion inside the myasthenia gravis therapeutics market while giving payers levers to negotiate value-based contracts.
By End-User: Home-Care Settings Capture Fastest Growth
Home-care settings are expanding at a 10.54% CAGR, challenging hospitals that held a 58.88% share in 2025. The COVID-19 experience normalized self-injection and tele-monitoring, reducing patient anxiety about administering high-value biologics at home. AI-enabled platforms now automate neuromuscular examinations, allowing clinicians to adjust dosing based on remote performance scores. Over the forecast horizon, the myasthenia gravis therapeutics market is expected to experience a steady shift in maintenance dosing from specialty clinics to patients' homes.
Hospitals still dominate initiation because neurologists perform baseline assessments, infusion titrations, and crisis management. Ambulatory surgery centers continue to play a role in thymectomy and electrophysiology, yet billing volumes are declining as biologics reduce procedural demand. Payers endorse decentralisation when adherence metrics prove stable, and some insurers offer premium discounts to patients who transition to home administration. This shift reallocates revenue streams but enlarges the overall myasthenia gravis therapeutics market by removing logistical barriers to chronic care.
Geography Analysis
North America generated 44.01% of 2025 revenue, underpinned by broad insurance coverage and rapid biologic uptake following FDA breakthrough designations. Incidence now sits at 68.5 per million, equating to roughly 82,700 U.S. adults needing ongoing therapy. AI-enabled ocular-motor testing and tele-neurology reduce specialist bottlenecks, promoting early starts that heighten cumulative drug exposure. Competitive intensity rose in 2025 when Johnson & Johnson launched nipocalimab, adding price tension that may widen patient access by tempering annual cost escalators.
Europe follows with a cohesive regulatory environment that approved rozanolixizumab in January 2024 and SC self-administration in February 2025. Health-technology assessments secure 20-30% list-price discounts, yet still recognise orphan-drug value where real-world data show faster steroid tapering and fewer crises. Preference studies confirm 83% of European patients favor SC dosing, letting payers reallocate infusion budgets to drug acquisition. Conditional approvals require post-market surveillance, ensuring safety transparency while allowing income flow during data collection. Rising biosimilar programs for complement inhibitors could generate additional savings, potentially funding broader FcRn adoption across national formularies.
Asia-Pacific is the fastest-growing region at a 9.46% CAGR, buoyed by PMDA and NMPA reviews that now lag U.S. clearances by less than six months. Japan approved efgartigimod as VYVDURA for generalized myasthenia gravis and immune thrombocytopenia, while China authorised both IV and SC forms for gMG and CIDP. Despite these gains, out-of-pocket costs still average 40% of annual household income in China, which caps utilisation for high-priced biologics. Telemedicine and AI-based infrared spectroscopy are beginning to close specialist gaps. Continued healthcare-infrastructure investment and local manufacturing initiatives, including planned FcRn biosimilars, should lift the regional contribution to the myasthenia gravis therapeutics market over the next decade.

Competitive Landscape
The myasthenia gravis therapeutics market shows moderate consolidation. Argenx remains the revenue leader, posting USD 573 million in Q3 2024 Vyvgart sales and targeting 50,000 global patients by 2030. Johnson & Johnson’s May 2025 nipocalimab approval provides strong head-to-head data showing four-fold higher sustained improvement versus placebo, supplying immediate scale via its global immunology franchise. UCB’s rozanolixizumab differentiates with self-injection and a dual AChR/MuSK indication, appealing to patients seeking home dosing.
AstraZeneca’s complement inhibitor line is vulnerable to FcRn encroachment yet maintains loyalty among complement-positive subgroups. Immunovant’s batoclimab, now in Phase 3, posted a 5.6-point MG-ADL benefit that may elevate competition on depth of IgG reduction. Technology alliances keep reshaping the field; argenx’s Enhanze partnership with Halozyme targets four new SC candidates that could extend its brand moat. Gene-therapy entrants, including CAART developers, are likely acquisition targets for big pharma seeking durable remission assets, further strengthening the future pipeline for the myasthenia gravis therapeutics market.
The pricing picture is fluid. Cost-effectiveness studies urge large discounts, yet outcomes-based contracts and bundled chronic-care models grant manufacturers latitude if they can document crisis reduction and steroid sparing. As more agents enter, national systems may leverage competitive tenders to drive net prices down, but high immunology margins and scarce manufacturing capacity still favour originators over biosimilars before 2030.
Myasthenia Gravis Therapeutics Industry Leaders
argenx SE
UCB Pharma
Johnson & Johnson
Novartis AG
AstraZeneca
- *Disclaimer: Major Players sorted in no particular order

Recent Industry Developments
- April 2025: Johnson & Johnson gained FDA approval for nipocalimab (Imaavy) in generalized myasthenia gravis, showing four-fold greater sustained symptom control than placebo.
- April 2025: Argenx received FDA clearance for Vyvgart Hytrulo prefilled syringes, which enable patient self-administration at home.
- April 2025: RemeGen announced 98.1% MG-ADL response for telitacicept in Phase 3, with Chinese approval expected Q2 2025.
- March 2025: Immunovant reported Phase 3 batoclimab data, achieving a 5.6-point MG-ADL improvement at 680 mg weekly.


Global Myasthenia Gravis Therapeutics Market Report Scope
Myasthenia gravis is a neuromuscular autoimmune disorder that causes weakness in the skeletal muscles, which are the muscles your body uses for movement. It occurs when communication between nerve cells and muscles becomes impaired. This impairment prevents crucial muscle contractions from occurring, resulting in muscle weakness. Although there is no cure for the disorder, medications may be used to prevent the exacerbation of symptoms.
| Medication | |
| Rapid Immunotherapies | Intravenous Immunoglobulin (IVIg) |
| Plasmapheresis | |
| Gene & Cell Therapies | |
| Other Emerging Therapies |
| Oral |
| Intravenous |
| Sub-cutaneous |
| Cholinesterase Inhibitors |
| Corticosteroids & Other Immunosuppressants |
| Monoclonal Antibodies |
| Complement Inhibitors |
| FcRn Antagonists |
| Others |
| Hospitals |
| Specialty Neurology Clinics |
| Home-care Settings |
| Ambulatory Surgical Centers |
| North America | United States |
| Canada | |
| Mexico | |
| Europe | Germany |
| United Kingdom | |
| France | |
| Italy | |
| Spain | |
| Rest of Europe | |
| Asia-Pacific | China |
| Japan | |
| India | |
| Australia | |
| South Korea | |
| Rest of Asia-Pacific | |
| Middle East and Africa | GCC |
| South Africa | |
| Rest of Middle East and Africa | |
| South America | Brazil |
| Argentina | |
| Rest of South America |
| By Treatment | Medication | |
| Rapid Immunotherapies | Intravenous Immunoglobulin (IVIg) | |
| Plasmapheresis | ||
| Gene & Cell Therapies | ||
| Other Emerging Therapies | ||
| By Route of Administration | Oral | |
| Intravenous | ||
| Sub-cutaneous | ||
| By Drug Class | Cholinesterase Inhibitors | |
| Corticosteroids & Other Immunosuppressants | ||
| Monoclonal Antibodies | ||
| Complement Inhibitors | ||
| FcRn Antagonists | ||
| Others | ||
| By End-User | Hospitals | |
| Specialty Neurology Clinics | ||
| Home-care Settings | ||
| Ambulatory Surgical Centers | ||
| By Geography | North America | United States |
| Canada | ||
| Mexico | ||
| Europe | Germany | |
| United Kingdom | ||
| France | ||
| Italy | ||
| Spain | ||
| Rest of Europe | ||
| Asia-Pacific | China | |
| Japan | ||
| India | ||
| Australia | ||
| South Korea | ||
| Rest of Asia-Pacific | ||
| Middle East and Africa | GCC | |
| South Africa | ||
| Rest of Middle East and Africa | ||
| South America | Brazil | |
| Argentina | ||
| Rest of South America | ||


Key Questions Answered in the Report
What is the current value of the myasthenia gravis therapeutics market?
The market stands at USD 2.18 billion in 2026 and is set to reach USD 3.17 billion by 2031 at a 7.82% CAGR.
Which treatment category is growing fastest?
Gene and cell therapies lead, expanding at a 9.41% CAGR through 2031 as CAR-T and telitacicept show high response rates.
Why are SC biologics gaining popularity?
EMA and FDA approvals for self-injected formulations lift adherence to 89% and eliminate infusion-suite visits, improving patient convenience and payers’ cost profiles.
Which region offers the highest growth potential?
Asia-Pacific shows a 9.46% CAGR thanks to faster PMDA and NMPA reviews, although affordability remains a challenge.
What are the main barriers to biologic uptake?
Annual costs near USD 833,000 and low disease awareness in emerging economies slow adoption despite strong clinical efficacy.
Page last updated on:


