Multiple Myeloma Market Size and Share
Market Overview
| Study Period | 2020 - 2031 |
|---|---|
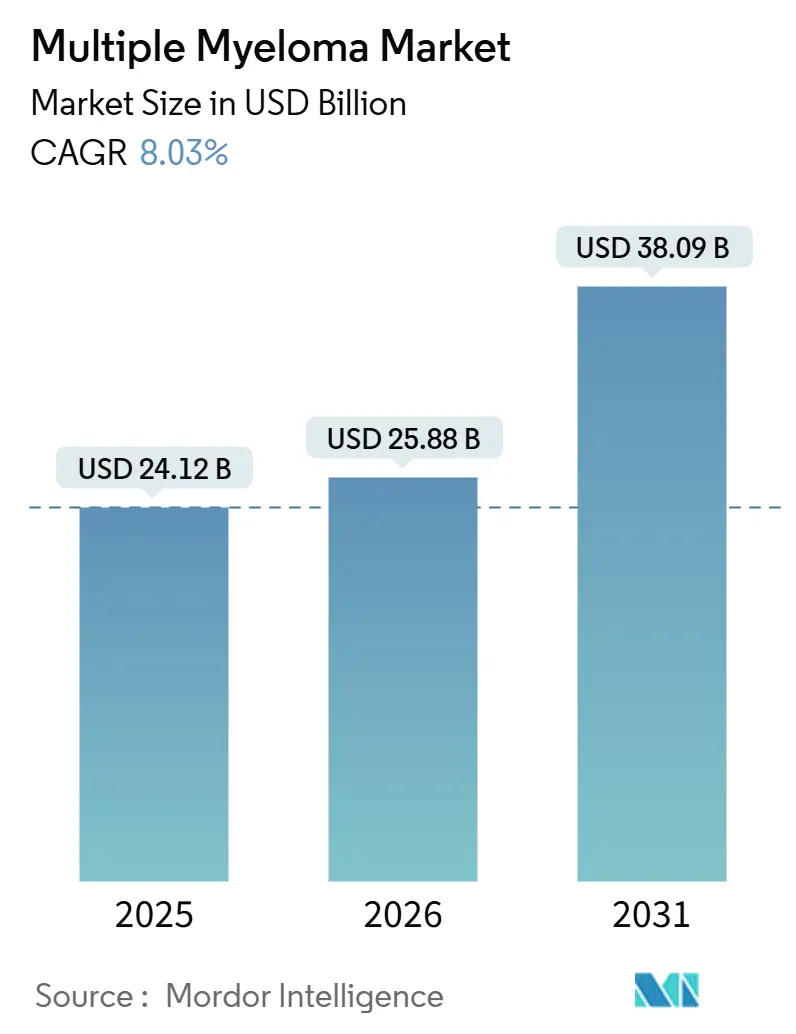
| Market Size (2026) | USD 25.88 Billion |
| Market Size (2031) | USD 38.09 Billion |
| Growth Rate (2026 - 2031) | 8.03% CAGR |
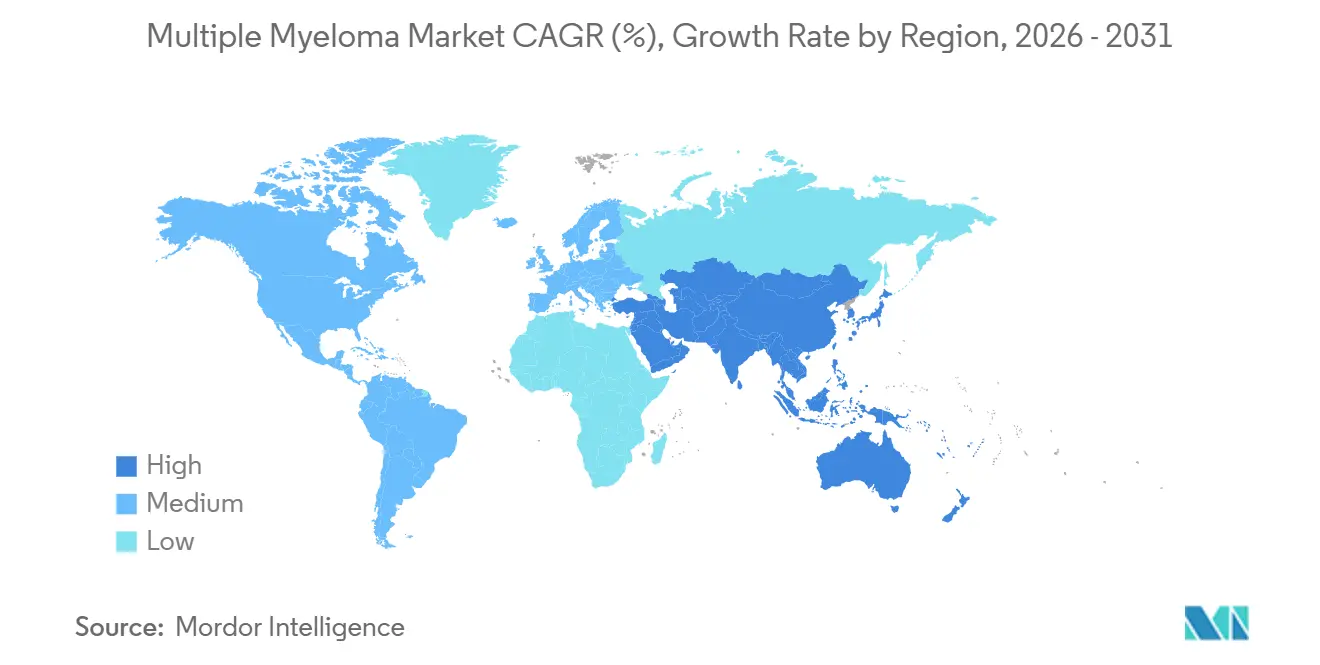
| Fastest Growing Market | Asia-Pacific |
| Largest Market | North America |
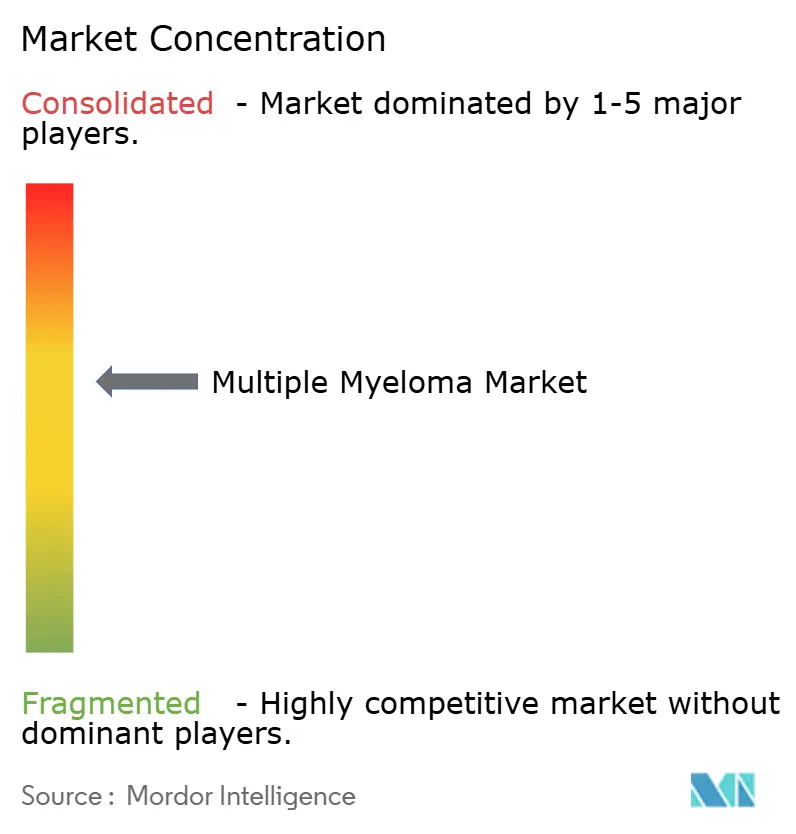
| Market Concentration | Medium |
Major Players *Disclaimer: Major Players sorted in no particular order Image © Mordor Intelligence. Reuse requires attribution under CC BY 4.0. | |
Multiple Myeloma Market Analysis by Mordor Intelligence
The Multiple Myeloma Market size is expected to grow from USD 24.12 billion in 2025 to USD 25.88 billion in 2026 and is forecast to reach USD 38.09 billion by 2031 at 8.03% CAGR over 2026-2031.
Surging demand for anti-BCMA modalities, swift uptake of bispecific antibodies, and rapid reimbursement decisions in the United States and Europe are displacing legacy proteasome-inhibitor monotherapy and steering revenue toward earlier-line cellular interventions. Multiple myeloma market participants are accelerating manufacturing expansion to ease the 25,000-slot global apheresis ceiling, even as academic centers ration capacity to clinical-trial enrollees who generate publication credit. Payer enthusiasm for outcomes-based contracts tied to minimal residual disease (MRD) negativity sustains premium pricing, while subcutaneous formulations that cut chair time from 3 hours to 5 minutes unlock throughput gains for community oncology clinics. Growth in Asia-Pacific outpaces other regions as China approves domestically produced CAR-T constructs at one-third Western price and Japan funds subcutaneous daratumumab, narrowing the treatment-access gap with North America.
Key Report Takeaways
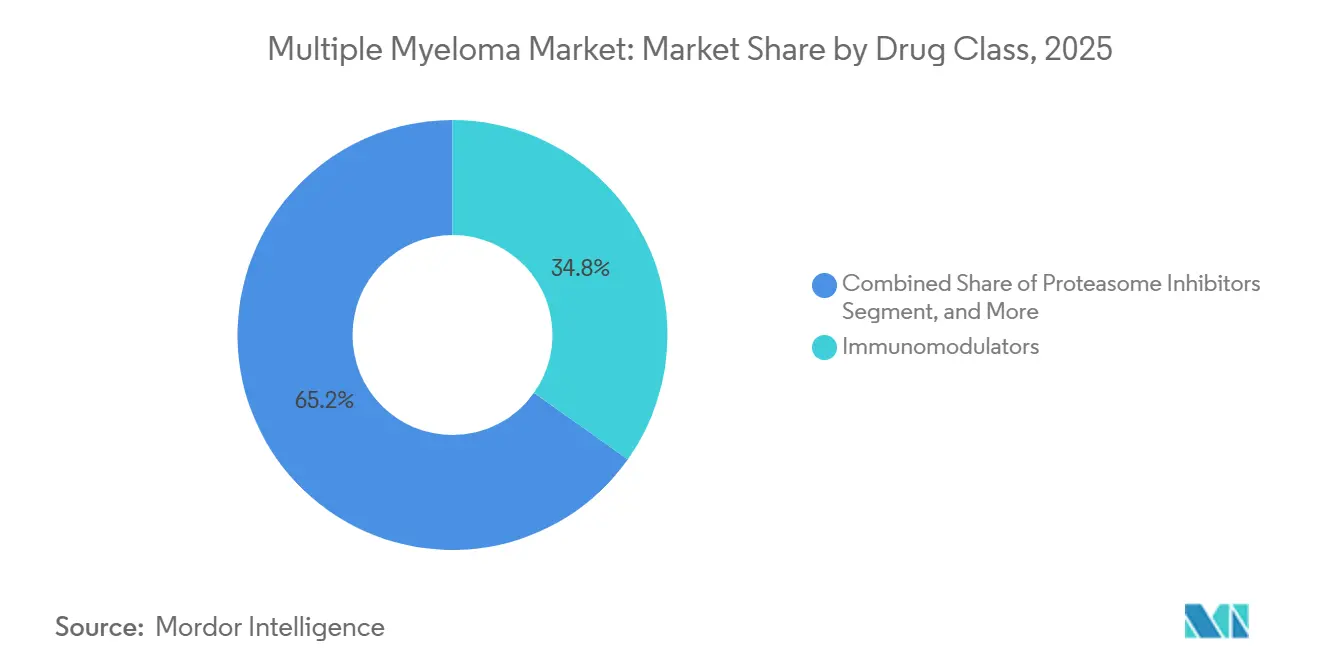
- By drug class, immunomodulators led with 34.82% multiple myeloma market share in 2025; CAR-T and cell-based therapies are forecast to record the highest CAGR at 10.06% through 2031.
- By therapy type, combination regimens commanded 61.27% of the multiple myeloma market in 2025 and are projected to expand at a 9.63% CAGR through 2031.
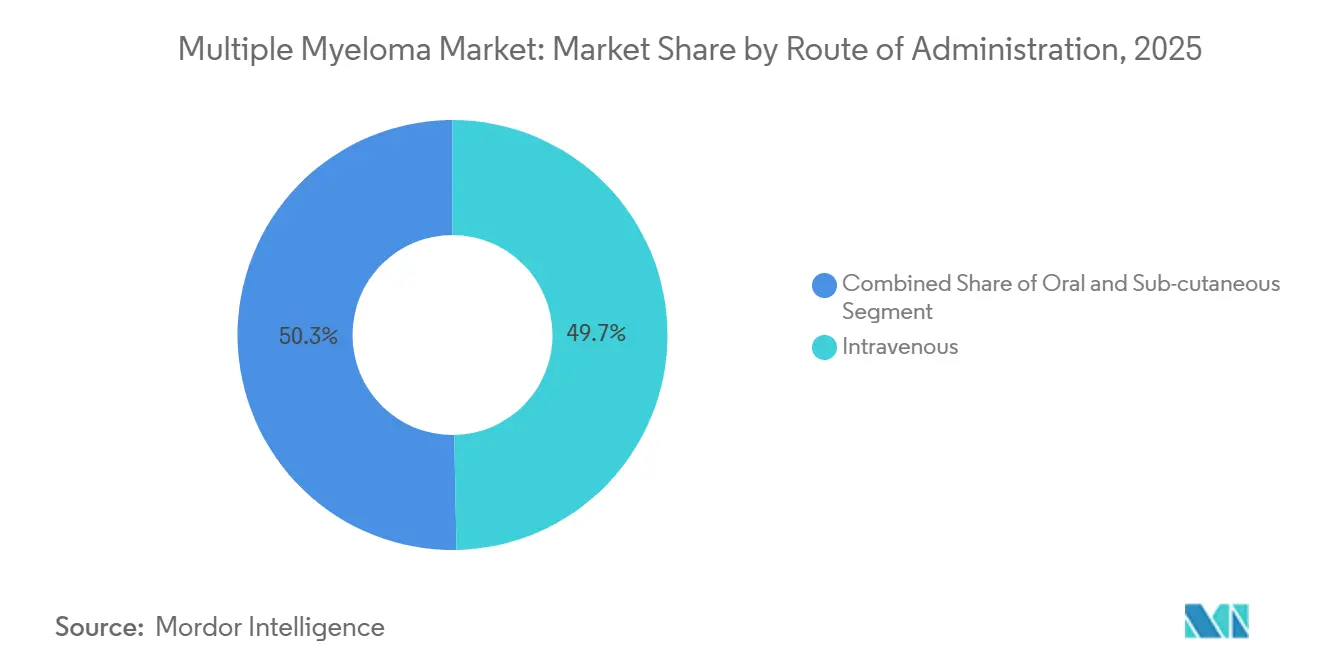
- By route of administration, intravenous dosing accounted for 49.71% of 2025 volume, while subcutaneous delivery is advancing at 8.86% CAGR over 2026-2031.
- By distribution channel, hospital pharmacies dispensed 68.23% of 2025 doses, yet online specialty networks are the fastest-growing outlet with a 10.41% CAGR to 2031.
- By geography, North America captured 44.08% of 2025 revenue, whereas Asia-Pacific is poised for the quickest expansion at 12.27% CAGR through 2031.
Note: Market size and forecast figures in this report are generated using Mordor Intelligence’s proprietary estimation framework, updated with the latest available data and insights as of January 2026.
Global Multiple Myeloma Market Trends and Insights
Drivers Impact Analysis*
| Driver | (~) % Impact on CAGR Forecast | Geographic Relevance | Impact Timeline |
|---|---|---|---|
| Rising Prevalence of Multiple Myeloma | +1.2% | Global, highest absolute growth in North America, Europe, aging APAC | Long term (≥ 4 years) |
| Launch Pace of Next-Gen Immunotherapies | +2.1% | North America & Europe lead; APAC uptake post-2027 | Medium term (2-4 years) |
| Rapid Aging of High-Income Populations | +0.9% | OECD nations, Japan, South Korea, EU-5 | Long term (≥ 4 years) |
| Favorable Reimbursement in United States and Europe | +1.5% | U.S., Germany, UK, France, Italy, Spain | Short term (≤ 2 years) |
| Growing Adoption of MRD Testing | +0.7% | U.S., Western Europe, Australia, urban China & India | Medium term (2-4 years) |
| Real-World Evidence Speeding Label Expansions | +1.0% | U.S., EU, spillover to Canada & Australia | Medium term (2-4 years) |
| Source: Mordor Intelligence | |||
Rising Prevalence of Multiple Myeloma
Incident cases continue to climb as diagnostic sensitivity improves and populations age. The International Agency for Research on Cancer estimated 176,000 new diagnoses worldwide in 2024 and projects 210,000 annually by 2030.[1]International Agency for Research on Cancer, “Cancer Today,” gco.iarc.fr A median diagnosis age near 69 ensures that the post-war baby-boom cohort sustains patient inflows, while enhanced imaging tools detect smoldering disease earlier, extending treatment sequences across more therapy lines. Ethnic disparities also shape demand, with individuals of African descent experiencing double the incidence of their European-descent counterparts, prompting targeted U.S. screening initiatives. As median survival now exceeds 8 years, each additional patient contributes durable revenue streams despite per-patient costs plateauing.
Launch Pace of Next-Gen Immunotherapies
Between January 2024 and December 2025, regulators cleared three bispecific T-cell engagers and two CAR-T constructs, compressing clinic-to-market timelines to under 9 months.[2]U.S. Food and Drug Administration, “Teclistamab Approval,” fda.gov Off-the-shelf agents such as teclistamab generated USD 890 million in 2025 sales as community oncologists administered subcutaneous injections without leukapheresis infrastructure. Supplemental filings to move these drugs into second-line use could divert USD 2 billion annually from triplet regimens if ongoing trials confirm non-inferiority. Competitive differentiation is shifting toward safety metrics, such as cytokine release syndrome incidence, as efficacy rates converge.
Rapid Aging of High-Income Populations
Persons aged 65 and older will account for 21% of OECD citizens by 2030, up from 17% in 2020. Because the risk of multiple myeloma doubles every decade after age 50, case counts rise even if age-adjusted incidence stabilizes. Geriatric guidelines now mandate frailty assessments before CAR-T infusion, given the 40% higher rate of grade-3 cytokine release syndrome in patients. Demand for subcutaneous and oral formulations that minimize clinic visits is therefore climbing, evidenced by daratumumab-hyaluronidase securing 55% of new anti-CD38 prescriptions in the United States during H2 2025.
Favorable Reimbursement in United States and Europe
Medicare’s 2025 National Coverage Determination removed evidence-development requirements for CAR-T, opening billing access for 400 additional hospitals.[3]Centers for Medicare & Medicaid Services, “National Coverage Determination for CAR-T,” cms.gov In Europe, Germany’s IQWiG issued positive assessments for teclistamab at EUR 185,000 per patient, securing rapid reimbursement. Managed-access agreements in the UK and early-access authorizations in France shaved nine months off time-to-market, illustrating payer willingness to absorb high upfront costs in exchange for durable remissions.
Restraints Impact Analysis*
| Restraint | (~) % Impact on CAGR Forecast | Geographic Relevance | Impact Timeline |
|---|---|---|---|
| High Price of Novel Therapies | -1.8% | Global; most acute in middle-income APAC, Latin America, MEA | Short term (≤ 2 years) |
| Drug-Resistance & Severe Adverse Events | -0.9% | Global; higher CRS incidence in elderly | Medium term (2-4 years) |
| Late Diagnosis in Emerging Markets | -0.6% | Sub-Saharan Africa, South Asia, rural LATAM & SEA | Long term (≥ 4 years) |
| Manufacturing Bottlenecks for Autologous Cell Therapies | -1.1% | Global capacity shortfalls | Short term (≤ 2 years) |
| Source: Mordor Intelligence | |||
High Price of Novel Therapies
CAR-T infusions cost USD 475,000 in the United States, and bispecific antibodies cost USD 23,000 per month, placing curative-intent care beyond reach for 60% of the world, lacking catastrophic coverage. India’s median household income of USD 2,400 renders an annual isatuximab course of USD 280,000 unaffordable without subsidy, while China negotiated a 70% discount on domestic CAR-T products to bring costs below USD 150,000. Outcomes-based deals, such as Novartis refunding 50% of the price of tisagenlecleucel for non-responders, are emerging but require sophisticated data infrastructure.
Drug-Resistance & Severe Adverse Events
About 30% of anti-BCMA CAR-T recipients relapse within 18 months due to antigen escape, and grade-3 cytokine release syndrome affects 8% of cellular-therapy patients, necessitating ICU-level care. The FDA added a boxed neurotoxicity warning to teclistamab in February 2025 after fatal cerebral edema cases, temporarily dampening uptake. Persistent B-cell aplasia drives infection rates above 40%, adding USD 30,000 in IV immunoglobulin costs per patient-year.
*Our forecasts treat driver/restraint impacts as directional, not additive. The impact forecasts reflect baseline growth, mix effects, and variable interactions.
Segment Analysis
By Drug Class: Cellular Therapies Outpace Legacy Platforms
Immunomodulators accounted for 34.82% of 2025 revenue, yet CAR-T and cell-based products are forecast to grow at a 10.06% CAGR, underscoring the pivot toward durable remissions in earlier lines. Anti-BCMA constructs are replacing proteasome inhibitors in third-line care, as belantamab mafodotin’s revised dosing halves the incidence of corneal toxicity. The multiple myeloma market size for CAR-T is presently limited by the apheresis bottleneck, yet planned capacity additions could unlock new demand curves beyond 2027. Allogeneic off-the-shelf candidates like UCART19 achieved 45% complete remission rates in Phase I, hinting at future disruption once durability concerns are resolved.
Manufacturing ceilings constrain supply, but investment momentum is strong. Legend Biotech’s upcoming plant should lower per-dose costs by 35%, while FDA draft rules on closed-system bioreactors may let community hospitals capture production economics locally. Should point-of-care models prevail, the multiple myeloma market could double cellular-therapy penetration by the end of the forecast horizon, diverting revenue from oral immunomodulators that today dominate maintenance settings.


By Therapy Type: Quadruplet Regimens Redefine Standards
Combination protocols accounted for 61.27% of 2025 prescriptions and will grow at a 9.63% CAGR, driven by quadruplets pairing anti-CD38 monoclonals with lenalidomide-bortezomib backbones. The MAIA trial reported a 44% reduction in progression risk, prompting NCCN to elevate the triplet to preferred frontline care. Monotherapy remains material in maintenance, where single-agent lenalidomide offers convenience for transplant recipients achieving MRD negativity. The multiple myeloma market share for quadruplets is poised to climb once bispecific antibodies are integrated into second-line cocktail studies, with results expected in 2027.
Maintenance monotherapy enjoys an identical 9.63% CAGR to combination therapy because ongoing MRD-guided de-escalation allows oncologists to extend treatment to capture survival gains. Ixazomib’s 26-month median progression-free survival in maintenance secured FDA approval in 2024, and real-world European data show 70% two-year progression-free survival with single-agent subcutaneous daratumumab. Sequencing strategy, more than regimen intensity, is now the key determinant of long-term outcomes.
By Route of Administration: Subcutaneous Formulations Gain Share
Intravenous dosing accounted for 49.71% of 2025 volume, yet subcutaneous delivery is advancing at an 8.86% CAGR as hyaluronidase-enabled formulations trim chair time to 5 minutes. CMS parity reimbursement erased the financial penalty for faster injections, helping subcutaneous daratumumab claim 60% of new U.S. prescriptions within a year of approval. Oral agents, while convenient, still require monthly labs, posing adherence hurdles for elderly cohorts.
The subcutaneous surge alters site-of-care economics, allowing ambulatory clinics to treat 40% more patients per suite without adding chairs. Oral regimens dominate maintenance therapy thanks to once-daily dosing, but myelosuppression-driven dose reductions in 40% of seniors limit universal uptake. Intravenous routes retain primacy for conditioning and step-up dosing because 48-hour observation is mandatory during CRS-risk windows.
By Distribution Channel: Specialty Networks Capture Oral Volume
Hospital pharmacies dispensed 68.23% of the 2025 doses for inpatient CAR-T infusions and CRS management. Online specialty pharmacies are growing fastest, with a 10.41% CAGR, as payers mandate mail-order fulfillment for oral agents exceeding USD 10,000 monthly. UnitedHealthcare, Cigna, and Humana now require specialty-network use, helping Accredo fill 120,000 lenalidomide scripts in 2025 while its digital platform flagged 8,000 adherence lapses for real-time outreach.
Retail pharmacies shrink as rebate-rich specialty channels underprice them; Walgreens exited oncology specialty services in 2025. Hospital channels will continue to dominate high-margin cellular therapies, whereas specialty networks will double oral-agent share by 2031, bifurcating supply between inpatient high-complexity care and at-home chronic therapy.
Geography Analysis
North America generated 44.08% of global revenue in 2025, buoyed by Medicare coverage expansions and a network of 280 certified CAR-T centers. Four novel therapies cleared FDA review in 2025, cutting launch lag to nine months, while Canada’s 45% price cut for Carvykti and Mexico’s inclusion of subcutaneous daratumumab in public formularies broadened regional access.
Asia-Pacific will post the fastest regional growth rate at 12.27% CAGR. China approved Carvykti at CNY 1.2 million, immediately adding it to the national reimbursement list with 70% coverage, thereby making cellular therapy accessible to 15,000 patients per year. Japan reimbursed teclistamab at JPY 25 million per patient, aligning with cost-effectiveness thresholds, while Australia reduced patient co-pays for isatuximab to AUD 42 per fill. India slashed lenalidomide caps, yet rural penetration remains low, underscoring the urban–rural care divide in the multiple myeloma industry.
Germany and the UK granted positive health-technology assessments for teclistamab and Carvykti, embedding managed-access agreements that tie payments to five-year overall survival targets. France’s early-access route shortened time-to-reimbursement by nine months, while Italy’s essential-medicines list now includes subcutaneous daratumumab. Sub-Saharan Africa and most of the Middle East lag due to funding deficits, save for the UAE, which approved government reimbursement for daratumumab in 2025, signaling incremental progress in access equity.

Competitive Landscape
Competitive intensity is moderate. Vertical integrations, Celgene for Revlimid and Actelion for GPRC5D assets, shore up incumbent pipelines, yet generic lenalidomide’s 35% U.S. share loss in 12 months forces a pivot to high-value CAR-T franchises. Real-world evidence has become a strategic differentiator; Janssen leveraged 1,200-patient observational data to extend Tecvayli’s label without a randomized study, highlighting regulators’ comfort with pragmatic datasets.
Patent cliffs drive M&A as firms seek to replenish their pipelines, while smaller players like Legend Biotech and Adaptive Biotechnologies exploit allogeneic constructs to shorten manufacturing cycles. Draft FDA guidance on decentralized production could further democratize supply and erode the manufacturing moat of big pharma. European conditional approvals permit single-arm data packages, enabling mid-size biotechs such as Oncopeptides to compete despite lean trial budgets. Price pressure is mounting as health-technology bodies demand outcomes-based deals, prompting Pfizer to invest USD 300 million in bioreactor expansion to reduce elranatamab unit costs by 25% and counter future tender erosion.
Manufacturers are also racing to mitigate antigen-escape relapse. Bristol Myers Squibb initiated Phase II testing of a dual-targeted BCMA/GPRC5D CAR-T after 18% of Abecma responders relapsed with BCMA-negative disease. Sanofi’s partnership with Teneobio aims to reduce CRS incidence to <30% grade-2+ events. Market positioning now hinges on balancing depth of response with tolerability and logistical convenience in an increasingly segmented multiple myeloma market.
Multiple Myeloma Industry Leaders
Bristol-Myers Squibb Company
Takeda Pharmaceutical Company Limited
Amgen Inc.
Sanofi S.A.
Karyopharm Therapeutics Inc.
- *Disclaimer: Major Players sorted in no particular order

Recent Industry Developments
- February 2026: FDA review underway for Bristol Myers Squibb (BMS)'s iberdomide, potentially making it the first celmod (cereblon E3 ligase modulator) to reach the US market for relapsed/refractory multiple myeloma. Iberdomide is one of three late‑stage celmods in BMS’s pipeline, representing a major strategic pillar as the company prepares for the declining exclusivity of its blockbuster IMiDs Revlimid and Pomalyst.
- February 2026: Gilead Sciences announced a definitive agreement to acquire Arcellx for USD 7.8 billion, including USD 115 per share in cash plus a USD 5/share CVR. The acquisition strengthens Gilead’s position in cell therapy and next‑generation immuno‑oncology, expanding its pipeline beyond virology.
- January 2026: Johnson & Johnson (J&J) submitted an application to the European Medicines Agency (EMA) seeking approval for the teclistamab–daratumumab combination for multiple myeloma. The combination leverages teclistamab’s bispecific T‑cell–engaging mechanism with daratumumab’s established anti‑CD38 activity, aiming to deliver deeper and more durable responses.
- January 2025: AbbVie announced a strategic partnership with Simcere Zaiming to develop SIM0500, a novel trispecific antibody candidate targeting GPRC5D, BCMA, and CD3 for relapsed or refractory multiple myeloma, with potential milestone payments totaling USD 1.055 billion plus tiered royalties. This collaboration represents one of the largest deals in multiple myeloma drug development and validates the strategic importance of multi-target approaches for overcoming treatment resistance.


Research Methodology Framework and Report Scope
Market Definitions and Key Coverage
Mordor Intelligence defines the multiple myeloma market as the worldwide sales value of prescription therapeutics, immunomodulators, proteasome inhibitors, monoclonal antibodies, cell and gene-based products, bispecifics, and other approved drug classes used at any line of therapy for active or smoldering disease.
Scope exclusion: diagnostics, minimal residual disease test kits, and supportive drugs such as bisphosphonates are outside this study.
Segmentation Overview
- By Drug Class
- Proteasome Inhibitors
- Immunomodulators (IMiDs)
- Anti-CD38 mAbs
- Anti-BCMA Therapies (mAbs, ADCs)
- CAR-T & Cell-based Therapies
- Others (HDACi, Alkylating Agents)
- By Therapy Type
- Monotherapy
- Combination Therapy
- By Route of Administration
- Oral
- Intravenous
- Sub-cutaneous
- By Distribution Channel
- Hospital Pharmacies
- Retail Pharmacies
- Online Pharmacies
- By Geography
- North America
- United States
- Canada
- Mexico
- Europe
- Germany
- United Kingdom
- France
- Italy
- Spain
- Rest of Europe
- Asia-Pacific
- China
- Japan
- India
- Australia
- South Korea
- Rest of Asia-Pacific
- Middle East & Africa
- GCC
- South Africa
- Rest of Middle East & Africa
- South America
- Brazil
- Argentina
- Rest of South America
- North America
Detailed Research Methodology and Data Validation
Primary Research
Subsequently, we interview hematologists, oncology pharmacists, payers, and CRO executives across North America, Europe, and key Asian markets. These discussions validate prevalence curves, average course durations, emerging price concessions, and pipeline launch timing, letting us fine-tune model assumptions that literature alone cannot settle.
Desk Research
Our analysts start with public datasets that anchor patient incidence, treatment uptake, and pricing: cancer registries (SEER, GLOBOCAN), pharmaceutical trade filings, national drug price compendia, clinical trial registries, and association white papers such as the International Myeloma Society annual abstracts. Company 10-Ks and investor decks reveal SKU-level sales patterns, while curated paid feeds, D&B Hoovers for company revenue splits and Dow Jones Factiva for regulatory news, supply continual updates.
Epidemiology meta-analyses, hospital discharge statistics, and customs export tallies on finished oncology injectables further frame regional volume flows. The sources listed illustrate our wider desk research net; many more outlets are consulted for cross-checks and clarification.
Market-Sizing & Forecasting
We anchor 2025 revenue using a top-down prevalence-to-treated-patient build, multiplied by mean annual therapy cost. Bottom-up spot checks, sample hospital pharmacy purchases and manufacturer disclosures, calibrate average selling prices and line-of-therapy splits. Key variables include diagnosed incidence, adoption lag of novel biologics, generic lenalidomide erosion, CAR-T capacity expansion, and payer reimbursement ceilings. Multivariate regression projects each driver, while scenario analysis tests high-price and rapid uptake cases before the composite CAGR is locked.
Data Validation & Update Cycle
Outputs run through automated variance flags, peer review, and a senior analyst sign-off. The dataset refreshes annually, with interim revisions triggered by label expansions, major guideline changes, or pricing shocks; a last-mile check occurs just before each publication.
Why Mordor's Multiple Myeloma Baseline Earns Trust
Published estimates often differ because firms vary treatment lists, geographic reach, currency year, and refresh cadence.
Key gap drivers include whether bispecific antibodies and CAR-T launches are fully counted, how quickly generic erosion is modeled, and if hospital discounting is applied. External publishers currently quote 2024 values between USD 27.75 billion and USD 28.42 billion, yet some exclude emerging cell therapies or apply flat pricing to 2030, explaining narrower growth.
Benchmark comparison
| Market Size | Anonymized source | Primary gap driver |
|---|---|---|
| USD 24.12 Bn (2025) | Mordor Intelligence | - |
| USD 27.75 Bn (2024) | Global Consultancy A | Omits third-line CAR-T uptake; uses static ASP |
| USD 28.42 Bn (2024) | Trade Journal B | Counts supportive drugs; limited country set |
These comparisons show that our stepwise scope selection, dual-path modeling, and yearly refresh yield a balanced, reproducible baseline clients can rely on.


Key Questions Answered in the Report
How large will global spending on multiple myeloma therapies be by 2031?
Global revenue is projected to reach USD 38.09 billion by 2031, driven by a 8.03% CAGR in the multiple myeloma market.
Which treatment class is expanding the fastest?
CAR-T and other cell-based therapies lead growth with a 10.06% CAGR through 2031, reflecting payer support for earlier-line cellular interventions.
Why is Asia-Pacific the quickest-growing region?
China’s approval of lower-priced domestic CAR-T constructs and Japan’s reimbursement of subcutaneous daratumumab push Asia-Pacific to a 12.27% CAGR.
What factors limit wider CAR-T adoption?
High list prices, limited autologous manufacturing slots, and grade-3 cytokine release syndrome events constrain broader uptake despite strong efficacy.
How are payers controlling therapy costs?
Insurers deploy outcomes-based contracts tied to MRD negativity, mandate specialty-pharmacy channels for oral agents, and negotiate steep discounts for hospital infusions.
Page last updated on:


