Chronic Myelogenous Leukemia Treatment Market Size and Share
Market Overview
| Study Period | 2020 - 2031 |
|---|---|
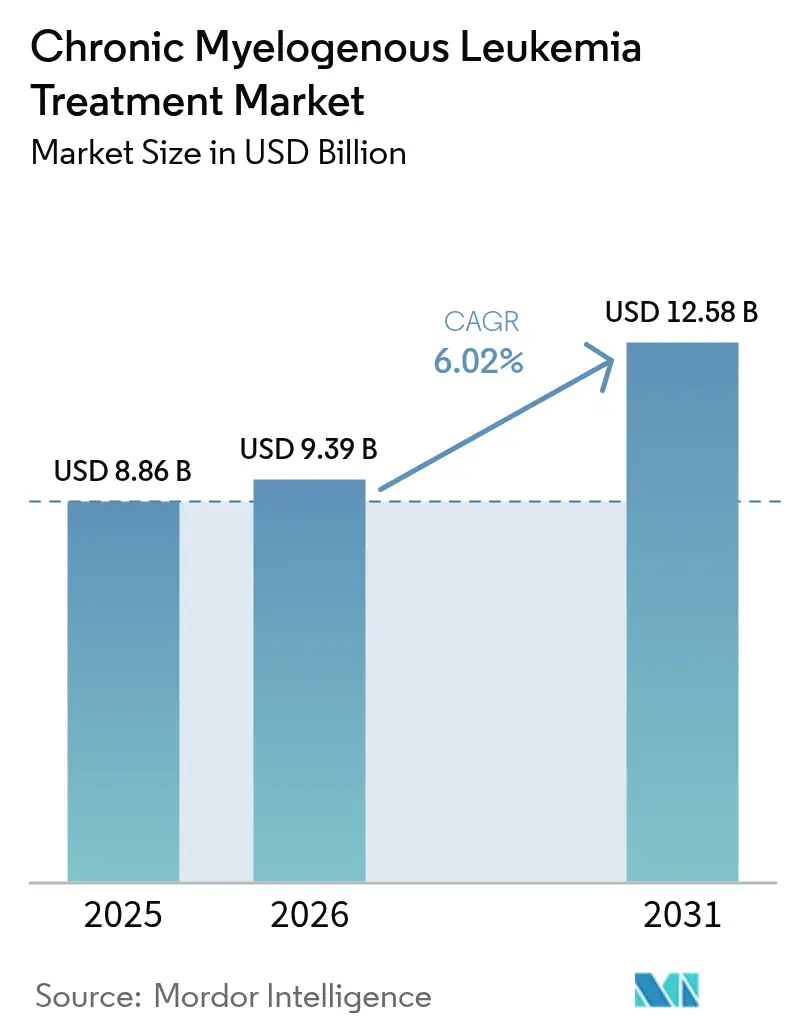
| Market Size (2026) | USD 9.39 Billion |
| Market Size (2031) | USD 12.58 Billion |
| Growth Rate (2026 - 2031) | 6.02% CAGR |
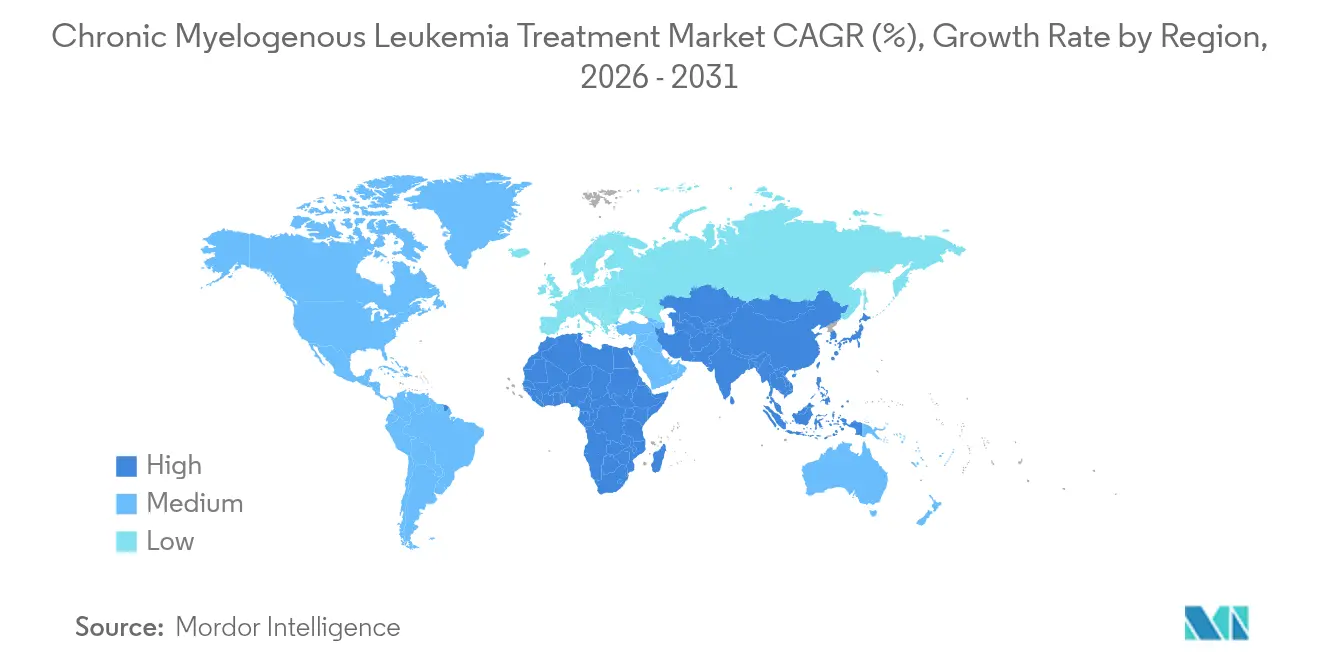
| Fastest Growing Market | Asia Pacific |
| Largest Market | North America |
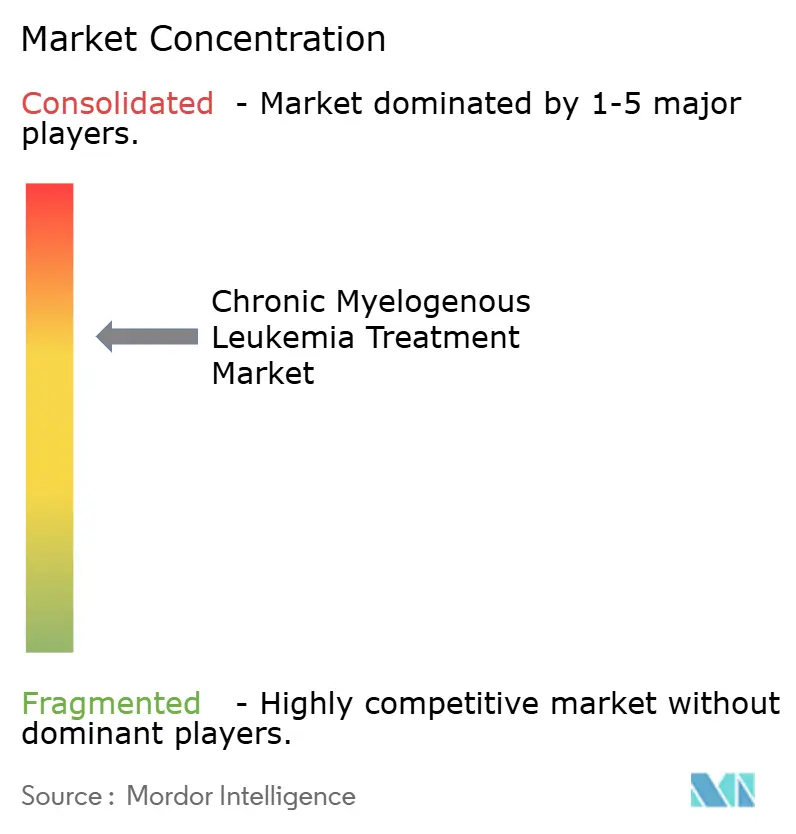
| Market Concentration | Medium |
Major Players *Disclaimer: Major Players sorted in no particular order Image © Mordor Intelligence. Reuse requires attribution under CC BY 4.0. | |
Chronic Myelogenous Leukemia Treatment Market Analysis by Mordor Intelligence
Chronic Myelogenous Leukemia Treatment market size in 2026 is estimated at USD 9.39 billion, growing from 2025 value of USD 8.86 billion with 2031 projections showing USD 12.58 billion, growing at 6.02% CAGR over 2026-2031. Expansion stems from the steady transition of CML from a once-fatal diagnosis to a chronic condition managed through precision medicine. Robust uptake of next-generation tyrosine-kinase inhibitors (TKIs), rising clinical focus on treatment-free remission, and broader access to molecular monitoring underpin demand. Shifting patient preferences toward convenient oral regimens, paired with regulatory support for breakthrough drugs, further elevate revenue potential. Meanwhile, price competition from imminent generic 2G TKIs is expected to widen patient access without eroding premium uptake of innovative agents.
Key Report Takeaways
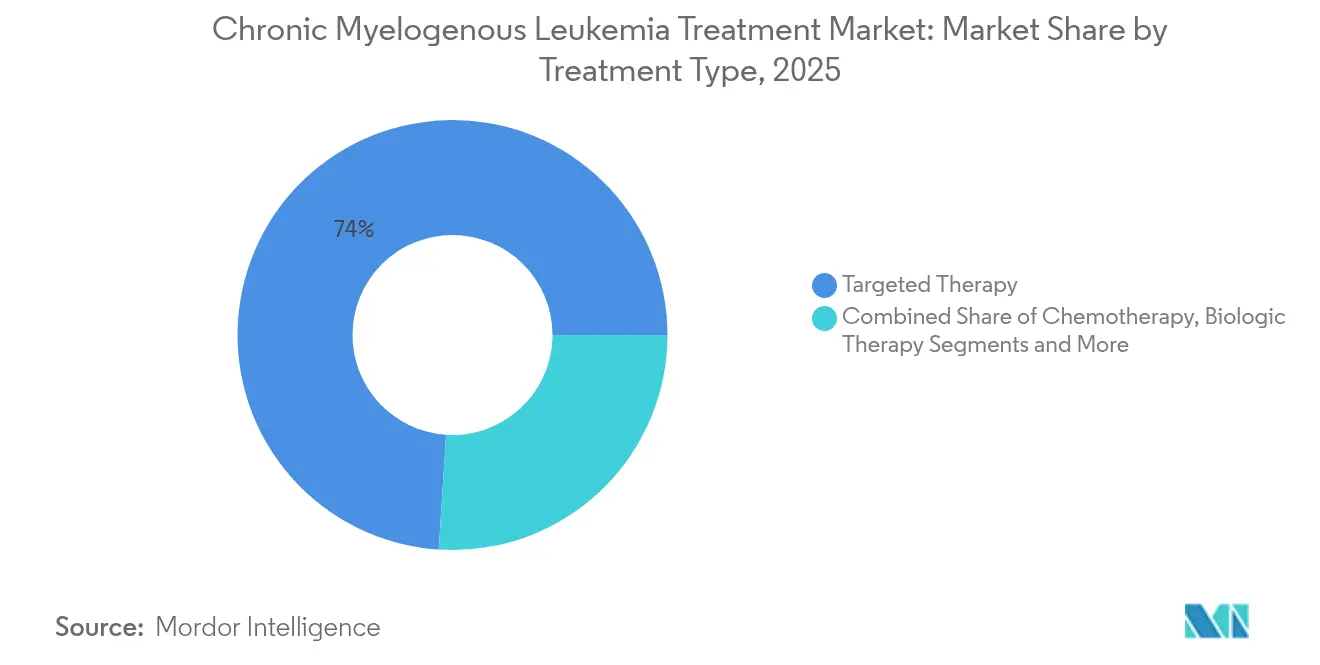
- By treatment type, targeted therapy led with 73.98% of Chronic Myelogenous Leukemia Treatment market share in 2025, while biologic therapy is forecast to grow at 9.21% CAGR to 2031.
- By line of therapy, first-line regimens held 61.75% share in 2025; third-line and beyond treatments are poised for a 7.55% CAGR through 2031.
- By route of administration, oral products accounted for 77.66% of the Chronic Myelogenous Leukemia Treatment market size in 2025; subcutaneous formulations are rising at 9.08% CAGR.
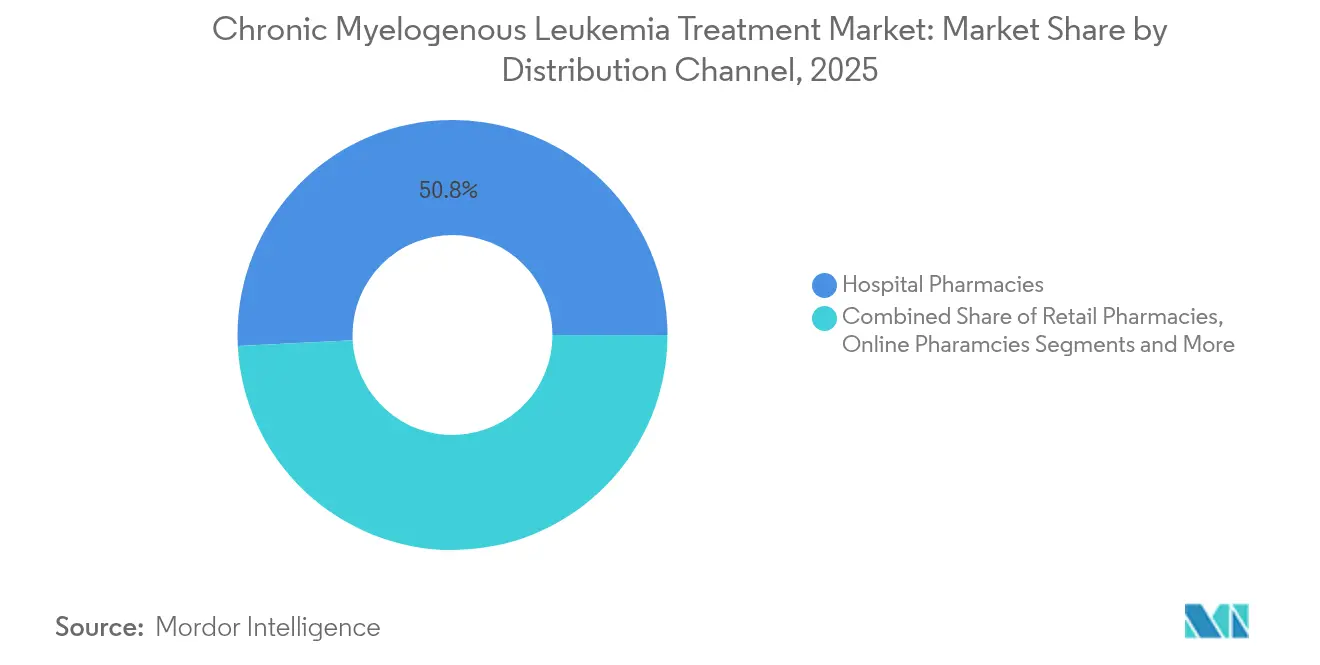
- By distribution channel, hospital pharmacies retained 50.82% revenue share in 2025, whereas online pharmacies will expand at 8.62% CAGR to 2031.
- By patient age group, adults dominated in 2025, yet the pediatric segment is advancing at 8.6% CAGR on the back of dose-tailored formulations.
- By geography, North America captured 39.92% revenue in 2025; Asia Pacific is on track for the fastest 8.02% CAGR.
Note: Market size and forecast figures in this report are generated using Mordor Intelligence’s proprietary estimation framework, updated with the latest available data and insights as of 2026.
Global Chronic Myelogenous Leukemia Treatment Market Trends and Insights
Drivers Impact Analysis*
| Driver | (~) % Impact on CAGR Forecast | Geographic Relevance | Impact Timeline |
|---|---|---|---|
| Rising Incidence & Prevalence Of CML | +1.2% | Global, with higher impact in aging populations of North America & Europe | Long term (≥ 4 years) |
| Breakthroughs In Next-Gen TKIs | +1.8% | Global, with early adoption in North America & Europe | Medium term (2-4 years) |
| Escalating R&D Funding & Clinical-Trial Volume | +0.9% | North America & EU leading, APAC emerging | Medium term (2-4 years) |
| Shift Toward Treatment-Free Remission (TFR) Protocols | +1.1% | North America & Europe primarily, expanding to APAC | Long term (≥ 4 years) |
| Imminent Wave Of Generic 2G TKIs Reducing Therapy Cost | +0.7% | Global, with significant impact in price-sensitive markets | Short term (≤ 2 years) |
| AI-Enabled Molecular Monitoring For Dose Optimisation | +0.6% | North America & Europe initially, gradual APAC adoption | Medium term (2-4 years) |
| Source: Mordor Intelligence | |||
Rising Incidence & Prevalence of CML
Global CML diagnoses are expanding alongside aging demographics, with 8,930 new U.S. cases anticipated in 2024. Earlier detection through routine blood tests leads to more chronic-phase presentations that respond favorably to TKIs. Improved survival enlarges the prevalent patient pool requiring long-term therapy, while underdiagnosis in low- and middle-income countries (LMICs) leaves room for significant future growth. Healthcare systems in Europe and North America already integrate molecular diagnostics as standard of care, setting the stage for similar penetration in Asia Pacific as laboratory infrastructure matures.
Breakthroughs in Next-Gen TKIs
The FDA’s 2024 accelerated approval of asciminib for newly diagnosed patients showcases a novel myristoyl-pocket mechanism that achieved a 68% major molecular response versus 49% with comparator TKIs.[1]Oncology Nursing Society, “FDA Grants Asciminib Accelerated Approval for Newly Diagnosed Chronic Myeloid Leukemia,” Oncology Nursing Society, ons.orgMutation-specific agents like olverembatinib address difficult T315I resistance and received breakthrough status in China, signaling a pipeline pivot toward precision targeting that curtails off-target toxicity.
Escalating R&D Funding & Clinical-Trial Volume
Large academic centers such as UCSF and Dana-Farber run multiple CML trials exploring combination regimens and transplant alternatives.[2]University of California San Francisco, “Clinical Trials in CML,” ucsf.edu Pharmaceutical pipelines remain active: Bristol Myers Squibb disclosed 44 hematology assets across 40 disease areas, supported by orphan-drug incentives that extend exclusivity. AI-driven discovery platforms shorten lead-optimization cycles and lower development costs, reinforcing steady inflows of capital into CML research.
Shift Toward Treatment-Free Remission (TFR) Protocols
Long-term studies show 14.1% of first-line 2G-TKI patients sustain remission off therapy.[3]Simone Claudiani et al., “Long-Term Outcomes After Upfront Second-Generation Tyrosine Kinase Inhibitors for Chronic Myeloid Leukemia: Managing Intolerance and Resistance,” Leukemia, nature.com Updated European LeukemiaNet guidelines codify deep molecular response thresholds, enabling predictable TFR attempts. Digital PCR at 0.0023%IS sensitivity identifies ideal candidates. Nonetheless, 18.3% of eligible patients hesitate to discontinue, underscoring the need for shared decision-making frameworks.
Restraints Impact Analysis*
| Restraint | (~) % Impact on CAGR Forecast | Geographic Relevance | Impact Timeline |
|---|---|---|---|
| Off-Target Toxicities & Cardiovascular Events With Multi-TKIs | -1.4% | Global, with higher impact in aging populations | Medium term (2-4 years) |
| Stringent Regulatory & Pharmacovigilance Requirements | -0.8% | North America & Europe primarily | Long term (≥ 4 years) |
| Rising Real-World TKI Resistance From Poor Adherence | -1.1% | Global, with higher impact in price-sensitive markets | Short term (≤ 2 years) |
| Inadequate Molecular-Monitoring Access In LMICs | -0.6% | APAC, MEA, and Latin America | Long term (≥ 4 years) |
| Source: Mordor Intelligence | |||
Off-Target Toxicities & Cardiovascular Events with Multi-TKIs
Nilotinib and ponatinib have been linked to arterial events that necessitate baseline cardiovascular risk assessments and frequent monitoring. Sequential TKI use compounds risk, prompting interest in earlier TFR or alternative mutation-specific drugs that offer narrower kinase inhibition profiles.
Stringent Regulatory & Pharmacovigilance Requirements
Expanded post-marketing surveillance for cardiovascular events, hepatotoxicity, and secondary malignancies increases development timelines and compliance costs in the Chronic Myelogenous Leukemia Treatment market. Companies must sustain global safety databases and periodic benefit-risk evaluations, diverting resources from portfolio expansion.
*Our forecasts treat driver/restraint impacts as directional, not additive. The impact forecasts reflect baseline growth, mix effects, and variable interactions.
Segment Analysis
By Treatment Type: Targeted Therapy Dominance
Targeted therapy secured 73.98% revenue in 2025 and underpins the Chronic Myelogenous Leukemia Treatment market through 2031. Widespread physician familiarity, broad guideline inclusion, and deep molecular response rates maintain its primacy. Biologic therapy, while representing a smaller segment, is projected to register the highest growth rate owing to increasing clinical interest in interferon-based combination regimens and treatment-free remission (TFR) strategies. The Chronic Myelogenous Leukemia Treatment market size for biologic therapies is expected to expand as studies demonstrate their ability to deepen molecular responses and support sustained remission. Growing adoption of pegylated interferon therapies alongside TKIs, particularly in patients pursuing long-term disease control and potential TFR, is expected to drive segment growth over the forecast period.
Stem-cell transplantation retains curative potential with 80% five-year disease-free survival in chronic-phase recipients, yet its share shrinks as TKIs mitigate early progression. Post-transplant cyclophosphamide broadens donor pools, particularly benefitting genetically diverse populations. Chemotherapy remains limited to blast-phase crises, while monoclonal antibodies aimed at CD20 and other markers advance through early trials.


By Line of Therapy: First-Line Stability Amid Third-Line Growth
First-line regimens held 61.75% of Chronic Myelogenous Leukemia Treatment market share in 2025, anchored by imatinib’s longevity and wider availability of 2G alternatives. Third-line and beyond therapies are forecast for 7.55% CAGR as resistance mutations accumulate over extended patient lifespans. NCCN guidelines increasingly tailor initial TKI choice to Sokal or ELTS risk scores, age, and comorbidity burden. Mutation-guided sequencing with asciminib and olverembatinib is set to lift third-line uptake. The Chronic Myelogenous Leukemia Treatment market size for later-line settings is projected to reach new highs as clinicians adopt combination and mutation-specific regimens.
By Route of Administration: Oral Dominance Challenged by Subcutaneous Innovation
Oral formulations owned 77.66% revenue in 2025, favored for home administration and lower clinic utilization. Subcutaneous products will rise at 9.08% CAGR, with regulatory acceptance of agents such as nivolumab in a ready-to-inject format. Nanotechnology carriers promise targeted tissue delivery that may eventually converge oral convenience with subcutaneous pharmacokinetic control. Intravenous options remain for blast-phase salvage or monoclonal antibody regimens but are losing share as outpatient-friendly alternatives mature.
By Distribution Channel: Hospital Dominance Faces Digital Disruption
Hospital pharmacies comprised 50.82% of sales in 2025 as initiation and adverse-event management largely occur in tertiary centers. Online pharmacies, growing at 8.62% CAGR, appeal to stable chronic-phase patients seeking cost savings and uninterrupted supply chains. Retail outlets service patients prioritizing same-day pickup. Yet, reimbursement cuts and PBM consolidation threaten the viability of medically integrated dispensing programs, potentially nudging patients toward broader e-commerce platforms.
By Patient Age Group: Adult Dominance with Pediatric Innovation
Adults represented 67.12% of revenues in 2025, mirroring the disease’s median diagnosis at 64 years. Specialized pediatric protocols drive an 8.6% CAGR for the under-18 cohort, highlighted by weight-based dasatinib dosing and ongoing asciminib trials. Geriatric therapy strategies emphasize reduced starting doses and closer cardiovascular monitoring, reflecting higher comorbidity loads.
Geography Analysis
North America held 39.92% of global revenue in 2025, supported by early FDA approvals, comprehensive insurance coverage, and the world’s highest density of molecular labs. U.S. academic hubs pioneer TFR studies and combination trials that set clinical benchmarks worldwide. Canadian universal coverage widens TKI access, though adoption of brand-new agents can lag due to provincial formulary reviews.
Asia Pacific leads future growth at an 8.02% CAGR. China fast-tracks breakthrough therapies through the National Reimbursement Drug List, while India leverages rising private insurance penetration to pay for TKIs. Japan’s super-aged society sustains steady demand, and South Korea’s precision-medicine initiatives promote AI-based monitoring. Regional disparities persist: rural areas in India and Indonesia still lack real-time PCR capacity, delaying optimal therapy adjustments.
Europe constitutes a mature but innovation-friendly arena. Project Orbis collaboration allows simultaneous EMA-FDA reviews, shrinking access gaps. Germany and the United Kingdom spearhead adaptive trial designs, whereas budget constraints in Southern Europe can slow uptake of premium therapies. The Middle East and Africa remain nascent markets whose expansion hinges on lab-network investments and donor-funded medication programs.

Competitive Landscape
The Chronic Myelogenous Leukemia Treatment market features moderate concentration. Novartis anchors its franchise with imatinib, nilotinib, and the recently expanded asciminib label, safeguarding revenue with successive patent layers. Bristol Myers Squibb defends dasatinib while exploring combination immunotherapies, though first generics threaten price erosion from 2025 onward. Pfizer remains a steady competitor through bosutinib and alliance-driven research.
Generic entrants will reshape pricing once 2G TKI patents fall off, opening space for cost-sensitive payers without undercutting premium uptake of novel agents for resistant disease. Takeda’s 2024 option to in-license olverembatinib exemplifies strategic maneuvers to access mutation-specific assets. AI partnerships and real-world evidence platforms gain prominence as payers demand proof of value beyond response rates.
Emerging biotech firms leverage CAR-T technology and nanoparticle drug delivery that could disrupt the established TKI paradigm. Meanwhile, providers and payers negotiate value-based contracts linking reimbursement to molecular response durability, compelling manufacturers to furnish longitudinal evidence.
Chronic Myelogenous Leukemia Treatment Industry Leaders
Bristol-Myers Squibb Co
Pfizer, Inc.
Teva Pharmaceutical Industries Ltd.
Takeda Pharmaceutical Co. Ltd
Novartis AG
- *Disclaimer: Major Players sorted in no particular order

Recent Industry Developments
- February 2025: Cipla obtained FDA approval for Nilotinib capsules in 50 mg, 150 mg, and 200 mg strengths.
- January 2025: Handa Therapeutics acquired PHYRAGO (dasatinib) tablets, the only product co-administerable with gastric acid-reducing agents.
- October 2024: FDA granted accelerated approval to asciminib for newly diagnosed Ph+ CML in chronic phase following 68% major molecular response in ASC4FIRST.
- June 2024: Takeda entered an exclusive global license option for olverembatinib, targeting T315I-mutant CML.


Research Methodology Framework and Report Scope
Market Definitions and Key Coverage
Our study defines the chronic myelogenous leukemia (CML) treatment market as the worldwide sales value of branded and generic pharmacologic agents, chiefly tyrosine-kinase inhibitors, cytotoxic chemotherapies, biologics, and allogeneic transplant conditioning drugs, used in first through later lines of CML care, across inpatient and outpatient settings.
Scope exclusion: diagnostics, general supportive drugs (for example, anti-emetics), and hospital service charges do not enter this valuation.
Segmentation Overview
- By Treatment Type
- Targeted Therapy
- Chemotherapy
- Biologic Therapy
- Stem Cell Transplantation
- Other Treatment Types
- By Line of Therapy
- First-line
- Second-line
- Third-line & Beyond
- By Route of Administration
- Oral
- Intravenous
- Subcutaneous
- By Distribution Channel
- Hospital Pharmacies
- Retail Pharmacies
- Online Pharmacies
- Specialty Clinics
- By Patient Age Group
- Pediatric
- Adults
- Geriatric
- By Geography
- North America
- United States
- Canada
- Mexico
- Europe
- Germany
- United Kingdom
- France
- Italy
- Spain
- Rest of Europe
- Asia-Pacific
- China
- Japan
- India
- Australia
- South Korea
- Rest of Asia-Pacific
- Middle East and Africa
- GCC
- South Africa
- Rest of Middle East and Africa
- South America
- Brazil
- Argentina
- Rest of South America
- North America
Detailed Research Methodology and Data Validation
Primary Research
Mordor analysts interview hematologist-oncologists, hospital pharmacists, and reimbursement advisors in North America, Europe, and key Asia-Pacific markets, using structured questionnaires to validate therapy-line mix, average treatment duration, and expected price erosion.
Follow-up calls with manufacturers' medical affairs teams clarify launch timelines and patient-share assumptions.
Desk Research
We begin with global disease-burden datasets such as WHO GLOBOCAN, SEER, and EU-CAN to anchor incidence, prevalence, and age-split ratios, which are then paired with regulator databases (US FDA, EMA, PMDA) for product approvals and label expansions.
Drug list prices and reimbursement ceilings from national formularies, IQVIA MIDAS extracts, and company 10-Ks retrieved through Dow Jones Factiva provide baseline revenue points.
Industry associations like the Leukemia & Lymphoma Society, patent analytics from Questel, and shipment clues from Volza help refine pipeline timing and regional access.
This list is illustrative, not exhaustive; many other open and paid feeds reinforce our desk work.
Market-Sizing & Forecasting
A top-down incidence-to-treated cohort build is run first, multiplying diagnosed patients by treatment uptake and persistence; resulting volumes are priced using weighted average selling prices net of typical discounts.
Selective bottom-up checks, sampled hospital purchase audits and supplier roll-ups, stress-test totals before reconciliation.
Key variables include annual CML incidence per 100,000 population, average duration on first-line TKIs, median ex-manufacturer ASP, generic entry timing, and region-specific reimbursement ceilings.
A multivariate regression model forecasts each variable, after which scenario analysis adjusts for pipeline success probabilities.
Data gaps in hospital audits are bridged with conservative interpolation from nearest comparable markets.
Data Validation & Update Cycle
Outputs pass a three-layer review: automated variance flags, senior analyst sign-off, and a quarterly re-contact trigger when approvals, safety alerts, or guideline shifts occur.
Reports refresh every twelve months, and an analyst conducts a last-minute sweep before delivery so clients receive the freshest view.
Why Mordor's Chronic Myelogenous Leukemia Treatment Baseline Inspires Confidence
Published figures often diverge because providers choose different geographic canvases, product baskets, and price nets. Our disciplined variable selection and mixed-method triangulation give decision-makers a dependable midpoint that resists outlier swings.
Key gap drivers include competitors rolling CML into wider myeloproliferative categories, restricting coverage to seven mature markets, or applying single flat discounts without therapy-line nuance, whereas Mordor's model separates each regimen, applies region-specific net pricing, and refreshes annually.
Benchmark comparison
| Market Size | Anonymized source | Primary gap driver |
|---|---|---|
| USD 8.86 B (2025) | Mordor Intelligence | |
| USD 8.55 B (2024) | Global Consultancy A | Derived from parent myeloproliferative market share; limited primary validation |
| USD 5.70 B (2024) | Regional Consultancy B | Covers only seven major countries; excludes transplant drugs |
| USD 4.91 B (2024) | Industry Portal C | Applies uniform 40% discount and omits second-line uptake dynamics |
The comparison shows that scope width, therapy-line depth, and update cadence largely explain numerical gaps. By addressing each factor through transparent, repeatable steps, Mordor Intelligence delivers a balanced baseline clients can trust.


Key Questions Answered in the Report
What is the current value of the Chronic Myelogenous Leukemia Treatment market?
The market is valued at USD 9.39 billion in 2026 and is forecast to reach USD 12.58 billion by 2031.
Which therapy type holds the largest Chronic Myelogenous Leukemia Treatment market share?
Targeted therapy led with 73.98% revenue in 2025.
Which region is growing the fastest in the Chronic Myelogenous Leukemia Treatment market?
Asia Pacific is projected for an 8.02% CAGR through 2031.
How significant is biologic therapy growth in this market?
Biologic Therapy is the fastest-expanding segment with an expected 9.21% CAGR to 2031.
What impact will generic 2G TKIs have on market dynamics?
Generic entry is set to lower treatment costs and broaden access, particularly in price-sensitive regions, while shifting value toward novel mutation-specific therapies.
Why is treatment-free remission gaining importance?
Long-term data show that properly selected patients can discontinue TKIs safely, reducing toxicity and cost while maintaining durable molecular remission.
Page last updated on:


