MRI Contrast Agents Market Size and Share
Market Overview
| Study Period | 2020 - 2031 |
|---|---|
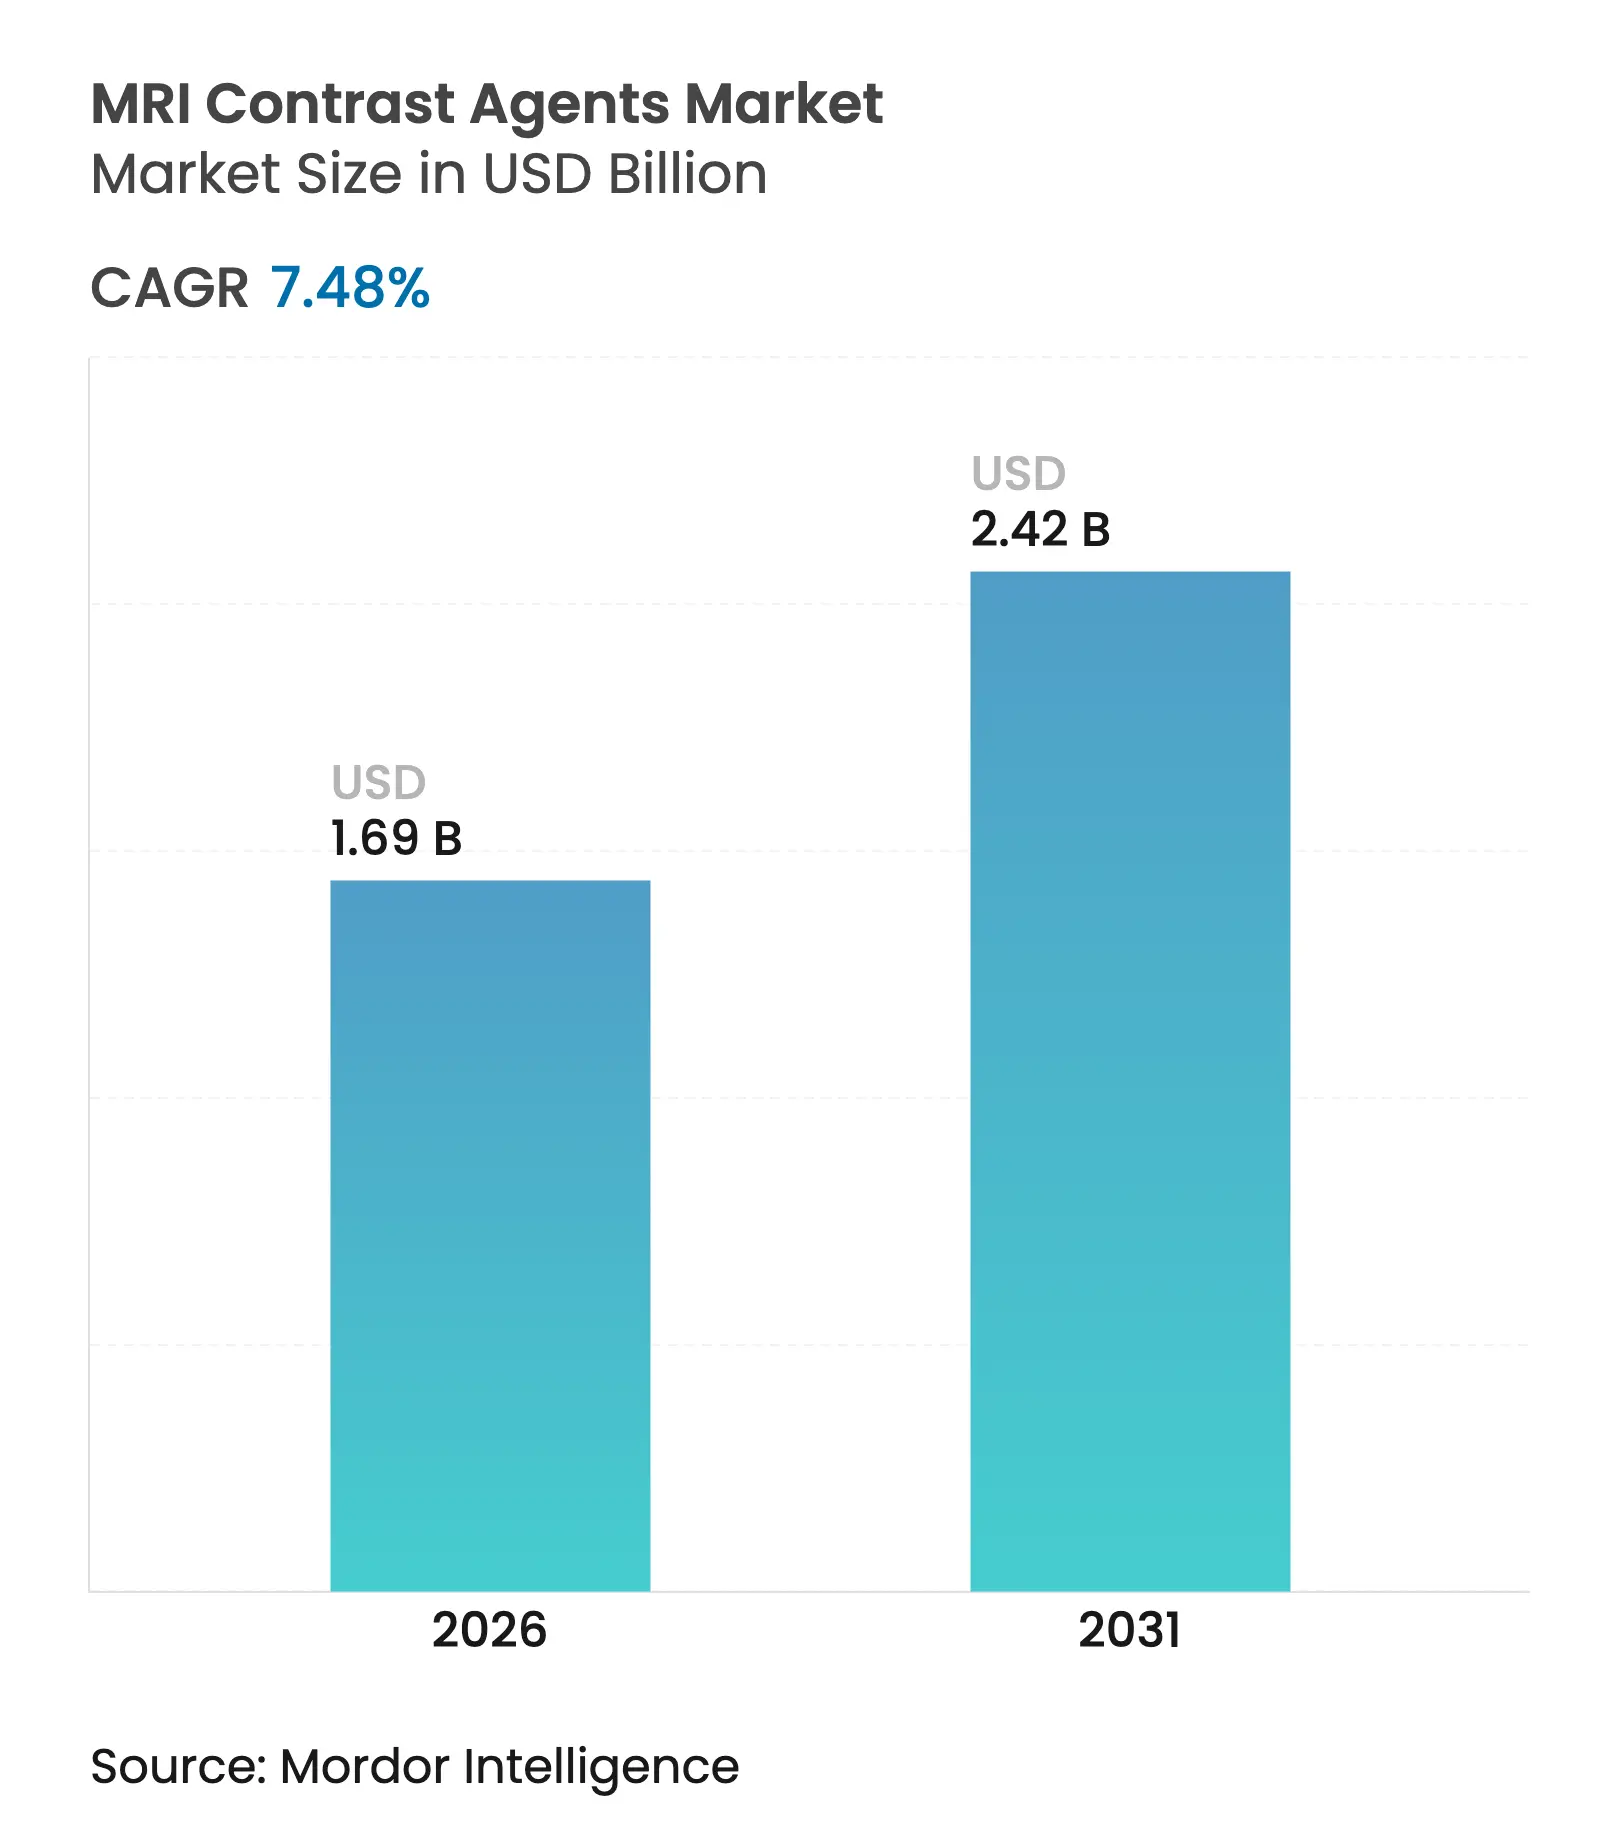
| Market Size (2026) | USD 1.69 Billion |
| Market Size (2031) | USD 2.42 Billion |
| Growth Rate (2026 - 2031) | 7.48 % CAGR |
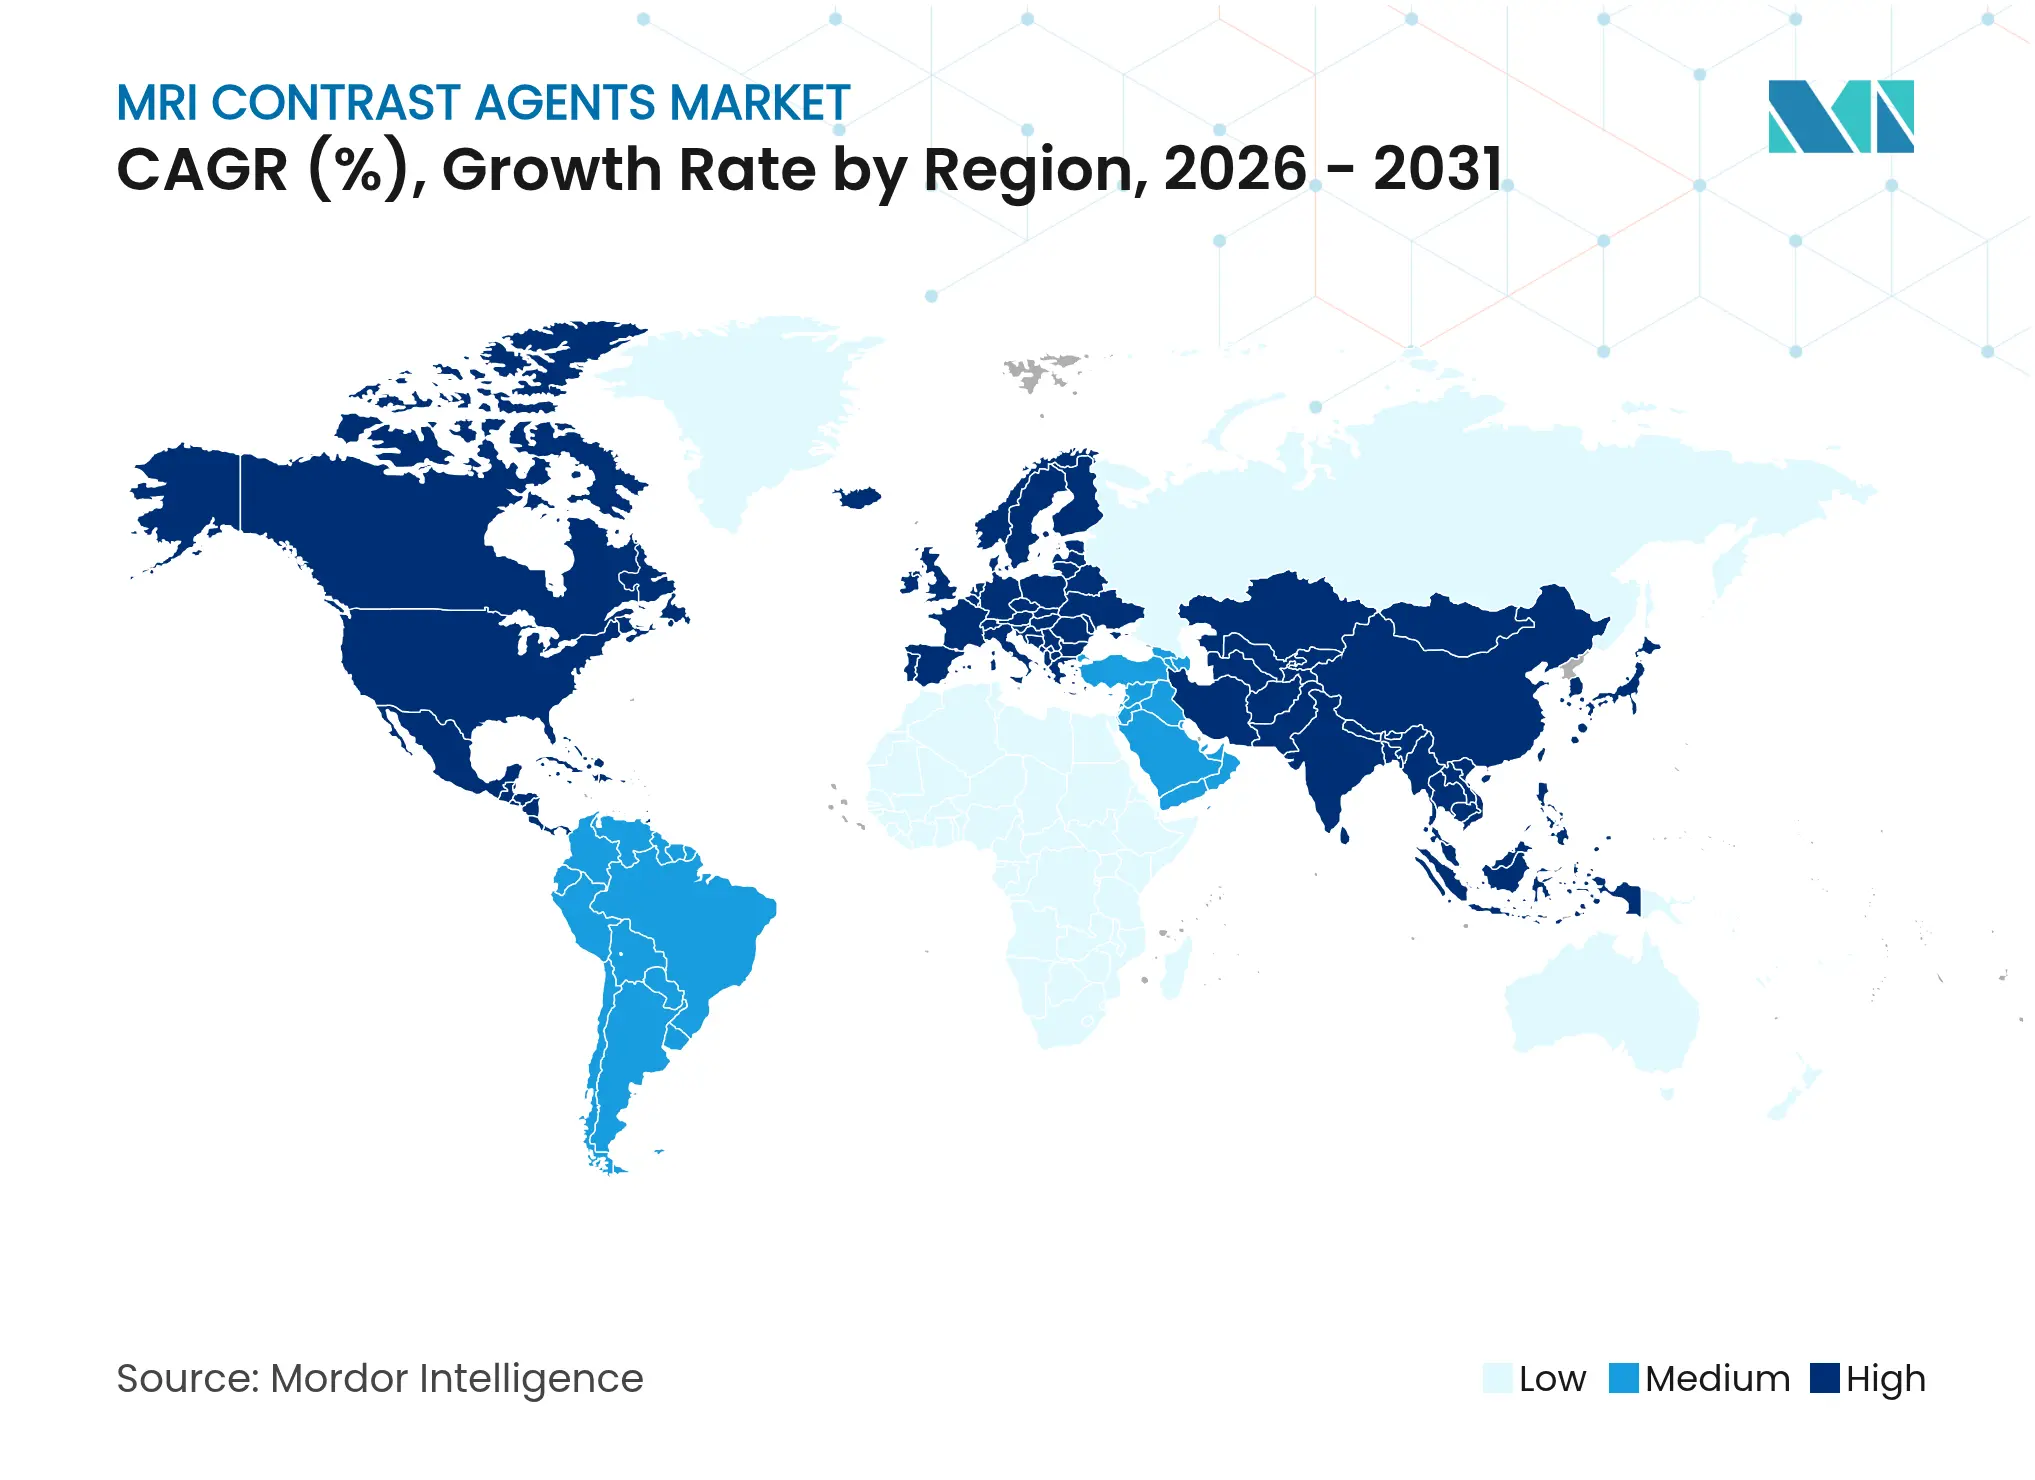
| Fastest Growing Market | Asia Pacific |
| Largest Market | North America |
| Market Concentration | High |
Major Players*Disclaimer: Major Players sorted in no particular order. Image © Mordor Intelligence. Reuse requires attribution under CC BY 4.0. |
MRI Contrast Agents Market Analysis by Mordor Intelligence
The MRI contrast agents market size was valued at USD 1.57 billion in 2025 and estimated to grow from USD 1.69 billion in 2026 to reach USD 2.42 billion by 2031, at a CAGR of 7.48% during the forecast period (2026-2031). Demand expansion stems from the ageing population, broader reimbursement coverage for outpatient scans, and rapid advances in AI-guided dosing protocols that reduce gadolinium exposure without sacrificing diagnostic performance. Manufacturers are redirecting R&D budgets toward macrocyclic high-relaxivity chemistries and manganese-based alternatives to address lingering safety concerns, while regional imaging networks expand their equipment fleets to manage rising procedure volumes. Together, these forces reinforce the shift from volume-based sales to value-based utilization, where precision dosing, patient safety, and environmental sustainability shape competitive advantage.
Key Report Takeaways
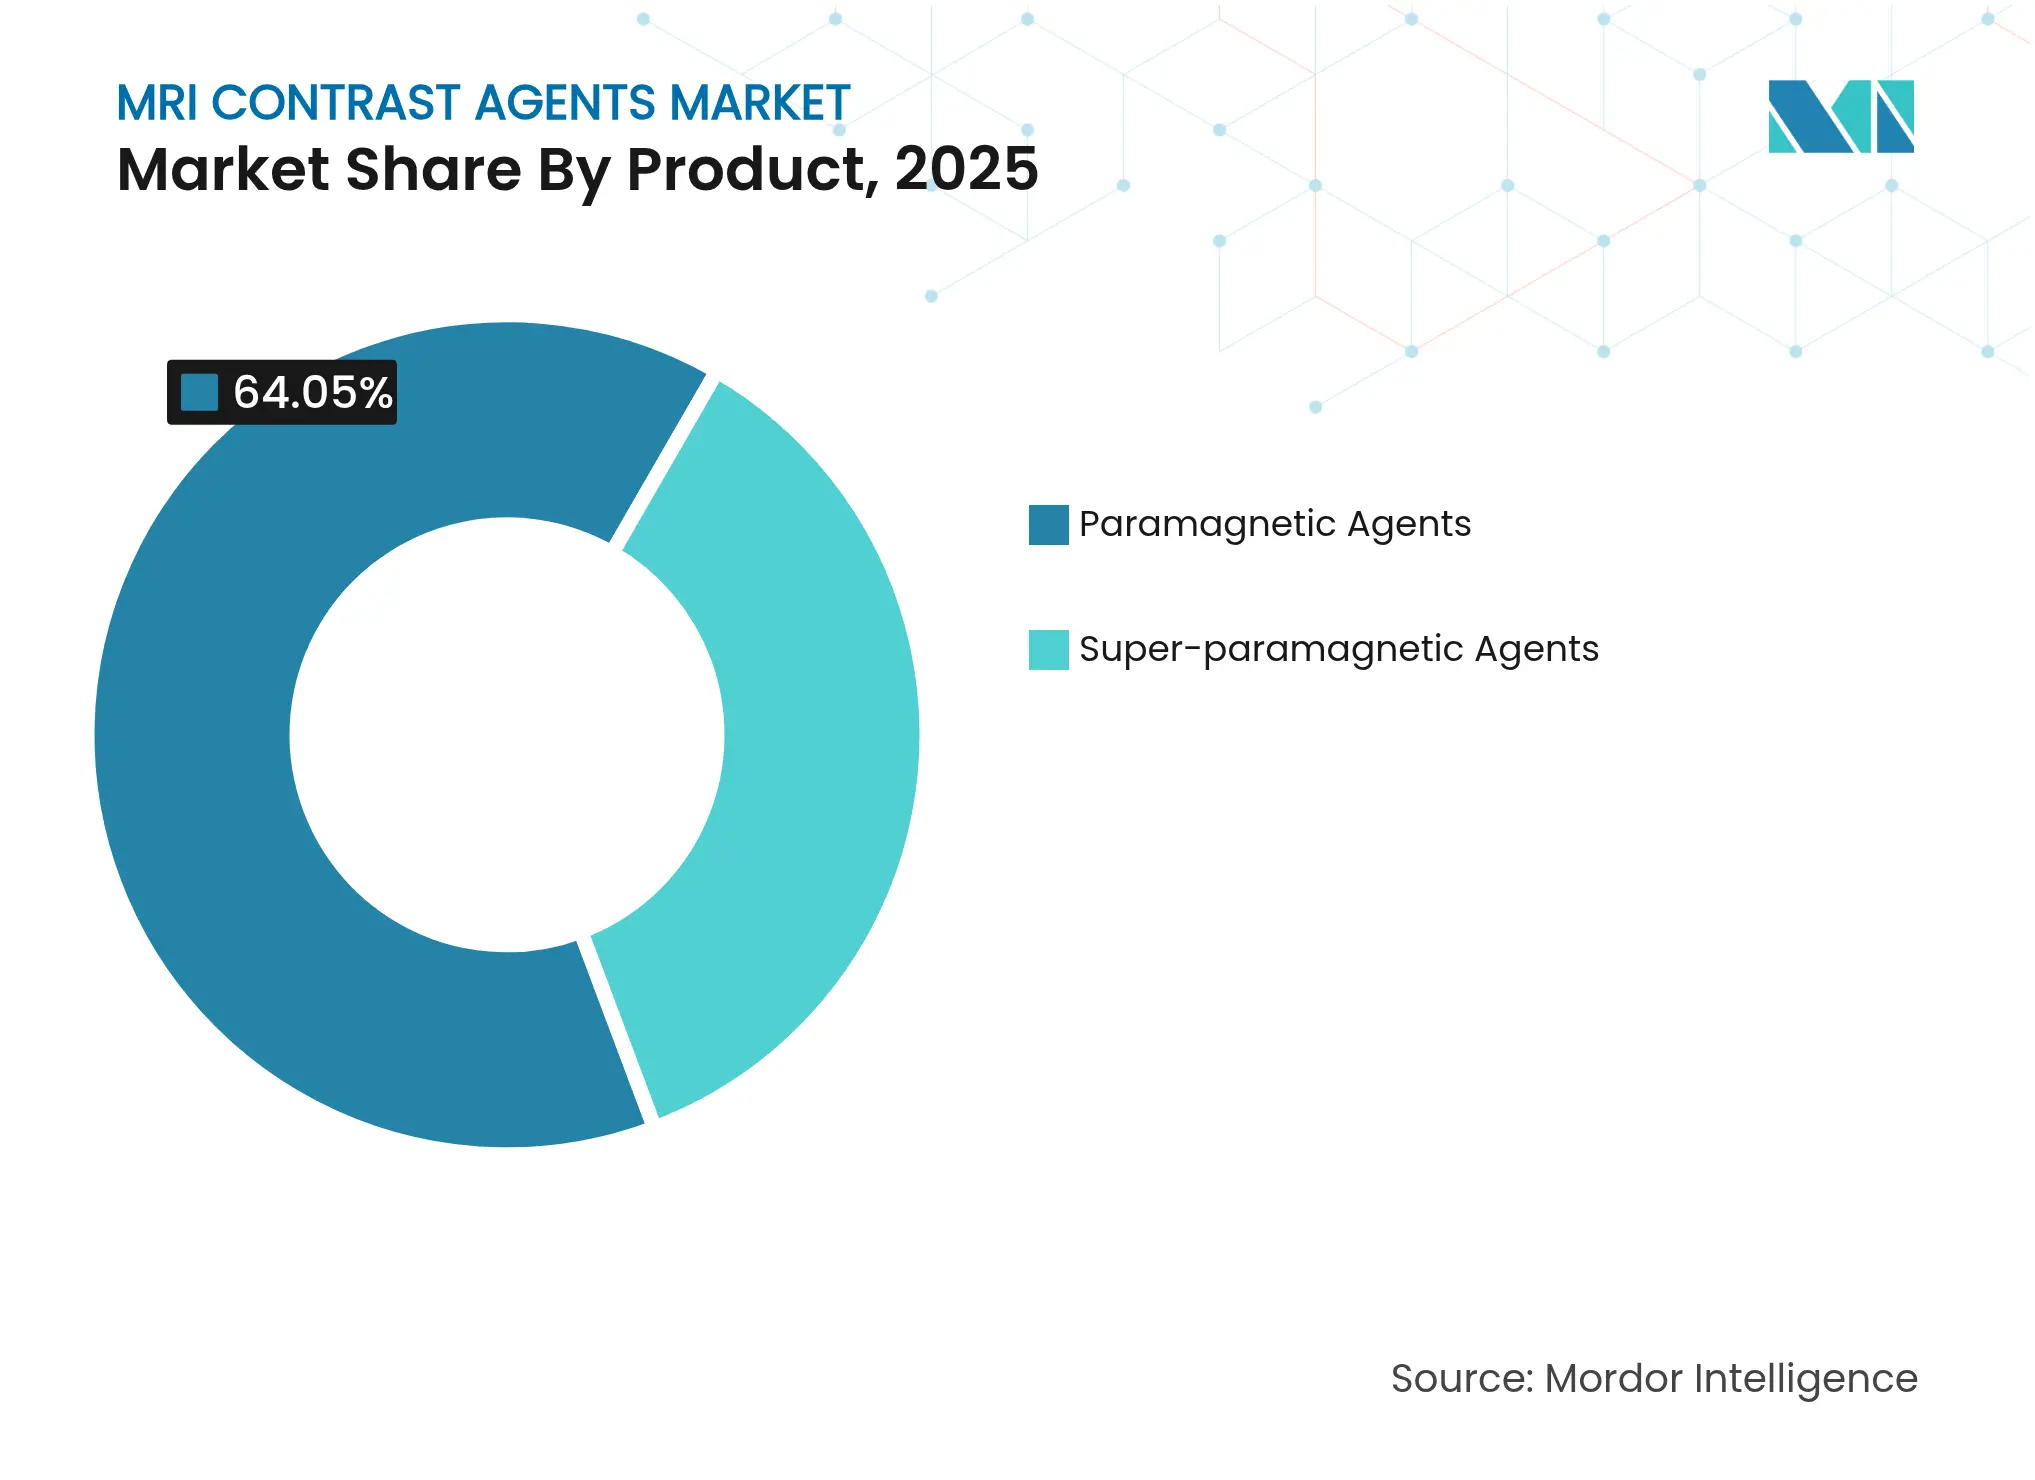
- By product category, paramagnetic agents led with 64.05% revenue share in 2025, while super-paramagnetic agents are projected to expand at a 10.63% CAGR through 2031.
- By type, clinical applications held 71.92% of the MRI contrast agents market share in 2025, whereas pre-clinical uses record the fastest CAGR at 8.88% through 2031.
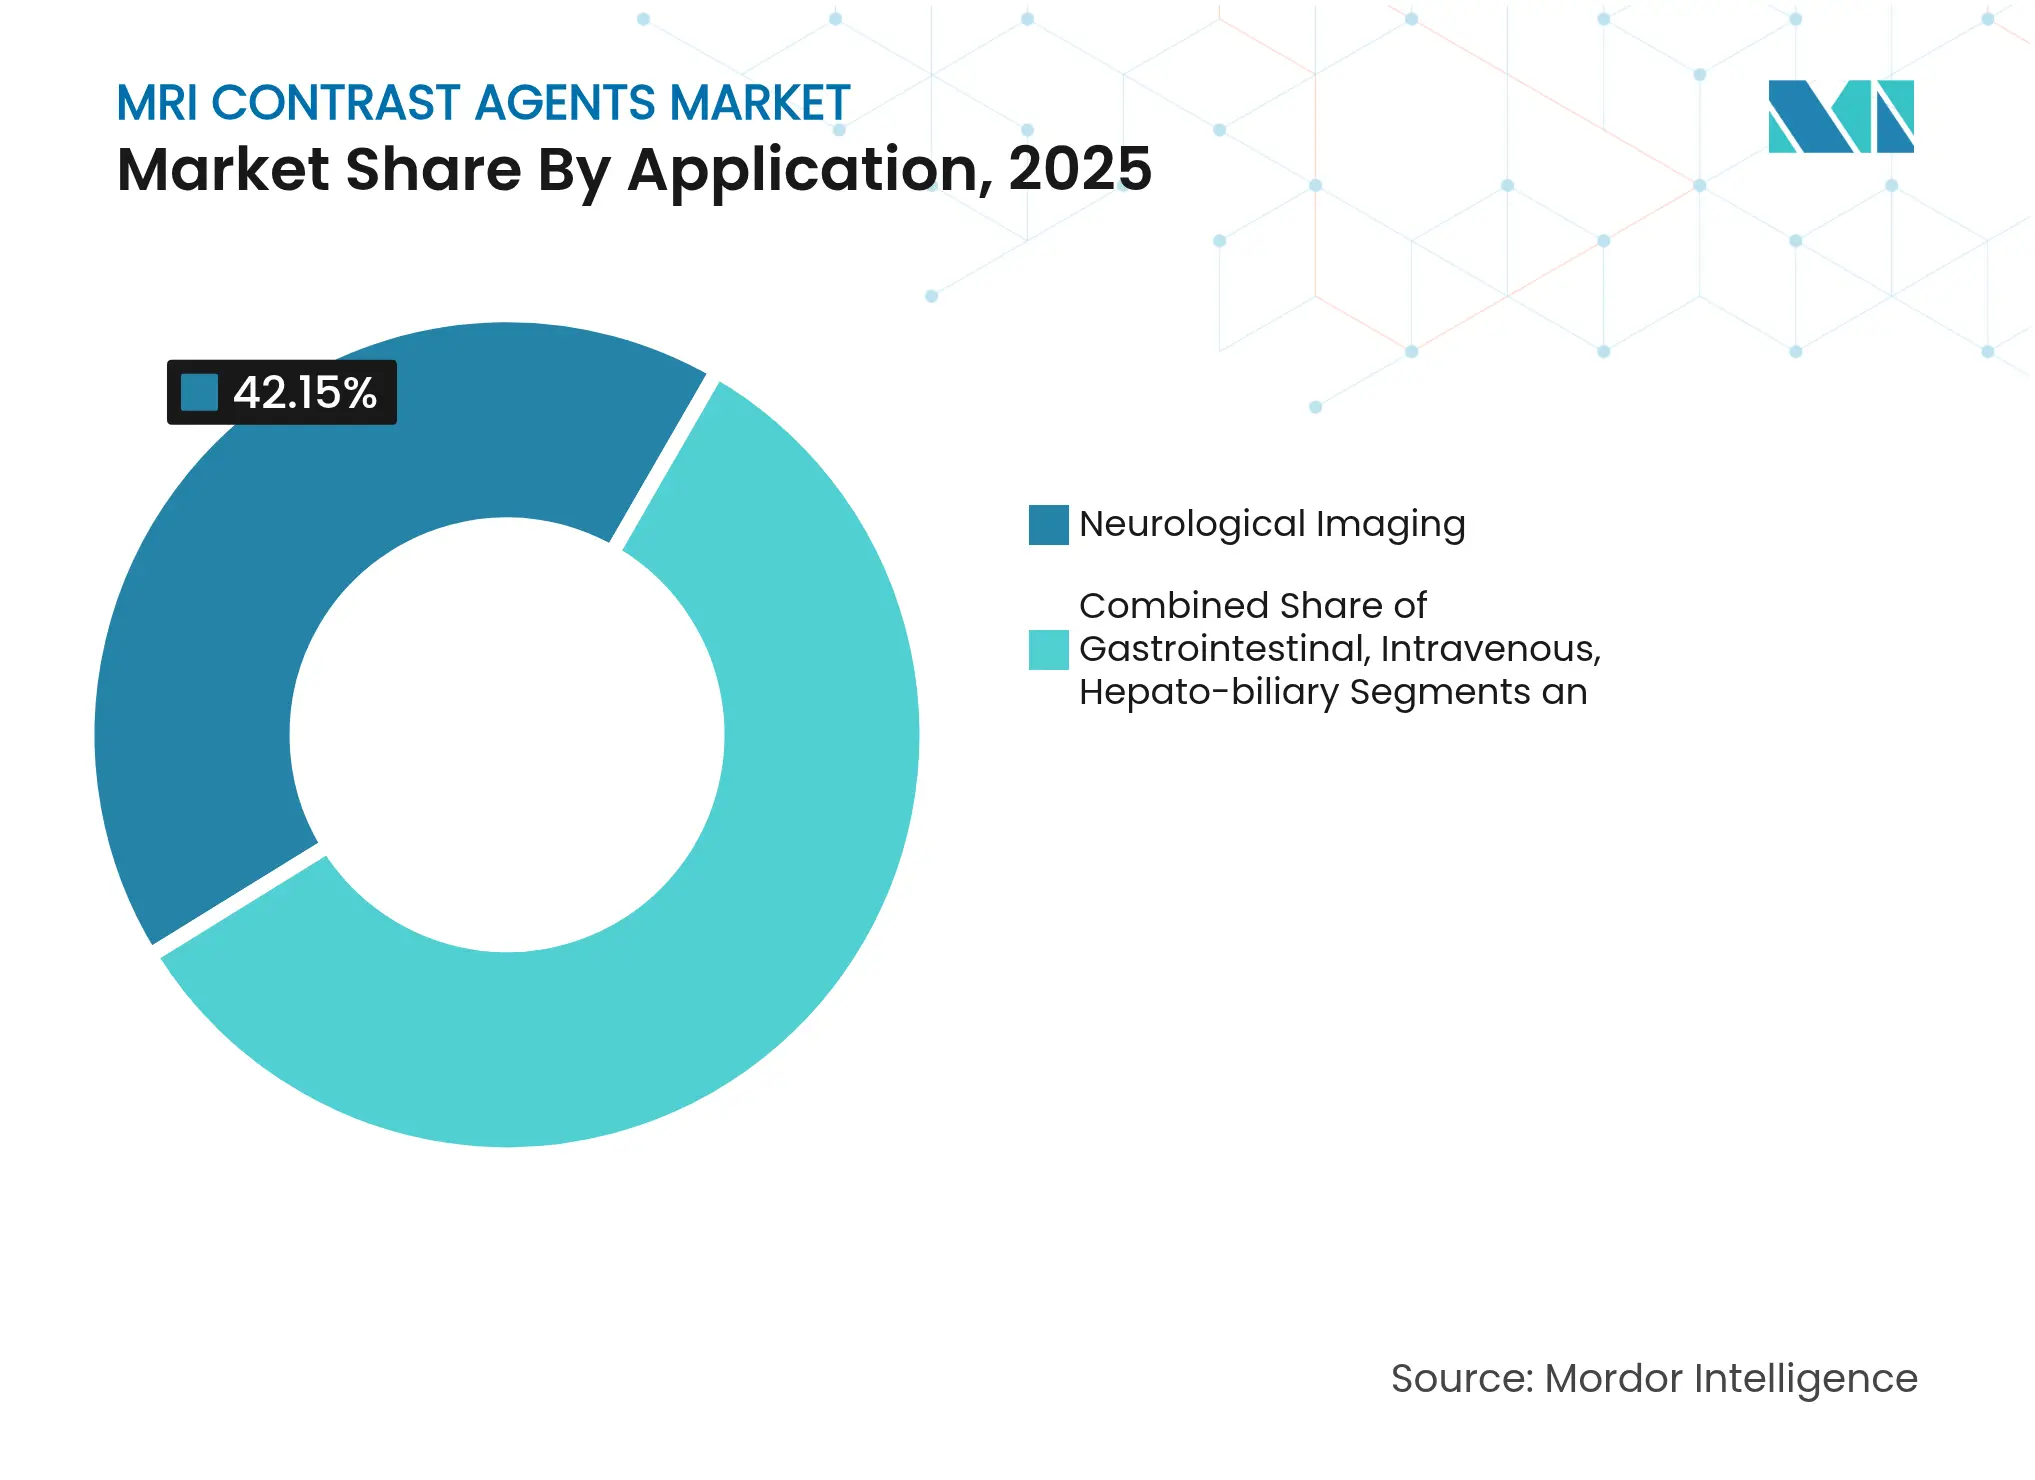
- By application, neurological imaging captured 42.15% share of the MRI contrast agents market size in 2025 and hepato-biliary imaging is growing at a 9.92% CAGR to 2031.
- By end user, hospitals accounted for 57.72% of the MRI contrast agents market size in 2025; research institutes are poised for a 9.21% CAGR through 2031.
- By geography, North America dominated with a 37.85% share in 2025, while Asia-Pacific is set to post the strongest 7.68% CAGR through 2031.
Note: Market size and forecast figures in this report are generated using Mordor Intelligence's proprietary estimation framework, updated with the latest available data and insights as of 2026.
Global MRI Contrast Agents Market Trends and Insights
Drivers Impact Analysis
| Driver | ( ~ ) % Impact on CAGR Forecast | Geographic Relevance | Impact Timeline | |||
|---|---|---|---|---|---|---|
Growing Prevalence Of Chronic Diseases Growing Prevalence Of Chronic Diseases | +1.80% | Global, with highest impact in North America & Europe | Long term (≥ 4 years) | ( ~ ) % Impact on CAGR Forecast:+1.80% | Geographic Relevance:Global, with highest impact in North America & Europe | Impact Timeline:Long term (≥ 4 years) |
Escalating MRI Scan Volumes In Ageing Populations Escalating MRI Scan Volumes In Ageing Populations | +1.50% | Global, concentrated in developed markets | Medium term (2-4 years) | |||
R&D Shift Toward High-Relaxivity Macrocyclic Agents R&D Shift Toward High-Relaxivity Macrocyclic Agents | +1.20% | North America & EU regulatory markets first | Medium term (2-4 years) | |||
Wider Reimbursement For Outpatient MRI Procedures Wider Reimbursement For Outpatient MRI Procedures | +0.90% | North America, expanding to APAC | Short term (≤ 2 years) | |||
Nanoparticle-Based Agents Enabling Ultra-Low Gadolinium Dose Nanoparticle-Based Agents Enabling Ultra-Low Gadolinium Dose | +0.80% | Global, led by research hubs in US & Europe | Long term (≥ 4 years) | |||
AI-Guided Personalised Contrast-Dose Protocols AI-Guided Personalised Contrast-Dose Protocols | +0.70% | Technology-advanced markets initially | Medium term (2-4 years) | |||
| Source: Mordor Intelligence | ||||||
Growing Prevalence of Chronic Diseases
Healthcare systems face mounting cardiovascular and diabetes burdens, prompting greater dependence on contrast-enhanced MRI for early diagnosis and ongoing management. The American Heart Association projects cardiovascular care costs to reach USD 1.49 trillion by 2050, reinforcing sustained procedure demand.[1]American Heart Association, “Cardiovascular disease projections,” heart.org Cardiac MRI, now widely covered by public and private insurers, benefits from macrocyclic gadolinium agents that visualize perfusion and fibrosis in a single session. Recurring follow-up scans secure predictable revenue for suppliers while encouraging investments in ultra-low-dose formulations. Hospitals increasingly treat contrast-enhanced MRI as preventive care that curtails later-stage intervention expenses.
Escalating MRI Scan Volumes in Ageing Populations
Demographic aging in developed economies is set to raise MRI use by 16.9% by 2055, with geriatric radiology protocols tailoring contrast dose to declining renal function. Macrocyclic agents with higher stability profiles replace linear counterparts for stroke and dementia imaging, where elderly patients undergo serial scans. To manage throughput, outpatient networks install extra 3 T systems and remote-controlled injectors, reinforcing the MRI contrast agents market’s structural growth.
R&D Shift toward High-Relaxivity Macrocyclic Agents
Pharma pipelines favour agents that deliver equivalent image quality at smaller gadolinium loads. Bayer’s gadoquatrane Phase III results show 60% dose reduction with maintained efficacy. GE HealthCare’s manganese-based candidate broadens chemistry options and may remove rare-earth metals from formulations. Higher relaxivity aligns with tightening European disposal rules and U.S. sustainability targets, giving innovators a regulatory head-start.
Wider Reimbursement for Outpatient MRI Procedures
Despite a 2.83% cut in the 2025 U.S. conversion factor, CMS kept coverage for key contrast-enhanced studies, acknowledging their cost-saving impact on downstream care. Private payers mirror this stance, especially for oncology and cardiology pathways that rely on early imaging. Improved reimbursement visibility accelerates site-of-service shifts to specialized imaging centres and bolsters the MRI contrast agents market.
Restraints Impact Analysis
| Restraint | ( ~ ) % Impact on CAGR Forecast | Geographic Relevance | Impact Timeline | |||
|---|---|---|---|---|---|---|
Adverse Events & Gadolinium Deposition Concerns Adverse Events & Gadolinium Deposition Concerns | -1.40% | Global, with heightened scrutiny in EU & US | Short term (≤ 2 years) | ( ~ ) % Impact on CAGR Forecast:-1.40% | Geographic Relevance:Global, with heightened scrutiny in EU & US | Impact Timeline:Short term (≤ 2 years) |
Stringent Multi-Regional Regulatory Approvals Stringent Multi-Regional Regulatory Approvals | -1.10% | Global, most complex in US, EU, and Japan | Medium term (2-4 years) | |||
Supply-Chain Risk In Rare-Earth (Gadolinium) Sourcing Supply-Chain Risk In Rare-Earth (Gadolinium) Sourcing | -0.90% | Global, with highest impact in non-China markets | Long term (≥ 4 years) | |||
Growing Adoption Of Non-Contrast MRI Techniques Growing Adoption Of Non-Contrast MRI Techniques | -0.80% | Technology-advanced markets initially | Medium term (2-4 years) | |||
| Source: Mordor Intelligence | ||||||
Adverse Events & Gadolinium Deposition Concerns
Long-term tissue retention studies show gadolinium clears more slowly than earlier believed, prompting FDA coding for gadolinium deposition disease. Linear agents exhibit symptom links in up to 24% of cases, intensifying migration to macrocyclic formulations. Hospitals introduce stricter screening and consent processes, slightly dampening contrast volumes in borderline clinical scenarios. R&D teams race to deliver gadolinium-free or chelatable alternatives to reassure clinicians and regulators alike.
Growing Adoption of Non-Contrast MRI Techniques
AI-based reconstruction and deep-learning synthesis now generate vascular and soft-tissue detail without exogenous agents, shortening scan times and eliminating infusion risks.[2]Radiology: Artificial Intelligence, “AI reconstruction for contrast-free imaging,” radiology-ai.rsna.orgEarly oncology trials confirm that abbreviated non-contrast liver protocols rival contrast MRI for colorectal metastasis detection.[3]Insights Imaging, “Abbreviated liver MRI without contrast,” insights-imaging.org Cardiac perfusion measurement methods that leverage native-T1 mapping further erode reliance on gadolinium. While these approaches mainly roll out in top-tier centres, they pressure suppliers to prove added value beyond basic enhancement.
Segment Analysis
By Product: Super-paramagnetic Innovation Challenges Paramagnetic Dominance
Paramagnetic agents sustained a 64.05% share of the MRI contrast agents market in 2025, buoyed by decades of regulatory endorsement and entrenched clinical routines. The corresponding MRI contrast agents market size contribution for paramagnetic agents is projected to climb at a modest 6.06% CAGR to 2031. Super-paramagnetic iron-oxide nanoparticles, though niche today, are forecast to register a 10.63% CAGR, targeting lymph-node staging and microthrombi detection where their sensitivity at 7 T scanners uncovers lesions under 2.5 mm.
Regulatory hurdles remain higher for super-paramagnetic chemistries because their nanoparticle behavior requires extended toxicology reviews. Yet the first FDA endorsements signal growing familiarity, paving the path toward broader clinical uptake. Manufacturers with iron-oxide pipelines partner with academic stroke consortia to gather real-world evidence, positioning themselves to capture incremental MRI contrast agents market share once guidelines endorse routine cerebrovascular use. Paramagnetic producers concurrently invest in macrocyclic upgrades and multi-dose vial configurations to defend incumbency.Continued dominance by paramagnetics also reflects entrenched procurement systems and radiologist comfort levels. Large hospital chains negotiate multi-year supply contracts that bundle injectors, disposables, and technical support, creating switching frictions. However, super-paramagnetic agents’ disease-focused performance―particularly in sentinel-node biopsies and plaque characterization―presents a credible route to selective replacement, rather than wholesale displacement, over the forecast horizon.
Note: Segment shares of all individual segments available upon report purchase
By Type: Pre-clinical Surge Reflects Research Investment Boom
Clinical imaging consumed 71.92% of the MRI contrast agents market size in 2025, owing to high-volume neurological, oncological, and musculoskeletal scans in routine care. Pre-clinical applications, while representing a smaller revenue pool, are on track for a 8.88% CAGR, supported by pharmaceutical proof-of-concept studies and NIH-funded brain-mapping initiatives. The MRI contrast agents market share for pre-clinical use is expected to edge toward 29.35% by 2031 as translational research pipelines lengthen.
Academic-industry alliances accelerate novel biomarker validation using small-animal MRI, expanding demand for specialized probes unreachable under current clinical regulations. Flexible toxicology thresholds permit experimentation with manganese, fluorine, and organic radical formulations. Vendors cater to this segment with micro-dose packaging, custom relaxometry data, and on-site application scientists. In parallel, contract-research organizations incorporate contrast-enhanced MRI endpoints into oncology and gene-therapy programs, reinforcing steady shipment flows.On the clinical side, tightening reimbursement pushes radiology groups to refine dosing algorithms that stretch vial inventory without compromising diagnostic confidence. AI-driven protocol engines suggest patient-specific volumes based on weight, renal function, and imaging sequence, elevating the MRI contrast agents market’s emphasis on precision rather than quantity.
By Application: Hepato-biliary Imaging Outpaces Traditional Neurological Focus
Neurological studies retained 42.15% of the MRI contrast agents market share in 2025, thanks to rising dementia prevalence, stroke triage requirements, and the established role of gadolinium in multiple-sclerosis follow-up. Hepato-biliary protocols are expanding fastest, posting a 9.92% CAGR as liver-disease incidence climbs. The MRI contrast agents market size associated with hepato-biliary imaging is projected to reach USD 373.68 million by 2031, underpinned by gadoxetic-acid agents that combine dynamic angiography and hepatocyte function assessment in one session.
Liver-focused agents enable precise differentiation of benign versus malignant lesions, guiding transplant candidacy and surgical planning. Emerging guidelines from Asia-Pacific hepatology societies recommend contrast-enhanced MRI as first-line work-up for suspected hepatocellular carcinoma, fuelling regional demand. Conversely, neuro protocols evolve toward higher-field magnets and zero-echo acquisitions, prompting vendors to fine-tune relaxivity profiles for 7 T systems.Musculoskeletal and gastrointestinal applications remain stable but generate incremental opportunities as sports-medicine clinics and emergency departments pursue faster throughput with single-dose macrocyclic options. Cardiac imaging benefits from phase-resolved myocardial perfusion techniques, though it competes with CT for coronary evaluation.
Note: Segment shares of all individual segments available upon report purchase
By End User: Research Institutes Drive Academic-Industry Collaboration
Hospitals accounted for 57.72% of 2025 volumes, protected by centralized purchasing power and integrated care pathways. Research institutes, however, will lead growth at 9.21% CAGR as grant funding targets precision-medicine biomarkers. These centres buy dedicated small-animal systems and hyperpolarized upgrades, expanding the MRI contrast agents market beyond routine diagnostic use.Outpatient imaging networks form the second-largest buyer group, leveraging evening appointments and price transparency to siphon scans from hospital radiology. They adopt cloud-connected injectors that capture data for payer audits, tightening operational control. Veterinary oncology and industrial materials testing form a niche but rising cluster, especially in North America, where pet insurance penetration climbs.
Inter-segment collaboration flourishes: pharmaceutical sponsors fund academic scanners, while teaching hospitals license AI algorithms to retail imaging chains. This ecosystem feeds continuous demand for advanced agents, sustaining shipment diversity across vial sizes and chemistries.
Geography Analysis
North America retained 37.85% of global revenue in 2025, cemented by large installed MRI bases, high procedure reimbursement, and brisk uptake of high-relaxivity entrants such as gadopiclenol. The region’s MRI contrast agents market size is forecast to grow at a steady 6.49% CAGR, buoyed by outpatient site expansion and value-based care programs that reward early oncology detection.Europe follows with balanced growth under stringent environmental guidelines that restrict gadolinium discharge. Disposal-fee pressures stimulate hospital adoption of macrocyclic-low-dose protocols and recovery units that extract rare-earth metals for recycling. Regulatory alignment across EMA and national agencies offers a single approval route but demands extensive pharmacovigilance, favouring suppliers with robust surveillance infrastructure.
Asia-Pacific leads growth at 7.68% CAGR, driven by China’s public-hospital modernization and India’s private imaging-chain rollouts. Rising middle-class coverage under national insurance schemes lifts scan volumes, while governments fast-track high-field scanner imports. Local suppliers focus on single-use pre-filled syringes to curb dosing errors where nurse-to-patient ratios are high. Japan’s ageing demographics further reinforce procedure demand, especially for neurodegenerative disorders. Latin America and the Middle East & Africa trail but display emerging acceleration as public-private partnerships finance diagnostic hubs. These projects often leapfrog to 3 T systems bundled with automated injectors, skipping legacy 1.5 T fleets. Vendors offering sterilizable accessories and remote servicing edge ahead in these cost-sensitive settings.

Competitive Landscape
Market Concentration
The MRI contrast agents market remains moderately concentrated: the five largest companies account for roughly 68% of sales, leaving room for niche disruptors. Bayer, GE HealthCare, and Bracco leverage global distribution and established pharmacovigilance systems to protect incumbency. Bracco’s milestone of 1 million Vueway injections across 480 sites illustrates swift adoption when safety and relaxivity dovetail with operational efficiency.
Strategic alliances deepen competitive moats. Siemens Healthineers partners with Bayer to link MR consoles to smart injectors that auto-modulate dose per sequence, embedding contrast loyalty into hardware ecosystems. GE HealthCare targets white-space through manganese and zinc chemistries aimed at patients with severe renal impairment. Start-ups pursue organic radical and nanoparticle platforms that eliminate gadolinium entirely, pitching zero-deposition benefits. Academic spin-outs secure seed funding to translate animal data into first-in-human trials, pressuring incumbents to broaden portfolios. Midsized generic manufacturers chase price-driven tenders in Asia and Latin America, where regulatory entry barriers are lower.
Regulatory shifts spur capacity investments: Bracco allocates USD 86 million to triple Swiss output, ensuring supply redundancy as demand for high-relaxivity agents mounts. Bayer upgrades German facilities with closed-loop solvent-recovery systems to meet EU discharge caps. Overall, success hinges on proving clinical superiority while navigating tighter environmental and pharmacovigilance expectations.
MRI Contrast Agents Industry Leaders

*Disclaimer: Major Players sorted in no particular order
Recent Industry Developments
- January 2025: Bayer announced positive Phase III data for gadoquatrane, showing 60% gadolinium-dose reduction with comparable efficacy; filings in major markets will follow QUANTI-CNS trial completion.
- November 2024: Bracco Diagnostics surpassed 1 million gadopiclenol injections across 480 sites, underscoring market acceptance of high-relaxivity agents.
- October 2024: GE HealthCare completed Phase I trials of its macrocyclic manganese-based agent with no serious adverse events.
- September 2024: FDA approved Elucirem (gadopiclenol) for patients aged ≥ 2 years, enabling reduced gadolinium exposure in routine MRI.
Table of Contents for MRI Contrast Agents Industry Report
1. Introduction
- 1.1Study Assumptions & Market Definition
- 1.2Scope of the Study
2. Research Methodology
3. Executive Summary
4. Market Landscape
- 4.1Market Overview
- 4.2Market Drivers
- 4.2.1Growing Prevalence Of Chronic Diseases
- 4.2.2Escalating MRI Scan Volumes In Ageing Populations
- 4.2.3R&D Shift Toward High-Relaxivity Macrocyclic Agents
- 4.2.4Wider Reimbursement For Outpatient MRI Procedures
- 4.2.5Nanoparticle-Based Agents Enabling Ultra-Low Gadolinium Dose
- 4.2.6AI-Guided Personalised Contrast-Dose Protocols
- 4.3Market Restraints
- 4.3.1Adverse Events & Gadolinium Deposition Concerns
- 4.3.2Stringent Multi-Regional Regulatory Approvals
- 4.3.3Supply-Chain Risk In Rare-Earth (Gadolinium) Sourcing
- 4.3.4Growing Adoption Of Non-Contrast MRI Techniques
- 4.4Supply-Chain Analysis
- 4.5Regulatory Landscape
- 4.6Technological Outlook
- 4.7Porter's Five Forces Analysis
- 4.7.1Bargaining Power of Suppliers
- 4.7.2Bargaining Power of Buyers
- 4.7.3Threat of New Entrants
- 4.7.4Threat of Substitutes
- 4.7.5Intensity of Competitive Rivalry
5. Market Size & Growth Forecasts (Value)
- 5.1By Product
- 5.1.1Super-paramagnetic Agents
- 5.1.2Paramagnetic Agents
- 5.2By Type
- 5.2.1Clinical
- 5.2.2Pre-clinical
- 5.3By Application
- 5.3.1Gastrointestinal
- 5.3.2Intravenous
- 5.3.3Hepato-biliary
- 5.3.4Neurological Imaging
- 5.3.5Other Applications
- 5.4By End-Use
- 5.4.1Hospitals
- 5.4.2Diagnostic & Imaging Centres
- 5.4.3Research Institutes
- 5.4.4Other End-users
- 5.5Geography
- 5.5.1North America
- 5.5.1.1United States
- 5.5.1.2Canada
- 5.5.1.3Mexico
- 5.5.2Europe
- 5.5.2.1Germany
- 5.5.2.2United Kingdom
- 5.5.2.3France
- 5.5.2.4Italy
- 5.5.2.5Spain
- 5.5.2.6Rest of Europe
- 5.5.3Asia Pacific
- 5.5.3.1China
- 5.5.3.2Japan
- 5.5.3.3India
- 5.5.3.4South Korea
- 5.5.3.5Australia
- 5.5.3.6Rest of Asia Pacific
- 5.5.4Middle East & Africa
- 5.5.4.1GCC
- 5.5.4.2South Africa
- 5.5.4.3Rest of Middle East & Africa
- 5.5.5South America
- 5.5.5.1Brazil
- 5.5.5.2Argentina
- 5.5.5.3Rest of South America
6. Competitive Landscape
- 6.1Market Concentration
- 6.2Market Share Analysis
- 6.3Company Profiles (includes Global level Overview, Market level overview, Core Segments, Financials as available, Strategic Information, Market Rank/Share, Products, and Recent Developments)
- 6.3.1Bayer AG
- 6.3.2GE HealthCare
- 6.3.3Bracco Imaging SpA
- 6.3.4Guerbet SA
- 6.3.5Canon Medical Systems Corp.
- 6.3.6Lantheus Holdings Inc.
- 6.3.7Miltenyi Biotec
- 6.3.8Jiangsu Hengrui Pharma
- 6.3.9Beijing Beilu Pharmaceutical
- 6.3.10Subhra Pharma
- 6.3.11JB Pharma Ltd.
- 6.3.12Trivitron Healthcare (Kiran)
- 6.3.13Livealth Biopharma
- 6.3.14NanoScan Imaging
- 6.3.15NanoPET Pharma
- 6.3.16Ferentis Pharma
- 6.3.17Clariant AG (Medical-grade iron oxides)
- 6.3.18Unijules LifeSciences
- 6.3.19Elucida Oncology
- 6.3.20Magnetic Insight Inc.
- 6.3.21Curium Pharma
7. Market Opportunities & Future Outlook
- 7.1White-space & Unmet-need Assessment
Research Methodology Framework and Report Scope
Market Definitions and Key Coverage
Segmentation Overview
- By Product
- Super-paramagnetic Agents
- Paramagnetic Agents
- Super-paramagnetic Agents
- By Type
- Clinical
- Pre-clinical
- Clinical
- By Application
- Gastrointestinal
- Intravenous
- Hepato-biliary
- Neurological Imaging
- Other Applications
- Gastrointestinal
- By End-Use
- Hospitals
- Diagnostic & Imaging Centres
- Research Institutes
- Other End-users
- Hospitals
- Geography
- North America
- United States
- Canada
- Mexico
- United States
- Europe
- Germany
- United Kingdom
- France
- Italy
- Spain
- Rest of Europe
- Germany
- Asia Pacific
- China
- Japan
- India
- South Korea
- Australia
- Rest of Asia Pacific
- China
- Middle East & Africa
- GCC
- South Africa
- Rest of Middle East & Africa
- GCC
- South America
- Brazil
- Argentina
- Rest of South America
- Brazil
- North America
Detailed Research Methodology and Data Validation
Primary Research
Desk Research
Market-Sizing & Forecasting
Data Validation & Update Cycle
Why Mordor's MRI Contrast Agents Baseline Earns Stakeholder Trust
Benchmark comparison
| Market Size | Anonymized source | Primary gap driver | ||
|---|---|---|---|---|
USD 1.57 B (2025) | Mordor Intelligence | Anonymized source:Mordor Intelligence | Primary gap driver: | |
USD 2.50 B (2024) | Global Consultancy A | Bundles CT and hybrid agents, relies only on hospital purchase data | ||
USD 2.11 B (2023) | Trade Journal B | Uses simple sales trends, ignores per-scan dose decline | ||
USD 1.56 B (2024) | Industry Publisher C | Omits emerging manganese and iron oxide formats, applies single-variable forecast |