Brain Tumor Therapeutics Market Size and Share
Market Overview
| Study Period | 2020 - 2031 |
|---|---|
| Market Size (2026) | USD 3.42 Billion |
| Market Size (2031) | USD 4.87 Billion |
| Growth Rate (2026 - 2031) | 7.35% CAGR |
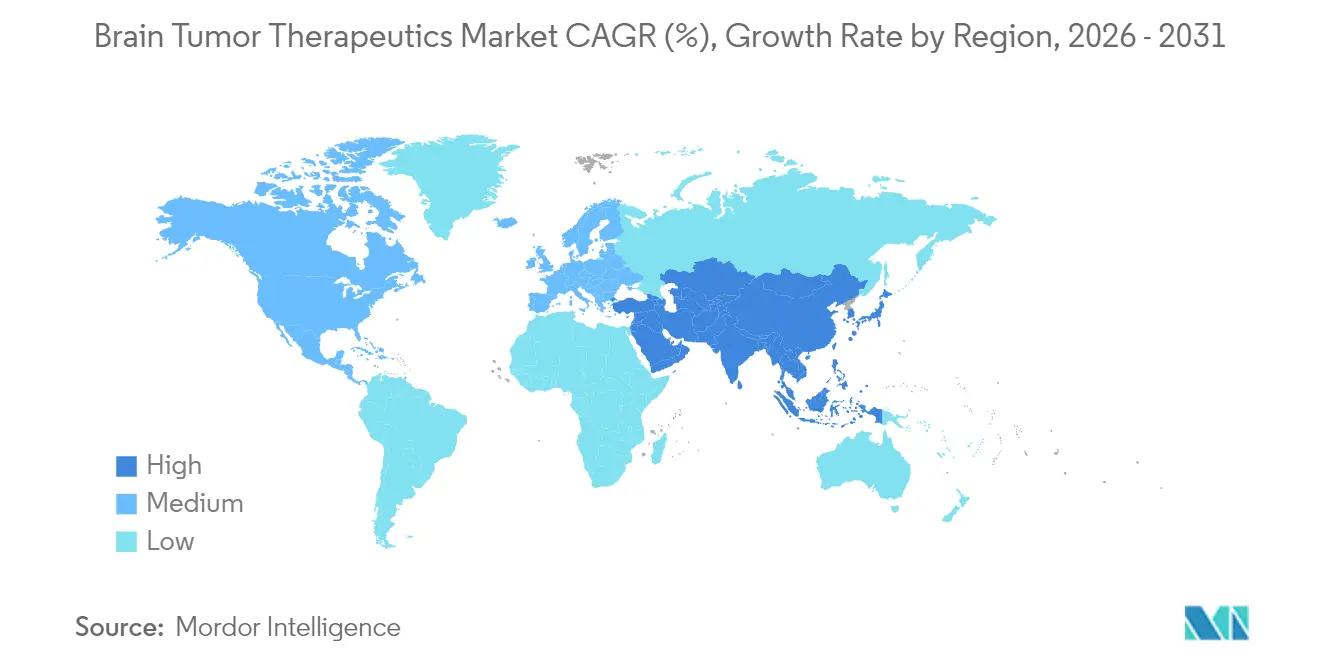
| Fastest Growing Market | Asia Pacific |
| Largest Market | North America |
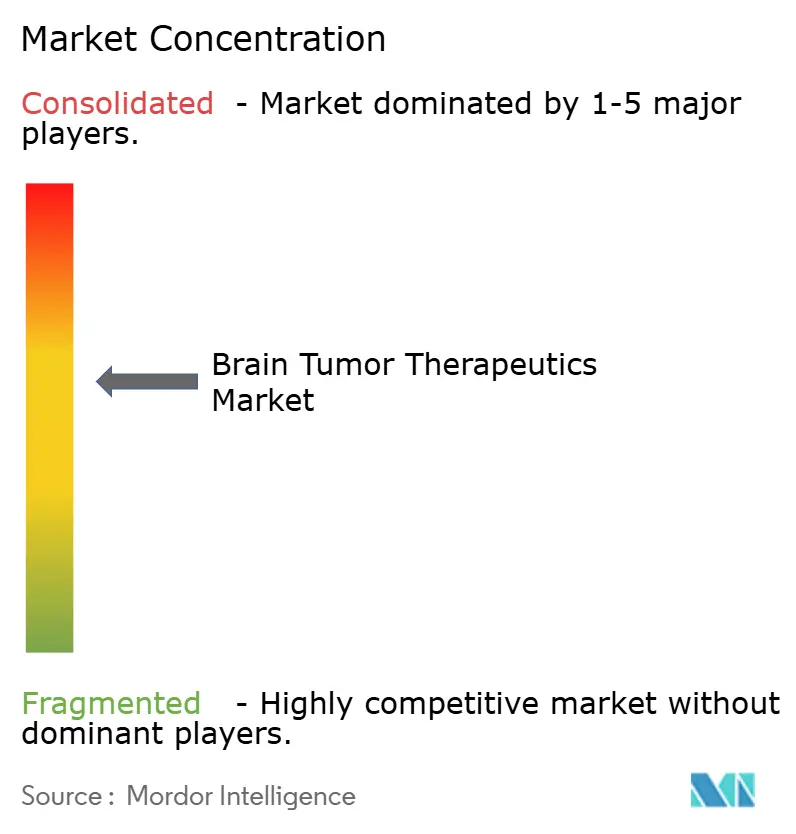
| Market Concentration | Medium |
Major Players *Disclaimer: Major Players sorted in no particular order Image © Mordor Intelligence. Reuse requires attribution under CC BY 4.0. | |
Brain Tumor Therapeutics Market Analysis by Mordor Intelligence
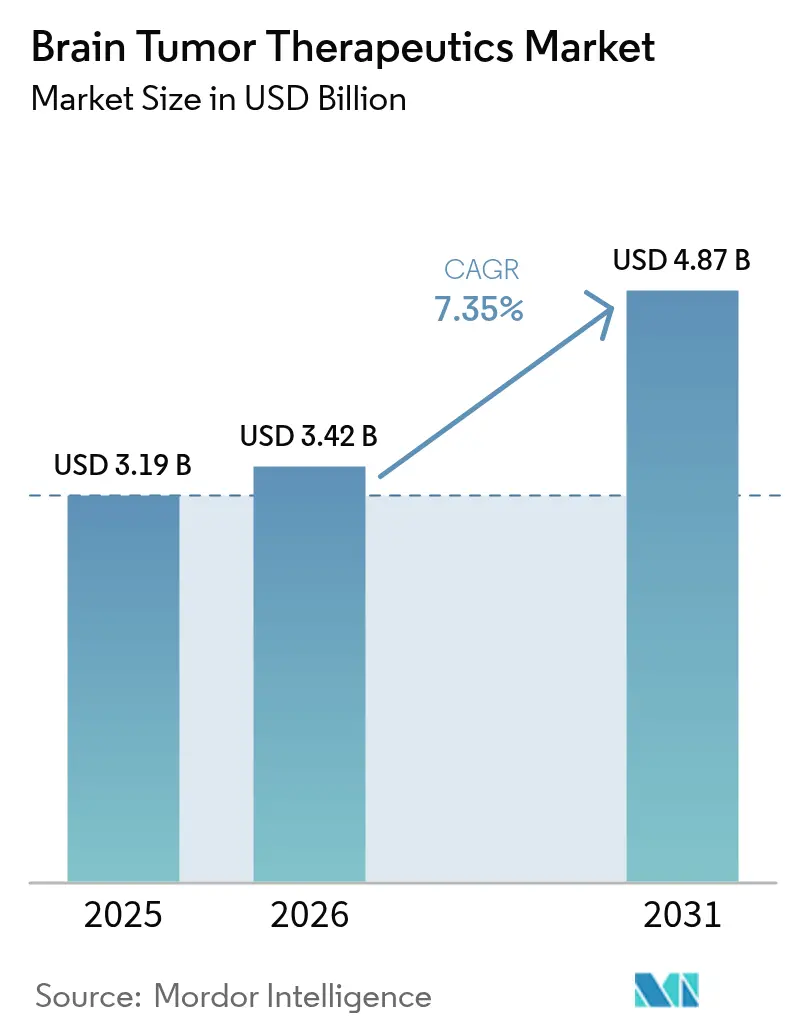
The brain tumor therapeutics market size is expected to grow from USD 3.19 billion in 2025 to USD 3.42 billion in 2026 and is forecast to reach USD 4.87 billion by 2031 at 7.35% CAGR over 2026-2031. Robust growth reflects the convergence of precision-medicine breakthroughs, fast-track approvals, and a steady pipeline of late-stage assets that shorten the bench-to-bedside journey. The commercial roll-out of Boron Neutron Capture Therapy (BNCT) alongside AI-enabled drug-repurposing tools is shifting therapeutic expectations, particularly for glioma and other high-grade tumors. Intravenous regimens still dominate clinical practice because they allow tight pharmacokinetic control, yet oral targeted agents are gaining traction as blood–brain barrier solutions improve. Investors continue to funnel record sums into neuro-oncology, with large biopharma groups allocating more than USD 53 billion to neurological assets in the past two years. However, radio-isotope supply chain disruptions and elevated therapy costs temper near-term momentum.
Key Report Takeaways
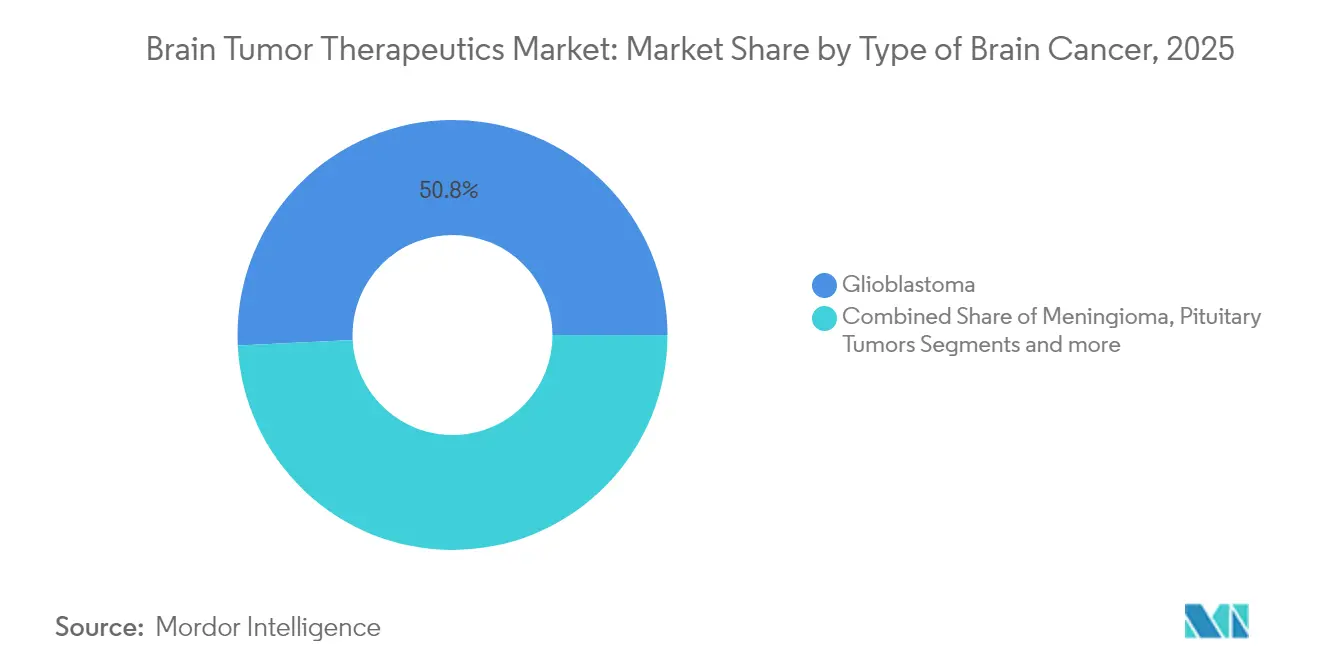
- By cancer type, glioblastoma led with 50.78% of brain tumor therapeutics market share in 2025, while it is also poised for the fastest 8.02% CAGR through 2031.
- By therapy, immunotherapy held 32.10% revenue share in 2025; targeted small-molecule treatments are projected to post the highest 8.10% CAGR to 2031.
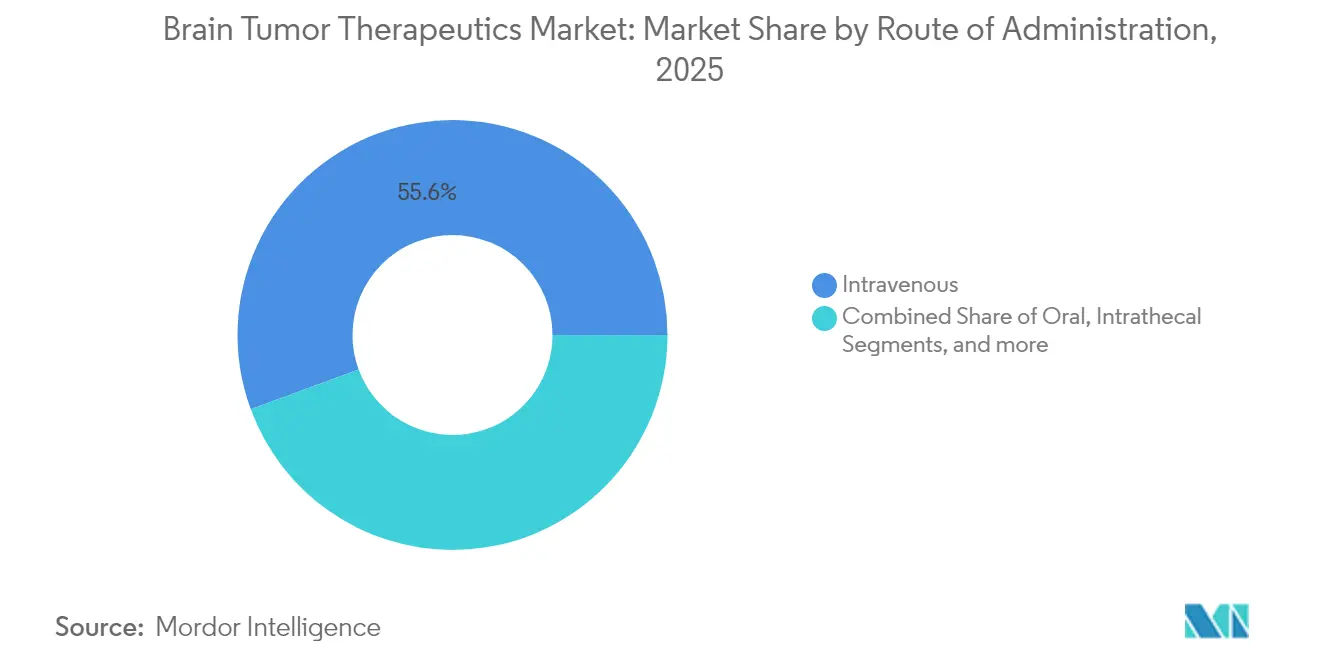
- By route of administration, the intravenous segment commanded 55.62% share of the brain tumor therapeutics market size in 2025.
- By geography, North America accounted for 39.88% revenue share in 2025, whereas Asia-Pacific is forecast to rise at an 8.12% CAGR through 2031.
Note: Market size and forecast figures in this report are generated using Mordor Intelligence’s proprietary estimation framework, updated with the latest available data and insights as of 2026.
Global Brain Tumor Therapeutics Market Trends and Insights
Drivers Impact Analysis*
| Driver | (≈) % Impact on CAGR Forecast | Geographic Relevance | Impact Timeline |
|---|---|---|---|
| Rising incidence of primary & metastatic brain tumors | +1.8% | Global | Medium term (2-4 years) |
| Late-stage pipeline expansion & accelerated FDA approvals | +2.1% | North America & EU, spill-over to APAC | Short term (≤ 2 years) |
| Precision-medicine shift toward biomarker-guided therapies | +1.6% | Global; early gains in US, Germany, Japan | Medium term (2-4 years) |
| Government-sponsored brain cancer initiatives & funding boosts | +1.2% | North America & EU core | Long term (≥ 4 years) |
| BNCT commercial roll-out momentum | +0.9% | APAC core; spill-over to MEA | Long term (≥ 4 years) |
| AI-enabled drug-repurposing accelerates orphan-tumor candidates | +1.4% | Global | Short term (≤ 2 years) |
| Source: Mordor Intelligence | |||
Late-stage pipeline expansion & accelerated FDA approvals
Regulatory speed continues to reshape the brain tumor therapeutics market. Vorasidenib’s 2024 approval for grade 2 IDH-mutant glioma doubled median progression-free survival versus placebo, validating biomarker-guided development paths[1]Drugs.com, “FDA Approves Vorasidenib for Low-Grade Glioma,” drugs.com. Breakthrough therapy designations are compressing timelines, while investigational device exemptions now cover novel radiotherapy platforms such as Alpha DaRT’s radium-224 seeds for recurrent glioblastoma. Collective momentum shortens commercialization cycles and encourages multi-arm master trials that match molecular subsets with targeted agents.
Precision-medicine shift toward biomarker-guided therapies
Routine testing for IDH mutation, MGMT promoter methylation, and 1p/19q codeletion now guides regimen selection in leading centers. Liquid biopsy platforms provide real-time molecular readouts, allowing therapy switches before radiographic progression. Machine-learning algorithms integrating multi-omics profiles already predict immunotherapy responses with 90%+ accuracy, a capability that is refining eligibility criteria for checkpoint blockade.
Commercial roll-out of compact BNCT platforms
Japan has moved Boron Neutron Capture Therapy from experimental use to routine hospital service by installing compact accelerator-based neutron sources that replace the large research reactors used in earlier trials. More than 500 patients have already received the therapy, establishing a first real-world safety and efficacy record for the modality . Clinical programs are now extending beyond recurrent head-and-neck tumors to brain malignancies, helped by next-generation boron carriers such as peptide-conjugated compounds that accumulate more selectively in tumor tissue. Parallel Monte Carlo studies show that redesigned neutron generators can reach thermal-to-epithermal flux ratios that match IAEA treatment guidelines, a technical milestone that opens the door to broader disease applications and installation in regional cancer centers.
AI-assisted drug repurposing for orphan brain tumors
Machine-learning platforms that screen legacy compound libraries against multi-omics cancer datasets are compressing the discovery timeline for rare brain-tumor therapeutics from decades to only a few years. Pattern-recognition algorithms have already highlighted new uses for familiar molecules, including the repositioning of the anthelmintic mebendazole for glioblastoma, now protected in a recent patent filing. Model accuracy keeps improving as training sets combine genomic, transcriptomic and real-world treatment-outcome data, allowing developers to forecast drug response at the tumor-subtype level with high confidence. The approach is especially valuable for ultra-rare brain tumors whose small patient pools make conventional prospective trials impractical; AI-guided repurposing supplies clinically actionable candidates while minimizing both cost and time.
Restraints Impact Analysis*
| Restraint | (≈) % Impact on CAGR Forecast | Geographic Relevance | Impact Timeline |
|---|---|---|---|
| High cost of novel therapeutics & combination regimens | -1.4% | Global | Short term (≤ 2 years) |
| Blood–brain barrier limits small-molecule & biologic penetration | -1.1% | Global | Medium term (2-4 years) |
| Tumor micro-environment driven immunotherapy resistance | -0.8% | Global | Medium term (2-4 years) |
| Radio-isotope supply shortages for BNCT facilities | -0.6% | APAC core; emerging in North America | Long term (≥ 4 years) |
| Source: Mordor Intelligence | |||
High cost of novel therapeutics & combination regimens
First-in-class cell and gene therapies often exceed USD 400,000 per course, while multi-agent combinations can add another USD 300,000 annually, straining payer budgets. Health systems now link reimbursement to real-world outcomes, creating coverage delays that limit early adoption in lower-income settings.
Blood–brain barrier limits small-molecule & biologic penetration
Only 2% of systemic molecules reach therapeutic concentrations in the brain, forcing reliance on high doses that raise systemic toxicity. Focused ultrasound, convection-enhanced delivery, and nanoparticle carriers are progressing, yet capital intensity and specialized training slow rollout beyond tertiary centers.
*Our forecasts treat driver/restraint impacts as directional, not additive. The impact forecasts reflect baseline growth, mix effects, and variable interactions.
Segment Analysis
By Type of Brain Cancer: Glioblastoma drives innovation despite therapeutic hurdles
Glioblastoma held 50.78% of brain tumor therapeutics market share in 2025 and is projected to grow at an 8.02% CAGR, sustaining the largest slice of the brain tumor therapeutics market size through 2031. High mortality, limited standard-of-care options, and the emergence of tumor-treating fields help maintain investor focus.
Continued device-drug pairings, peptide vaccines, and IDH-selective inhibitors illustrate capital concentration in this segment. Meningioma follows in value terms thanks to refined radiosurgery protocols, whereas pituitary tumors benefit from novel endocrine modulators that normalize hormone levels more predictably. Pediatric-leaning subtypes such as medulloblastoma and ependymoma now integrate risk-adapted radiotherapy with molecular diagnostics, improving five-year survival yet leaving relapsed disease an urgent research priority.


By Therapy: Targeted small molecules overtake immunotherapy in growth pace
Immunotherapy commanded 32.10% revenue in 2025 and remains integral for high-mutational-burden tumors. Nonetheless, the precision-led approval wave now positions targeted small-molecule therapy as the fastest-growing category at an anticipated 8.10% CAGR, reflecting the brain tumor therapeutics market’s appetite for orally dosed, biomarker-matched agents.
Chemotherapy endures as adjuvant or salvage therapy, but dose-dense regimens face replacement as mutation-specific inhibitors gain reimbursement. Gene and cell therapies introduce curative potential yet confront scalability and cost. Meanwhile, radiotherapeutic adjuncts such as BNCT are expanding beyond head and neck indications, reinforcing multi-modal protocols.
By Route of Administration: Intravenous remains dominant amid delivery innovation
The intravenous segment covered 55.62% of the brain tumor therapeutics market size in 2025 and should rise at an 7.90% CAGR through 2031. Clinicians rely on IV delivery for precise dose titration and real-time toxicity management in narrow therapeutic index drugs.
Oral targeted agents are scaling thanks to improved permeability and patient convenience, while intrathecal and intraventricular methods see niche use in leptomeningeal spread. Convection-enhanced delivery trials demonstrate 100-fold higher tumor concentrations versus systemic infusion, yet technical complexity confines it to referral centers.
Geography Analysis
North America maintained 39.88% market share in 2025 and enjoys unrivaled clinical-trial density, genomic testing adoption, and payer mechanisms that expedite new product uptake. The region’s large installed base of Gamma Knife and BNCT systems supports combination regimens, and philanthropic funding from the Biden Cancer Moonshot sustains translational research programs.
Europe follows with steady contributions as EMA centralized approvals streamline access across member states, and public–private partnerships co-finance orphan-tumor projects. Germany, France, and Italy collectively host more than 120 ongoing brain tumor interventional studies, while pan-European registries supply real-world evidence to health technology assessment agencies.
Asia-Pacific, the fastest-growing region at 8.12% CAGR, benefits from China’s regulatory modernization, where 60+ innovative drugs won clearance under accelerated pathways in 2024. Japan’s early BNCT adoption makes the country a regional referral hub, and Australian institutions leverage favorable ethics timelines to recruit international patients. Improving reimbursement frameworks in South Korea and Singapore further broaden patient access to leading-edge regimens.

Competitive Landscape
Competition is intense yet moderately concentrated, with global pharmaceutical leaders and nimble biotechs racing to secure first-in-class labels. Novartis, Roche, and Bristol-Myers Squibb leverage diversified pipelines and precision-oncology expertise to anchor the high-value glioma franchise. Novocure captured the tumor-treating fields niche after demonstrating overall-survival gains in multiple randomized trials.
Acquisition activity is brisk. Merck’s USD 30 million purchase of Modifi Biosciences delivered a DNA-damage enhancer designed to circumvent temozolomide resistance. Bristol-Myers Squibb’s USD 4.1 billion move for RayzeBio secured an actinium-225 radiopharmaceutical platform, though global isotope shortages threaten supply consistency[4]Fierce Pharma, “Radiopharmaceutical Supply Headwinds Stall Clinical Programs,” fiercepharma.com.
Developers also chase rare-tumor white space, where competitive density remains low and regulators offer priority review vouchers. Companies with adaptive trial capabilities and patient-advocacy alliances secure faster enrollment and differentiated real-world datasets that bolster reimbursement dossiers.
Brain Tumor Therapeutics Industry Leaders
Bayer AG
F. Hoffmann-La Roche Ltd
Eisai Inc.
Novartis AG
Merck & Co. Inc.
- *Disclaimer: Major Players sorted in no particular order

Recent Industry Developments
- January 2025: Novocure reported that TTFields plus gemcitabine/nab-paclitaxel raised overall survival to 16.2 months in the Phase 3 PANOVA-3 study, with a regulatory filing planned for late 2025.
- April 2025: The FDA granted an investigational device exemption for Alpha DaRT radium-224 therapy in a recurrent glioblastoma pilot, introducing localized alpha radiation to US trials.
- January 2025: Elicio Therapeutics secured FDA alignment on an ELI-002 registrational pathway in brain cancer, advancing an amphiphile-based immunotherapy toward potential approval.
- August 2024: Vorasidenib (Voranigo) gained FDA approval for grade 2 IDH-mutant glioma, doubling median progression-free survival to 27.7 months.


Research Methodology Framework and Report Scope
Market Definitions and Key Coverage
Our study defines the brain tumor therapeutics market as all branded and generic pharmacological and device-based treatments that aim to shrink, stabilize, or destroy primary or metastatic brain neoplasms, including glioblastoma, meningioma, pituitary tumors, ependymoma, medulloblastoma, and rarer subtypes.
Scope exclusion: purely diagnostic imaging, biopsies, palliative care drugs, and supportive medications such as anti-emetics are outside this valuation.
Segmentation Overview
- By Type of Brain Cancer
- Glioblastoma
- Meningioma
- Pituitary Tumors
- Ependymoma
- Medulloblastoma
- Other Rare Tumors
- By Therapy
- Chemotherapy
- Immunotherapy
- Gene & Cell Therapy
- Targeted Small-Molecule Therapy
- Tumor-Treating Fields (TTF) & Electro-therapy
- Radiotherapy Adjuncts
- By Route of Administration
- Oral
- Intravenous
- Intrathecal / Intraventricular
- Convection-Enhanced Delivery
- Geography
- North America
- United States
- Canada
- Mexico
- Europe
- Germany
- United Kingdom
- France
- Italy
- Spain
- Rest of Europe
- Asia-pacific
- China
- Japan
- India
- South Korea
- Australia
- Rest of Asia-pacific
- Middle East and Africa
- GCC
- South Africa
- Rest of Middle East and Africa
- South America
- Brazil
- Argentina
- Rest of South America
- North America
Detailed Research Methodology and Data Validation
Primary Research
Mordor analysts interviewed neuro-oncologists, medical pharmacists, and device product managers across North America, Europe, Asia-Pacific, and the Gulf to validate incidence-to-treatment pathways, decipher off-label use, and stress-test assumed adoption curves for recent approvals such as TTFields systems and IDH-inhibitors. Follow-up surveys with payor advisors and hospital procurement leads refined discount structures and forecast reimbursement inflection points.
Desk Research
We began with global epidemiological datasets from GLOBOCAN, SEER, and the International Agency for Research on Cancer, which quantify new and prevalent brain tumor cases by age and sex. Regulatory approval archives from the US FDA, EMA, and PMDA helped map launch timelines and label expansions, while pricing files on sources such as CMS Average Sales Price and Japan NHI price lists anchored regional ASPs. Trade association white papers from the National Brain Tumor Society, European Association of Neuro-Oncology, and Asian Neuro-Oncology Society provided treatment uptake ratios, and peer-reviewed journals in Neuro-Oncology and Lancet Oncology revealed survival-linked therapy switches. Paid databases like D&B Hoovers and Dow Jones Factiva supplied company-level revenue splits that we matched to molecule labels. This list is illustrative; many other open and paid sources informed data checks, context, and clarifications.
Market-Sizing & Forecasting
A top-down epidemiology build (incident cases × treatment eligibility × adherence × mean course pricing) establishes the first cut, which is then cross-checked with selective bottom-up roll-ups of disclosed product revenues and sampled hospital purchase data. Key variables include annual incidence drift, median lines of therapy per patient, regional branded-to-generic share shifts, average treatment duration, and pipeline success probabilities. Forecasts through 2030 rely on multivariate regression blended with scenario analysis that flexes new-drug approval pace and generic erosion rates, with coefficients and scenarios agreed in expert panels. Gaps in bottom-up inputs are filled by analog market proxies and normalized using weighted regional ratios before final reconciliation.
Data Validation & Update Cycle
Outputs pass anomaly scans versus historic sales, mortality trends, and clinical trial enrollment signals. Senior analysts review material variances, after which the model is locked. Reports refresh yearly, and mid-cycle updates trigger if an unforeseen approval, safety signal, or macro shock shifts any core variable.
Why Mordor's Brain Tumor Therapeutics Baseline Earns Trust
Published estimates often differ because firms pick unique scopes, discount ladders, and refresh cadences. By anchoring on full therapeutic breadth, aligning incidence math with real-world uptake, and updating the model each year, we minimize those divergences.
Benchmark comparison
| Market Size | Anonymized source | Primary gap driver |
|---|---|---|
| USD 3.19 B (2025) | Mordor Intelligence | - |
| USD 2.29 B (2025) | Global Consultancy A | excludes pipeline launches and device-based therapy revenue |
| USD 3.48 B (2025) | Industry Journal B | combines diagnostic equipment with drug sales, inflating base |
These comparisons show that while figures vary, Mordor's disciplined scope selection, variable transparency, and annual refresh give decision-makers a balanced, repeatable baseline they can rely upon.


Key Questions Answered in the Report
What is the current value of the brain tumor therapeutics market?
The market generated USD 3.42 billion in 2026 and is on track to reach USD 4.87 billion by 2031, growing at a 7.35% CAGR.
Which cancer type contributes the most revenue?
Glioblastoma contributes the highest revenue, accounting for 50.78% of the 2025 market and expanding at an 8.02% CAGR through 2031.
Why are targeted small-molecule therapies gaining pace?
Biomarker-matched small molecules, such as IDH inhibitors, deliver oral convenience and improved efficacy, making them the fastest-growing therapy class at 8.10% CAGR.
Which region offers the most rapid growth opportunity?
Asia-Pacific is the fastest-growing region with an 8.12% CAGR, supported by accelerated approvals in China and BNCT adoption in Japan.
What factors limit treatment success despite new approvals?
High therapy costs, blood–brain barrier penetration limits, and supply constraints for radio-isotopes restrain broader patient access and consistent treatment outcomes.
How concentrated is the competitive landscape?
The market earns a concentration score of 6, indicating moderate dominance by the top five firms while allowing room for innovative biotechs to secure share.
Page last updated on:


