
Central Nervous System Therapeutics Market Size and Share
Market Overview
| Study Period | 2020 - 2031 |
|---|---|
| Forecast Data Period | 2026 - 2031 |
| Market Size (2026) | USD 143.32 Billion |
| Market Size (2031) | USD 197.35 Billion |
| Growth Rate (2026 - 2031) | 6.62 % |
| Fastest Growing Market | Asia Pacific |
| Largest Market | North America |
Major Players *Disclaimer: Major Players sorted in no particular order Image © Mordor Intelligence. Reuse requires attribution under CC BY 4.0. | |
Central Nervous System Therapeutics Market Analysis by Mordor Intelligence
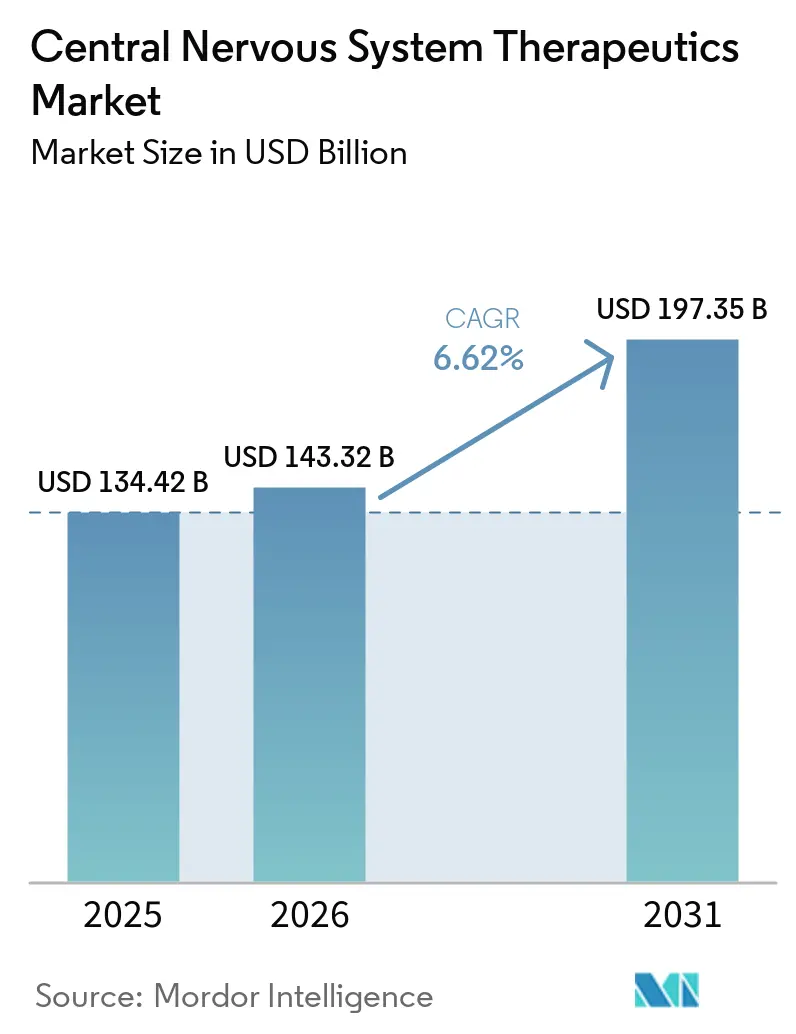
Central nervous system therapeutics market size in 2026 is estimated at USD 143.32 billion, growing from 2025 value of USD 134.42 billion with 2031 projections showing USD 197.35 billion, growing at 6.62% CAGR over 2026-2031. Breakthrough approvals such as KarXT for schizophrenia and donanemab for Alzheimer’s disease mark a decisive shift from symptomatic control toward precision medicine that targets causal neurobiology. Intensifying payer support for disease-modifying regimens, expanding biomarker-guided diagnosis, and AI-enabled trial design collectively reinforce the expansion trajectory. Competitive momentum is heightened by high-value acquisitions that secure differentiated assets, even as generic erosion squeezes margins for mature franchises. The resulting landscape rewards companies capable of blending robust clinical evidence with real-world value propositions.
Key Report Takeaways
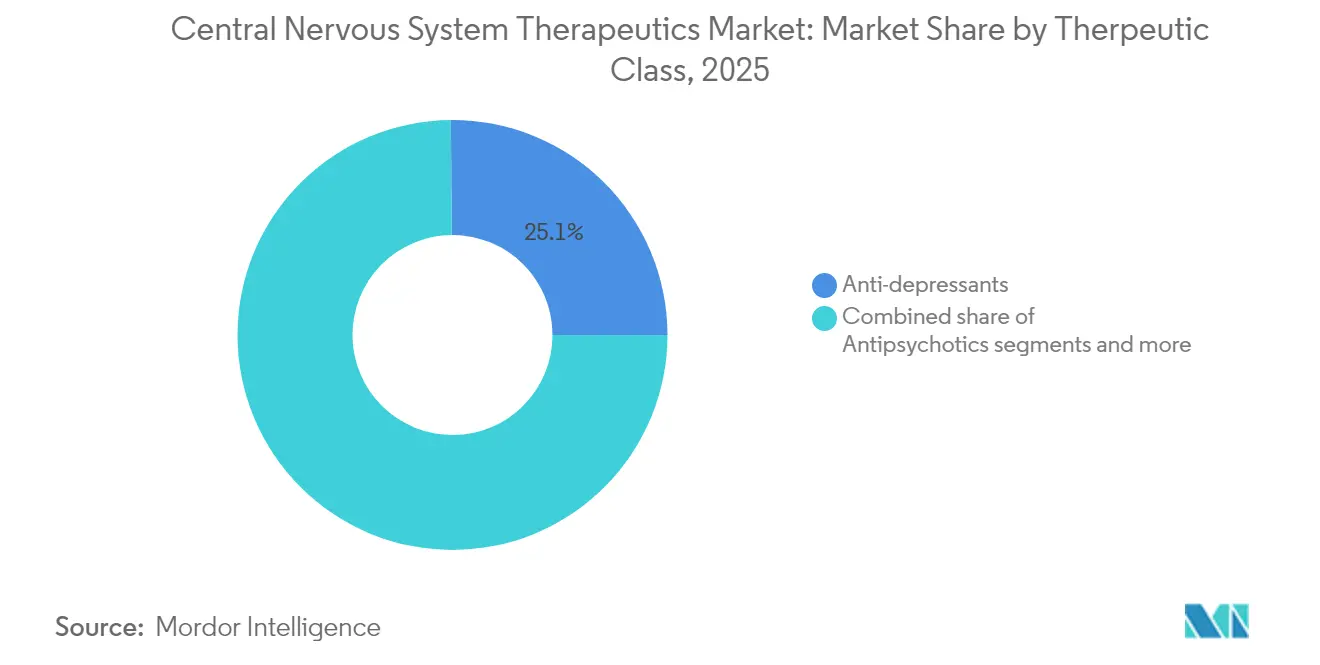
- By therapeutic class, antidepressants led with 25.12% revenue share in 2025; disease-modifying therapies are projected to grow at a 6.83% CAGR through 2031.
- By disease, depression accounted for 27.55% of the central nervous system therapeutics market share in 2025, while Alzheimer’s disease is set to climb at a 7.05% CAGR to 2031.
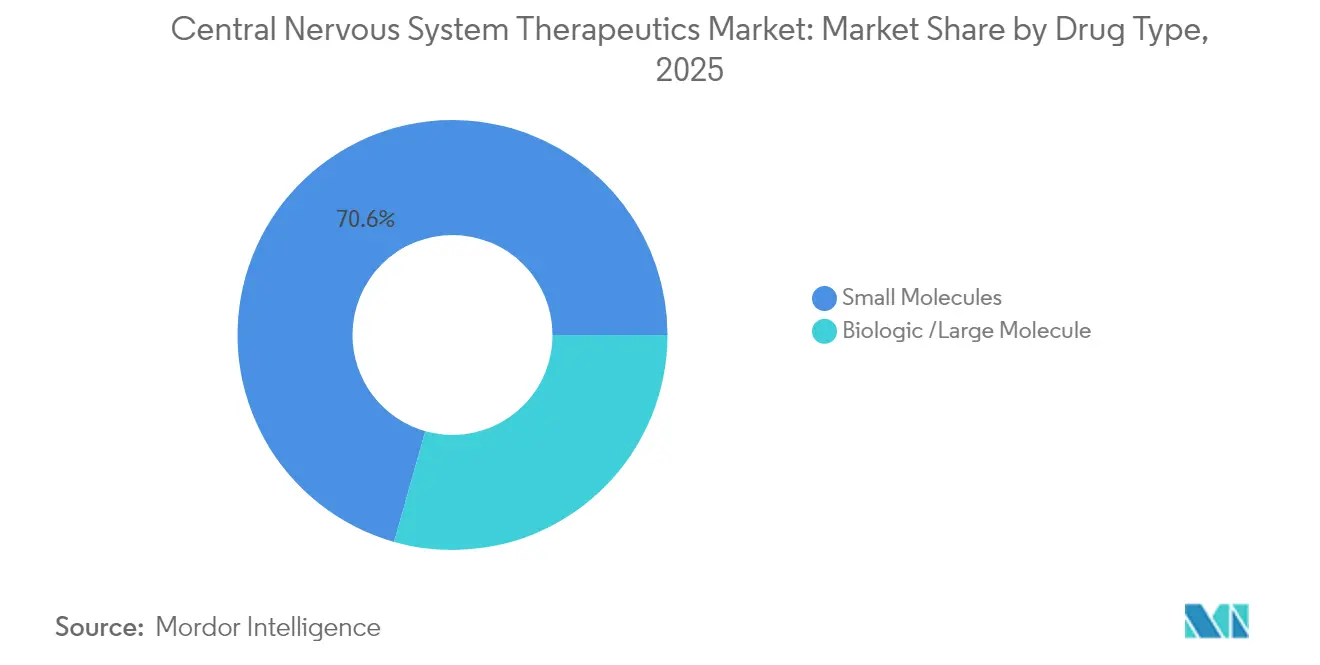
- By drug type, small molecules commanded 70.62% share of the central nervous system therapeutics market size in 2025; biologics are forecast to rise at a 7.52% CAGR during 2026-2031.
- By route of administration, oral formulations held 82.11% of the central nervous system therapeutics market size in 2025 and alternative routes are advancing at a 7.28% CAGR through 2031.
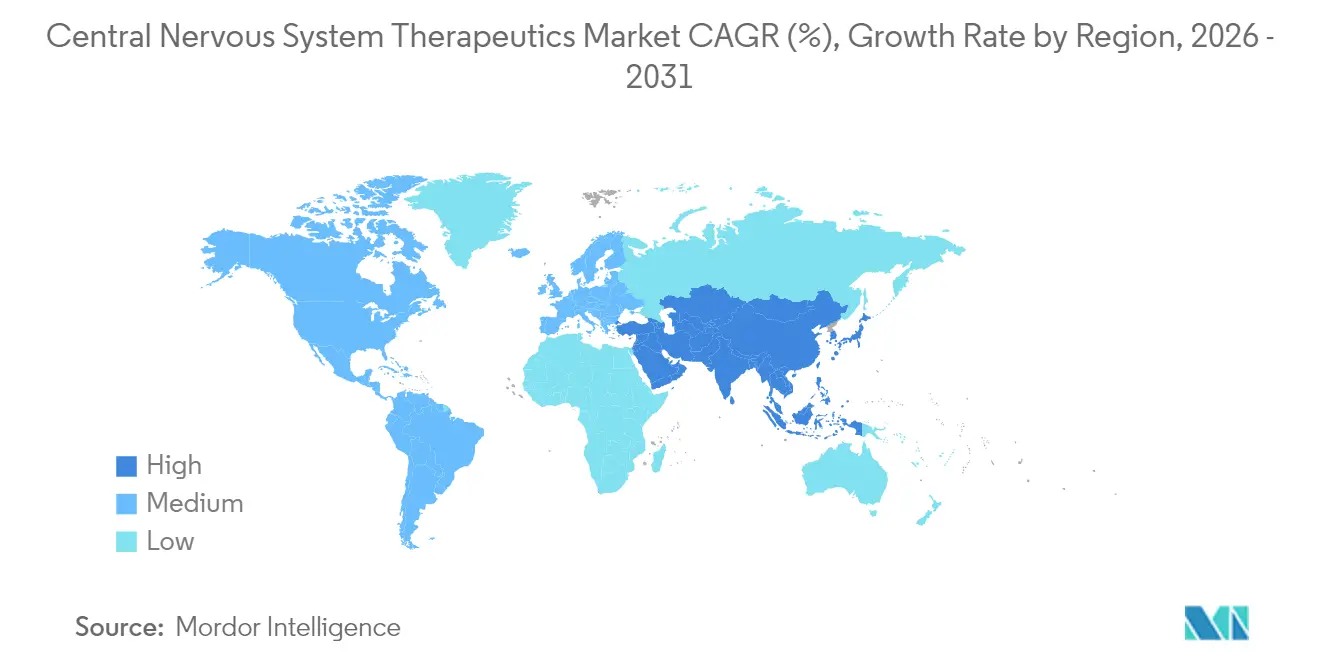
- By geography, North America retained 45.01% of the central nervous system therapeutics market share in 2025, whereas Asia-Pacific is expanding at a 7.78% CAGR to 2031.
Note: Market size and forecast figures in this report are generated using Mordor Intelligence’s proprietary estimation framework, updated with the latest available data and insights as of 2026.
Market Trends and Insights
Drivers Impact Analysis of Central Nervous System Therapeutics Market*
| Driver | (~) % Impact on CAGR Forecast | Geographic Relevance | Impact Timeline |
|---|---|---|---|
| Aging population & rising CNS disorder prevalence | +1.0% | Global, with concentration in North America & Europe | Long term (≥ 4 years) |
| Growing generic penetration post-LOE | +0.8% | Global, led by North America & Europe | Medium term (2-4 years) |
| Favorable reimbursement for breakthrough CNS drugs | +0.7% | North America & EU, expanding to APAC | Medium term (2-4 years) |
| Improved neuroimaging & biomarker-based diagnosis | +0.5% | North America & EU core, spillover to APAC | Long term (≥ 4 years) |
| Psychedelic-assisted therapy clinical wins | +0.5% | North America & EU regulatory frameworks | Short term (≤ 2 years) |
| Venture funding into CNS-focused digital twins | +0.4% | Global, concentrated in North America & EU | Medium term (2-4 years) |
| Source: Mordor Intelligence | |||


Aging Population & Rising CNS Disorder Prevalence
Neurological disorders affected 3.4 billion people in 2024, making them the leading global source of disability-adjusted life years00038-3/fulltext). Incidence accelerates beyond age 65, driving sustained demand for the central nervous system therapeutics market. Annual caregiving costs for cognitive decline reached USD 1.1 trillion in developed economies, motivating payers to endorse interventions that delay institutionalization. Early diagnosis paired with disease-modifying drugs is therefore viewed as fiscally prudent by insurers. As demographic aging is irreversible over the forecast horizon, this demand vector remains the single most durable growth catalyst for the central nervous system therapeutics market.
Growing Generic Penetration Post-LOE
Lyrica generics captured 85% of prescription volume within 18 months of US exclusivity loss, illustrating how quickly price erosion strikes blockbuster CNS brands. Lower cost options widen patient access in emerging economies, swelling treated populations and cementing the central nervous system therapeutics market as a core expenditure line for public payers. Simultaneously, originators accelerate next-generation assets and novel delivery modes that command premium pricing and resist substitution, keeping innovation cycles active.
Favorable Reimbursement for Breakthrough CNS Drugs
The FDA’s Total Care for Exceptional Therapies pathway trims approval timelines by 40% for high-need CNS drugs. Medicare’s coverage of lecanemab despite modest benefit signals willingness to reimburse disease-modifying agents with clear societal value. Value-based contracts that tether payments to functional outcomes are spreading to private insurance and Asian markets, improving revenue predictability for innovators and reinforcing confidence in the central nervous system therapeutics market.
Improved Neuroimaging & Biomarker-Based Diagnosis
Blood-based tests now achieve 90% accuracy for Alzheimer’s disease, enabling earlier therapeutic intervention. PET imaging of tau and neuroinflammation supplies objective endpoints that shrink trial sizes and bolster statistical power. Regulators increasingly accept central nervous system biomarker data in lieu of long-term clinical outcomes, compressing development costs. Integration of AI with multimodal imaging creates predictive models that match patients with optimal therapies, elevating success rates for pipeline programs within the central nervous system therapeutics market.
Restraints Impact Analysis of Central Nervous System Therapeutics Market*
| Restraint | (~) % Impact on CAGR Forecast | Geographic Relevance | Impact Timeline |
|---|---|---|---|
| High clinical trial failure rates in neurology | -0.9% | Global, particularly impacting North America & EU | Long term (≥ 4 years) |
| Generic erosion of blockbusters (e.g., Lyrica) | -0.7% | Global, led by North America & Europe | Medium term (2-4 years) |
| Stringent CNS safety labeling requirements | -0.5% | Global regulatory frameworks | Medium term (2-4 years) |
| Supply-chain scarcity of specialized excipients | -0.3% | Global, concentrated in Asia-Pacific manufacturing | Short term (≤ 2 years) |
| Source: Mordor Intelligence | |||
High Clinical Trial Failure Rates in Neurology
A 92% attrition rate afflicts neurological pipelines, the worst among therapeutic areas. Complex pathophysiology, blood-brain-barrier permeability hurdles, and heterogeneous patient presentations thwart translation of preclinical signals. High-profile setbacks such as emraclidine and dalzanemdor underscore persistent risk. Capital-intensive trials deter smaller firms, fostering consolidation as deep-pocketed pharmas acquire distressed assets, yet overall innovation velocity suffers, tempering the growth outlook for the central nervous system therapeutics market.
Stringent CNS Safety Labeling Requirements
Sixty percent of newly approved neurological drugs enter the market under FDA Risk Evaluation and Mitigation Strategies. EMA mandates expanded neuropsychiatric monitoring, extending development timelines by up to 18 months. Additional data collection inflates trial budgets and disproportionately burdens small developers. Though essential for patient protection, heightened vigilance elevates barriers to entry and lengthens payback periods, dampening near-term enthusiasm within the central nervous system therapeutics market.
*Our forecasts treat driver/restraint impacts as directional, not additive. The impact forecasts reflect baseline growth, mix effects, and variable interactions.
Central Nervous System Therapeutics Market Segment Analysis
By Therapeutic Class:
Disease-Modifying Therapies Scale RapidlyThe disease-modifying cohort is on track to expand at a 6.83% CAGR, outpacing all other categories inside the central nervous system therapeutics market. Antidepressants remain the volume leader at 25.12% 2025 share, sustained by widespread prescribing in primary care. Investor interest has pivoted, however, toward agents that alter disease course, exemplified by Bristol Myers Squibb’s USD 14 billion outlay for KarXT. These transactions channel capital into regenerative pathways, immunomodulation, and synaptic repair platforms.
Antipsychotics receive renewed momentum following KarXT, while antiepileptics confront steep generic penetration. Analgesics suffer margin squeeze, yet specialty migraine biologics retain pricing strength. Neurodegeneration assets attract premium valuations despite modest efficacy because any delay in progression yields sizeable societal savings. Convergence is emerging as firms test combo regimens pairing symptomatic relief with disease modification, blurring historic therapeutic silos within the central nervous system therapeutics market.


By Diseases:
Alzheimer’s Disease Sets the Growth PaceDepression kept 27.55% of 2025 revenues, but Alzheimer’s disease is forecast to post a 7.05% CAGR, the fastest among indications. Reimbursement of lecanemab and pipeline agents such as donanemab creates a multibillion-dollar addressable segment that was previously untapped. Mental-health indications also benefit from digital therapeutics that extend reach beyond traditional clinical settings.
Neurovascular disorders and rare epilepsies remain underserved niches offering orphan-drug pricing power. Infection-linked neurological sequelae and oncology crossover therapies are slowly enlarging, aided by heightened research into latent viral impacts on the CNS. These diverse disease-level dynamics reinforce multi-modal portfolio strategies inside the central nervous system therapeutics market.
By Drug Type:
Biologics and Gene Therapies QuickeningSmall molecules retained 70.62% of 2025 sales, yet biologics are charting a 7.52% CAGR thanks to growing acceptance of monoclonal antibodies and gene therapies. FDA nods for SOD1-ALS and AADC deficiency confirm feasibility of genetic interventions in neurology. Antibody-drug conjugates and targeted degraders merge biologic precision with small-molecule convenience, diversifying toolkits for innovators.
Investors reward platforms that surmount the blood-brain barrier, such as receptor-mediated transcytosis vectors. Meanwhile, small-molecule research shifts toward highly brain-penetrant chemistries and allosteric modulators. This complementary evolution sustains balanced growth across modalities in the central nervous system therapeutics market.
By Route of Administration:
Alternatives to Oral Gain GroundOral dosage forms commanded 82.11% share in 2025, favored for convenience and supply-chain familiarity. Long-acting injectables and intranasal sprays, however, are registering a 7.28% CAGR by improving adherence and enabling rapid symptom control. Transdermal and implantable systems promise steady plasma levels with fewer systemic effects, creating clinical value that offsets higher costs.
Emerging intrathecal and intraventricular devices offer targeted drug deposition for spinal or intracranial pathologies. Digital device-drug hybrids that auto-adjust dosing based on biomarker feedback are entering trials, opening a future where route of administration becomes personalized rather than fixed, further enriching the central nervous system therapeutics market.
Geography Analysis
North America Central Nervous System Therapeutics Market
North America accounted for 45.01% of 2025 revenue, underpinned by Medicare coverage expansions and dense clinical-trial infrastructure. The United States leads with sophisticated payer frameworks that adopt value-based contracts, whereas Canada provides stable uptake through universal coverage. Mexico is emerging on the back of growing middle-class insurance penetration. Pricing pressures from generic proliferation and buyer consolidation temper revenue per patient but are offset by the premium commanded by innovative launches, sustaining leadership for the central nervous system therapeutics market.
APAC Central Nervous System Therapeutics Market
Asia-Pacific is the growth heartbeat, projected at 7.78% CAGR, driven by China’s regulatory liberalization, Japan’s fast-track approvals, and India’s expanding access programs. Rapid urbanization correlates with higher incidence of mood and anxiety disorders, unlocking volume. Japan and South Korea anchor regional clinical trials, while Southeast Asian nations import affordable generics to widen coverage. Government recognition of neurological disease burden is translating into reimbursement reforms that uplift market value, positioning the region as a pivotal expansion arena for the central nervous system therapeutics market.
Europe Central Nervous System Therapeutics Market
Europe delivers steady gains through EMA-coordinated pathways and universal healthcare. Germany and the United Kingdom dominate launches due to robust assessment agencies, whereas southern European markets contribute scale. The new Clinical Trials Information System streamlines submissions, slightly trimming timelines. Cost-effectiveness scrutiny remains stringent, sometimes delaying premium products, yet predictable reimbursement decisions create long-tail revenue stability. Collectively, these continental patterns diversify growth drivers and risk profiles for stakeholders in the central nervous system therapeutics market.

Regulatory Landscape
Regulatory oversight for CNS therapeutics is tightening around safety, evidence generation, and bioequivalence standards, led by the FDA and the European Medicines Agency (EMA). In the European Union, many CNS medicines (including neurodegenerative disease therapies and biotechnologically derived products) use the mandatory centralized procedure under Regulation (EC) No 726/2004, which results in a single EMA review and a European Commission decision governing access across the EEA.
Recent EU actions also show steady review throughput for specialty neurology products. In April 2026, EMA CHMP issued a positive opinion for Sanofi's Cenrifki (tolebrutinib) for secondary progressive multiple sclerosis without relapses. In June 2026, CHMP issued a positive opinion for Acadia's Daybu (trofinetide) for Rett syndrome after re-examination. On the generics and lifecycle-management side, global harmonization advanced through ICH: M13A reached Step 4 in July 2024 for bioequivalence study design for immediate-release solid oral dosage forms, M13B remained in draft in 2025, and M13C entered development for more complex bioequivalence designs. Together, these changes affect how CNS small-molecule portfolios plan substitutions and supporting data packages across major markets.
Value Chain Analysis
The CNS therapeutics value chain spans discovery and translational R&D (target validation, biomarkers, and trial-enabling neuroimaging), clinical development, regulatory submission, manufacturing (API, drug product, and sterile fill-finish for injectables and biologics), and commercialization through wholesalers, specialty pharmacies, hospitals, and payer channels. As the market mixes high-volume oral small molecules with fast-growing biologics and advanced modalities, manufacturing and distribution requirements diverge, with cold chain, specialty logistics, and administration infrastructure becoming more central for disease-modifying and parenteral therapies.
Supply resiliency and compliance remain recurring constraints across the chain. API and key starting material concentration in China and India increases exposure to disruptions, and adverse inspection outcomes can delay approvals or exports if facilities receive downgraded regulatory status. In the United States, controlled-substance CNS agents also depend on federally managed quotas (DEA aggregate production quotas), which influences upstream availability. Policy and regulatory actions are shaping footprint decisions as well: a May 2025 White House Executive Order directed the FDA to help facilitate new domestic drug manufacturing sites, while the FDA's March 2026 draft guidance on New Approach Methodologies in drug development indicates a shift in development toolkits that can affect timelines and cost-to-file, particularly for CNS programs facing high attrition and large trial burdens.
Competitive Landscape
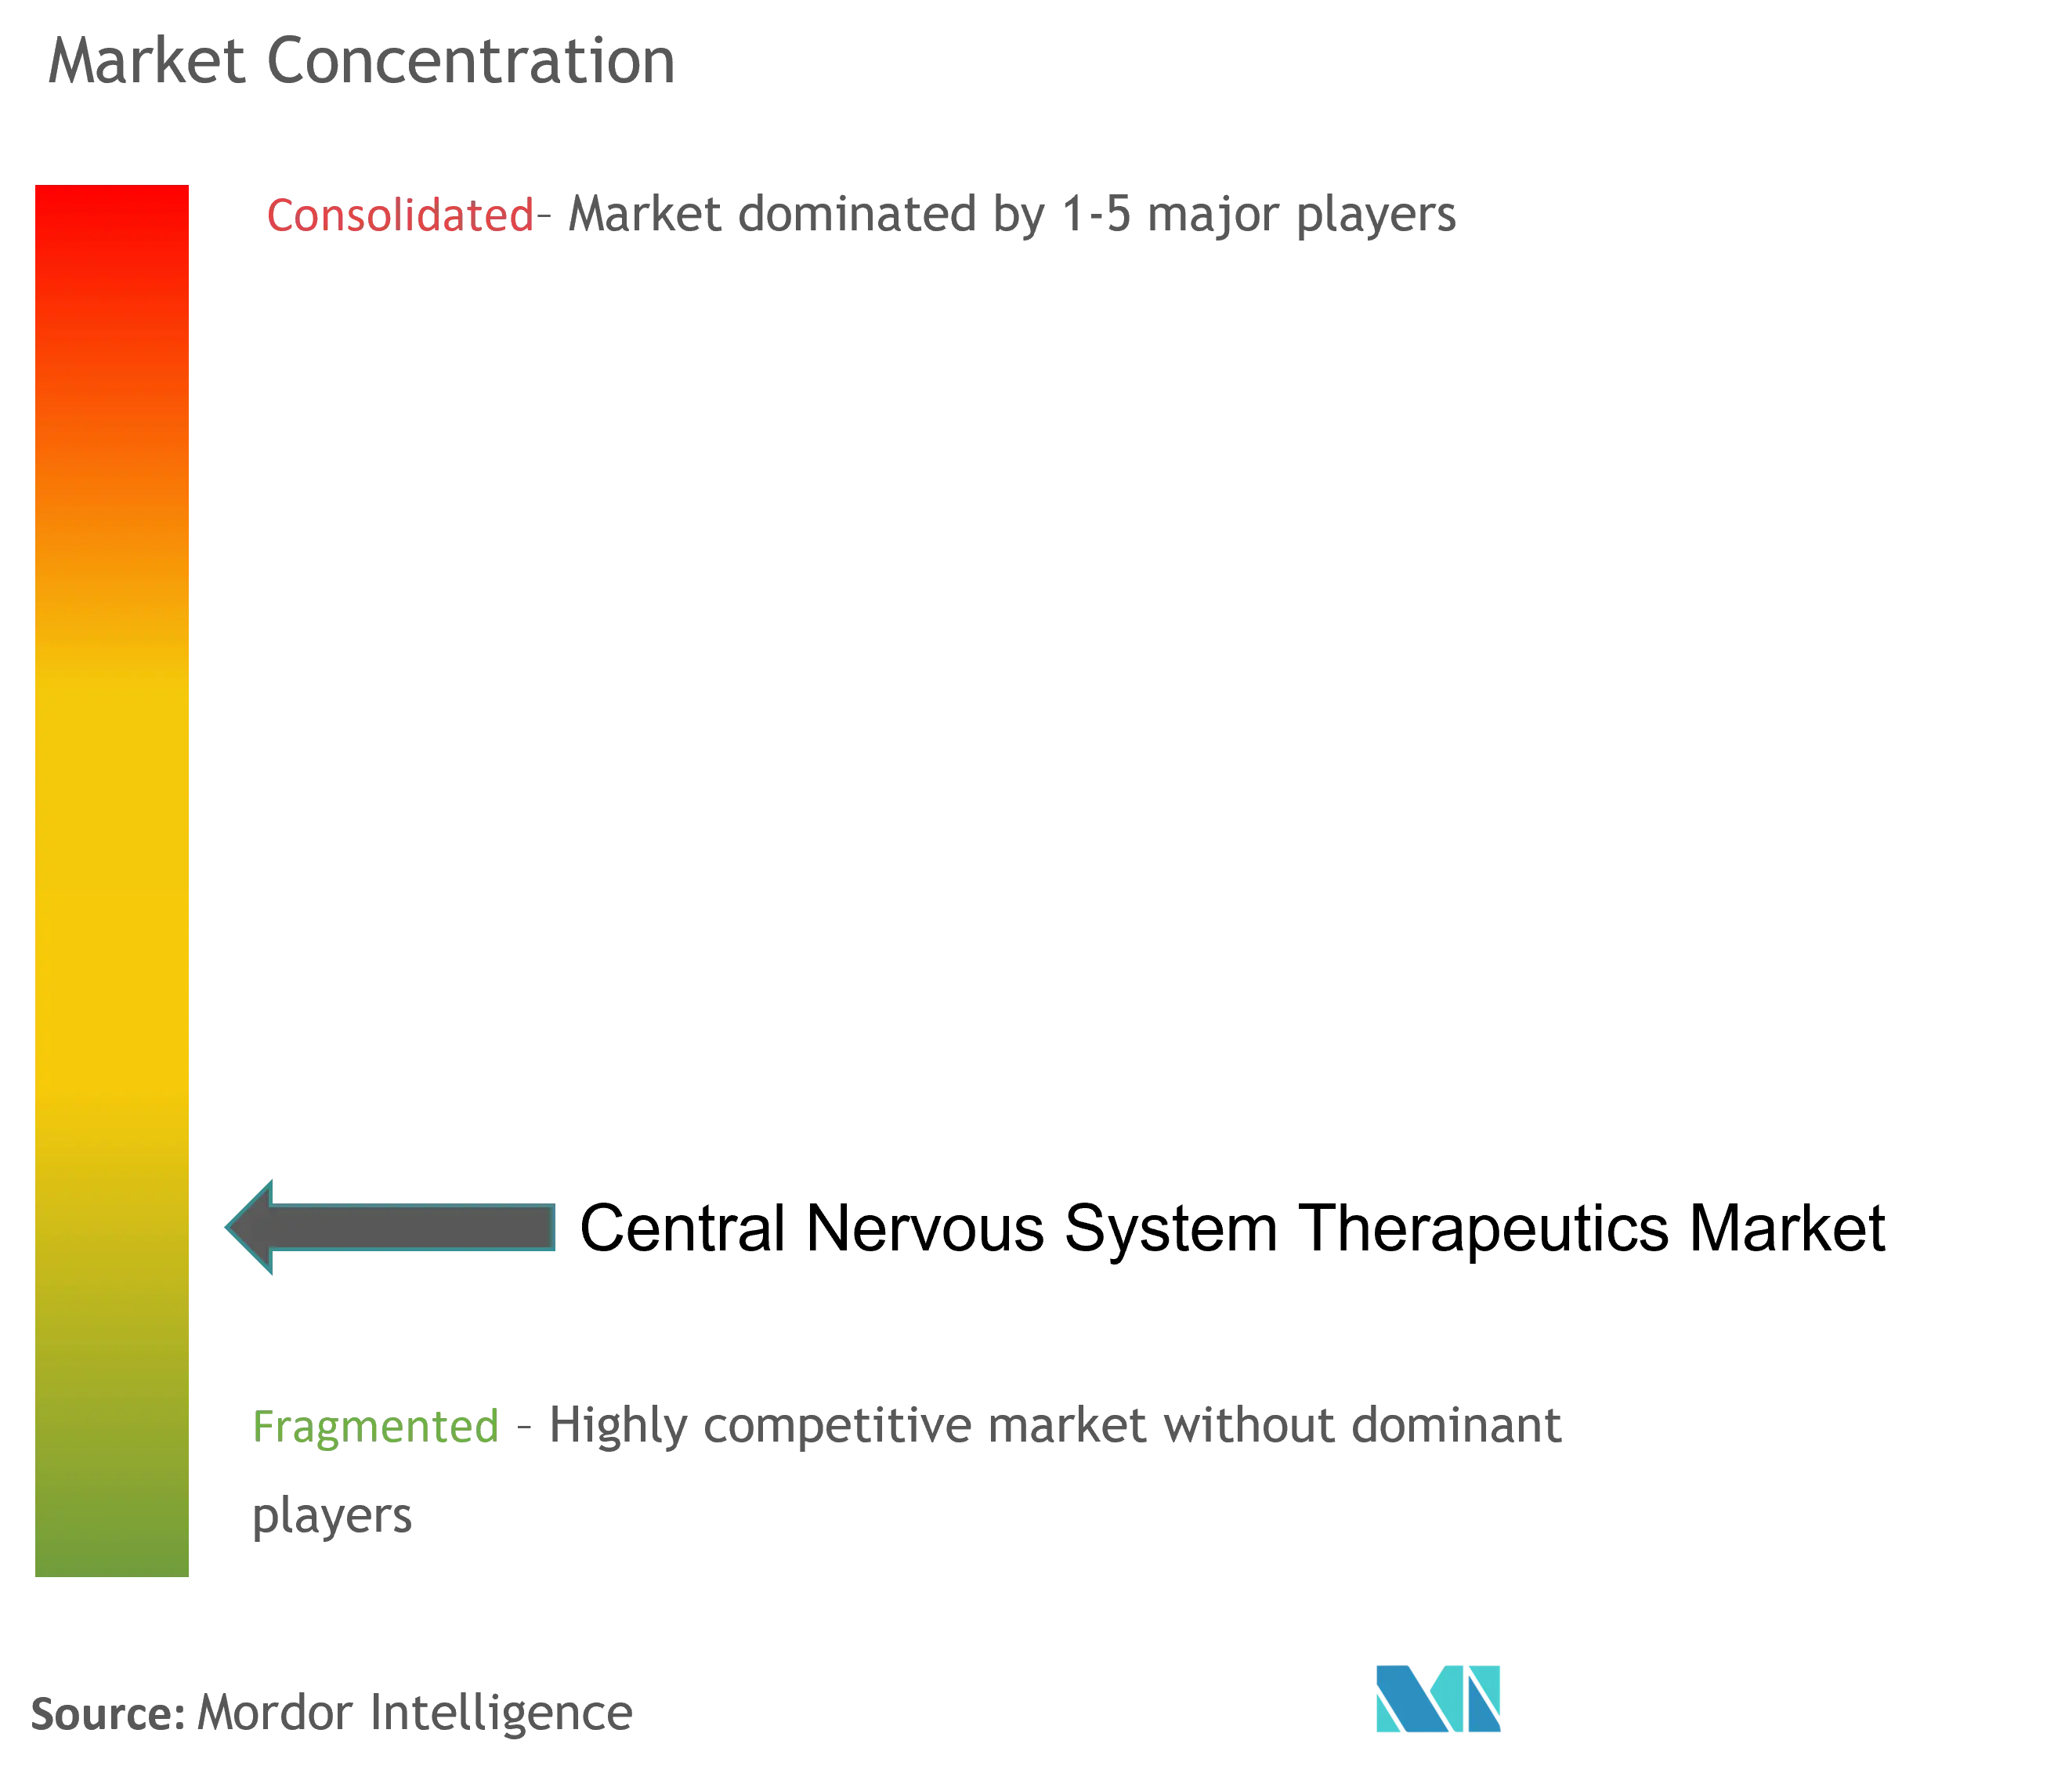
The central nervous system therapeutics market is moderately fragmented, featuring pharmaceutical majors alongside agile biotechs. Consolidation accelerated in 2024 when Bristol Myers Squibb paid USD 14 billion for Karuna Therapeutics[1]Source: Bristol Myers Squibb, “Karuna Therapeutics acquisition,” bms.com and AbbVie invested USD 2 billion in Gilgamesh Pharmaceuticals. These valuations underscore investor appetite for assets with novel mechanisms and solid Phase 2 data. Large companies are pursuing platform acquisitions that unlock multi-indication pipelines rather than single-asset deals.
Digital and data-science capabilities are now central to differentiation. Unlearn.AI’s USD 50 million raise to expand digital twins for neurology trials illustrates how AI startups can influence drug-development economics[2]Source: Unlearn.AI, “Unlearn raises USD 50 million Series B,” unlearn.ai . Established players integrate such tools to shorten cycle times and de-risk investment. Simultaneously, gene-therapy specialists obtain priority review vouchers that attract big-pharma partnerships, enriching cash and expertise pools while maintaining scientific autonomy.
Rare-disease focus and psychedelic medicine represent white-space frontiers. Gene-editing firms pursuing Huntington’s disease and antisense companies targeting ALS have attracted multibillion-dollar transactions with Novartis and Biogen. Psychedelic-assisted therapy platforms benefit from increasing regulatory openness, drawing mainstream capital. Competitive intensity is expected to heighten as proof-of-concept readouts convert scientific curiosity into commercial reality within the central nervous system therapeutics market.
Central Nervous System Therapeutics Industry Leaders
Biogen
Novartis AG
Merck KGaA
Eli Lilly and Company
Johnson & Johnson
- *Disclaimer: Major Players sorted in no particular order
Central Nervous System Therapeutics Market Companies Covered in this Report
- Biogen
- Pfizer
- Eli Lilly and Company
- Johnson & Johnson
- Novartis
- Otsuka
- Lundbeck A/S
- Teva Pharmaceutical Industries
- UCB
- GlaxoSmithKline
- Merck
- Roche
- Amgen
- AstraZeneca
- Takeda Pharmaceuticals
- Sunovion Pharmaceuticals
- Jazz Pharmaceuticals plc
- ACADIA Pharmaceuticals Inc.
- Sage Therapeutics
- Marinus Pharmaceuticals, Inc.
- GW Pharmaceuticals

Market Opportunities and Future Outlook
One concrete opportunity is expanding administration formats and care pathways that reduce infusion burden for chronic neurodegenerative therapy. The FDA approval of a subcutaneous initiation dose for lecanemab (LEQEMBI IQLIK) in July 2026 highlights industry investment in alternate routes of administration for Alzheimer's disease, supplementing a market still anchored by oral formulations while addressing adherence, site-of-care capacity, and patient convenience.
A second whitespace is building enabling technologies that improve diagnostic throughput and reduce trial risk, especially through imaging and biomarker-linked decision making. In June 2026, the FDA cleared Bayer's gadoquatrane (Ambelvist), a low-dose macrocyclic gadolinium-based contrast agent for CNS imaging, reinforcing momentum around earlier and more scalable detection and monitoring. On the innovation side, advanced modalities are widening addressable CNS segments: in July 2026, the European Commission approved Novartis' Itvisma (onasemnogene abeparvovec) for a wider age range in 5q spinal muscular atrophy, and in June 2026 EMA CHMP issued positive opinions for Hopledo (levodopa/carbidopa) and Daybu (trofinetide) for Parkinson disease and rare neurodevelopmental indications. These regulatory moves support investment in specialty distribution, sterile manufacturing capacity, and integrated diagnostic-therapeutic pathways across major regions.
Recent Industry Developments in Central Nervous System Therapeutics Market
- July 2026: Biogen and Eisai reported FDA approval of LEQEMBI IQLIK (lecanemab-irmb) subcutaneous injection as an initiation dose for early Alzheimer's disease. The once-weekly subcutaneous option improves usability versus infusion-only regimens and adds site-of-care flexibility for amyloid-targeting therapy delivery.
- April 2026: Johnson and Johnson announced FDA approval of a supplemental NDA for CAPLYTA (lumateperone) supported by new data on reduced risk of relapse in schizophrenia. The label expansion broadens the clinical utility of an established antipsychotic and reinforces lifecycle strategies that defend differentiated branded franchises amid generic pressure in mature CNS categories.
- November 2025: Merck KGaA disclosed a strategic partnership with Valo Health, with more than USD 3 billion in potential payments, to apply AI-enabled discovery capabilities to Parkinson's disease and related neurological disorders. The collaboration indicates continued large-pharma commitment to computational platforms as a lever to improve target selection and productivity in CNS R&D, where clinical failure rates remain structurally high.


Central Nervous System Therapeutics Market Report Scope and Research Methodology
Market Definition and Coverage
This market is defined as the global revenues generated from prescription therapeutics used to treat disorders of the brain and spinal cord, counted at the therapy sales level across major healthcare systems.
Scope exclusions: We exclude non-therapeutic diagnostics and devices, and we also do not count non-CNS indications even if the molecule is used in other therapy areas.
Segments Covered in This Report
- By Therapeutic Class (Value)
- Antidepressants
- Antipsychotics
- Antiepileptics
- Analgesics (Neuropathic & Migraine)
- Disease-Modifying (MS, ALS, etc.)
- Neurodegeneration (AD, PD)
- Others
- By Diseases
- Neurovascular Diseases
- Trauma
- Mental Health
- Anxiety Disorders
- Epilepsy
- Psychotic Disorders
- Other Mental Health Disorders
- Degenerative Diseases
- Alzheimer's Disease
- Parkinson's Disease
- Multiple Sclerosis
- Amyotrophic Lateral Sclerosis
- Other Degenerative Diseases
- Infectious Diseases
- Cancer
- Other Diseases
- By Drug Type (Value)
- Small Molecule
- Biologic /Large Molecule
- By Route of Administration (Value)
- Oral
- Parenteral
- Others
- By Geography (Value)
- North America
- United States
- Canada
- Mexico
- Europe
- Germany
- United Kingdom
- France
- Italy
- Spain
- Rest of Europe
- Asia-Pacific
- China
- India
- Japan
- South Korea
- Australia
- Rest of Asia-Pacific
- South America
- Brazil
- Argentina
- Rest of South America
- Middle East and Africa
- GCC
- South Africa
- Rest of Middle East and Africa
- North America
Data Sources, Market Sizing, and Validation
Desk Research
Desk research started with building the disease and treatment boundary and then mapping the demand pool to measurable, repeatable signals. Public sources such as the World Health Organization, the US FDA drug labels and approvals database, the CDC, and the National Institutes of Health were used to understand condition burden, treatment guidelines, and new therapy availability in a consistent way.
We then reviewed supporting evidence such as company annual reports, investor presentations, and credible medical journals to confirm how revenues are recognized and how therapy use is shifting across key CNS conditions. Where helpful, paid subscriptions for company financials and intelligence, news and financials, and patent databases were used to reduce blind spots around pipeline timing and portfolio mix. The sources listed here are illustrative, and other public and paid references were also used for data collection, validation, and clarification.
Primary Interviews and Surveys
Primary work was completed through structured expert conversations and surveys with a mix of drug manufacturers, distributors, clinicians, and payer or formulary stakeholders, so we could confirm real adoption patterns and pricing behavior. Since this is a global market, inputs were checked across major regions to reconcile differences in access, reimbursement, and therapy switching, and then our assumptions were adjusted only when multiple respondents aligned on the same direction.
Distribution of primary research fieldwork respondents
| Company type | Respondent position | Region |
|---|---|---|
| Top tier: 32% | CXOs: 12% | APAC: 42% |
| Mid tier: 49% | Functional/Unit leaders: 43% | EMEA: 33% |
| Smaller Players: 19% | Managers: 45% | Americas: 25% |
Market-Sizing & Forecasting
The model is built using a top-down and bottom-up approach, where the top-down view reconstructs therapy revenues by linking treated patient pools to typical therapy use and price levels across the main CNS care settings. To keep it practical, we relied on measurable inputs such as diagnosed prevalence trends, therapy class adoption share, typical treatment duration, list price and net price movement, and the timing of major approvals and generic entry.
Once the main totals were formed, they were corroborated with selective bottom-up checks, such as sampled company revenue roll-ups by key CNS portfolios, channel checks on access and refill persistence, and sampled ASP times volume approximations for major therapy classes. Gaps that could not be directly sized were handled through conservative proxy rules, then re-checked against clinical practice signals so totals did not drift away from real-world use.
For forecasting, scenario analysis was used so the outlook reflects different paths for payer coverage, launch uptake, and price erosion, with those scenarios reviewed through expert inputs. Where the data trend was stable for a sub-area, smoothing was applied to avoid overreacting to one-time spikes from launches or short supply events.
Data Validation & Update Cycle
Outputs are validated through triangulation across independent signals, followed by variance checks at regional and therapy class levels so unusual jumps are explained before finalization. If a region shows a mismatch with expected demand indicators, we re-check the assumptions, revisit the desk sources, and reconnect with experts to confirm whether a policy change, launch, or pricing shift is driving it.
Each report goes through multi-step analyst reviews, where the logic, math, and scope are checked separately before sign-off. Reports are refreshed annually, and interim updates are made when material events occur. Before delivery, a fresh pass is completed so clients receive the latest updated view rather than an older snapshot.
Mordor Intelligence's Central Nervous System Therapeutics Market Size Compared With Other Published Estimates
Published CNS therapeutics market values often differ because the underlying boundary is not always the same, and small scope choices can add up quickly at a global level. Differences also come from how each estimate treats pricing, the timing of approvals, and whether revenues are counted broadly or only within selected conditions.
Key gap drivers in this market usually include whether mental health and pain-related therapies are fully included, how net price versus list price is handled, and whether the forecast assumes faster or slower uptake for new therapies. Currency conversion timing and the refresh cadence also matter, since a single year of policy updates or major launches can shift reported totals when the model is not re-checked against demand signals.
Benchmark comparison
| Source | Market Size | Gaps in Research Methodology |
|---|---|---|
| Mordor Intelligence | USD 143.32 B (2026) | |
| Industry Publisher A | USD 107.00 B (2024) | Uses an earlier base year and a broader headline framing that does not clearly show which CNS therapy categories are counted, which can undercount areas where pricing and access changed after 2024. |
| Trade Journal B | USD 80.00 B (2025) | Reported as an approximate sales milestone, and the figure appears to reflect selected CNS sales drivers rather than a complete condition and class coverage with consistent regional roll-ups. |
Prescription and sales trend checks, along with therapy class mix validation gathered through expert feedback, are what tie Mordor Intelligence to a defined CNS demand pool instead of a headline sales figure. When the scope is aligned and price logic is made explicit, the spread across sources becomes easier to explain and the final number stays traceable to clear inputs.


Key Questions Answered in the Report
What is the current valuation and growth outlook for the central nervous system therapeutics space?
The segment is valued at USD 143.32 billion in 2026 and is projected to climb to USD 197.35 billion by 2031, reflecting a 6.62% CAGR.
Which therapeutic class is expanding the fastest?
Disease-modifying therapies are forecast to grow at a 6.83% CAGR through 2031 as payers and clinicians prioritize treatments that slow or alter disease progression.
Why is Alzheimer's disease drawing heightened investment?
Regulatory acceptance of amyloid-targeting drugs such as lecanemab and donanemab has created a new treatment category, positioning Alzheimers as the fastest-growing indication at a 7.05% CAGR.
How do biologics compare with small molecules in future growth?
Although small molecules still hold over 70% revenue share, biologics including gene and antibody therapiesare advancing at a 7.52% CAGR thanks to improvements in brain delivery technologies.
Which region is expected to contribute most to incremental revenues?
Asia-Pacific is projected to record a 7.78% CAGR to 2031, driven by China's regulatory reforms, Japans fast-track pathways, and expanding healthcare access across emerging economies.
What competitive trend is reshaping deal activity?
Large pharmaceutical companies are acquiring or partnering with biotech firms that possess differentiated mechanisms, exemplified by multi-billion-dollar transactions for schizophrenia, gene, and psychedelic programs.
Page last updated on:


 Your data is secure and never sold or shared.


