Molybdenum Market Size and Share
Market Overview
| Study Period | 2021 - 2031 |
|---|---|
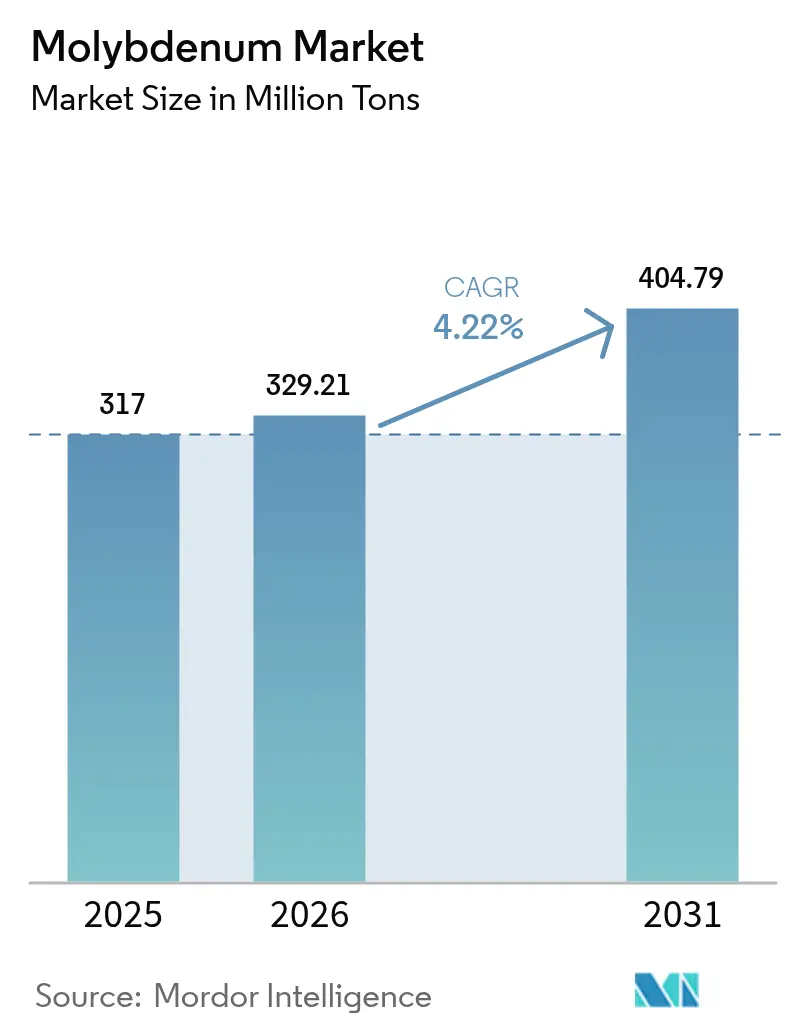
| Market Volume (2026) | 329.21 Million tons |
| Market Volume (2031) | 404.79 Million tons |
| Growth Rate (2026 - 2031) | 4.22% CAGR |
| Fastest Growing Market | Asia Pacific |
| Largest Market | Asia Pacific |
| Market Concentration | Medium |
Major Players *Disclaimer: Major Players sorted in no particular order Image © Mordor Intelligence. Reuse requires attribution under CC BY 4.0. | |
Molybdenum Market Analysis by Mordor Intelligence
The Molybdenum Market size was valued at 317 Million tons in 2025 and is estimated to grow from 329.21 Million tons in 2026 to reach 404.79 Million tons by 2031, at a CAGR of 4.22% during the forecast period (2026-2031). Demand is widening as high-strength low-alloy (HSLA) steels become standard in automotive and pipeline projects, while corrosion-resistant alloys with ≥6% Mo are specified for deep-water energy equipment. High-purity molybdenum powder now under a Chinese export licence supports hypersonic-vehicle programs, shifting supply-chain bargaining power toward integrated producers. Downstream, petroleum refiners are refreshing hydrodesulfurization catalysts, and green-hydrogen developers are scaling molybdenum disulfide electrodes, both supporting above-trend growth in chemical uses. At the same time, additive-manufacturing and semiconductor manufacturers are absorbing fine-particle metal powder whose oxygen content must remain below 1,500 ppm, creating a premium sub-market insulated from bulk price swings.
Key Report Takeaways
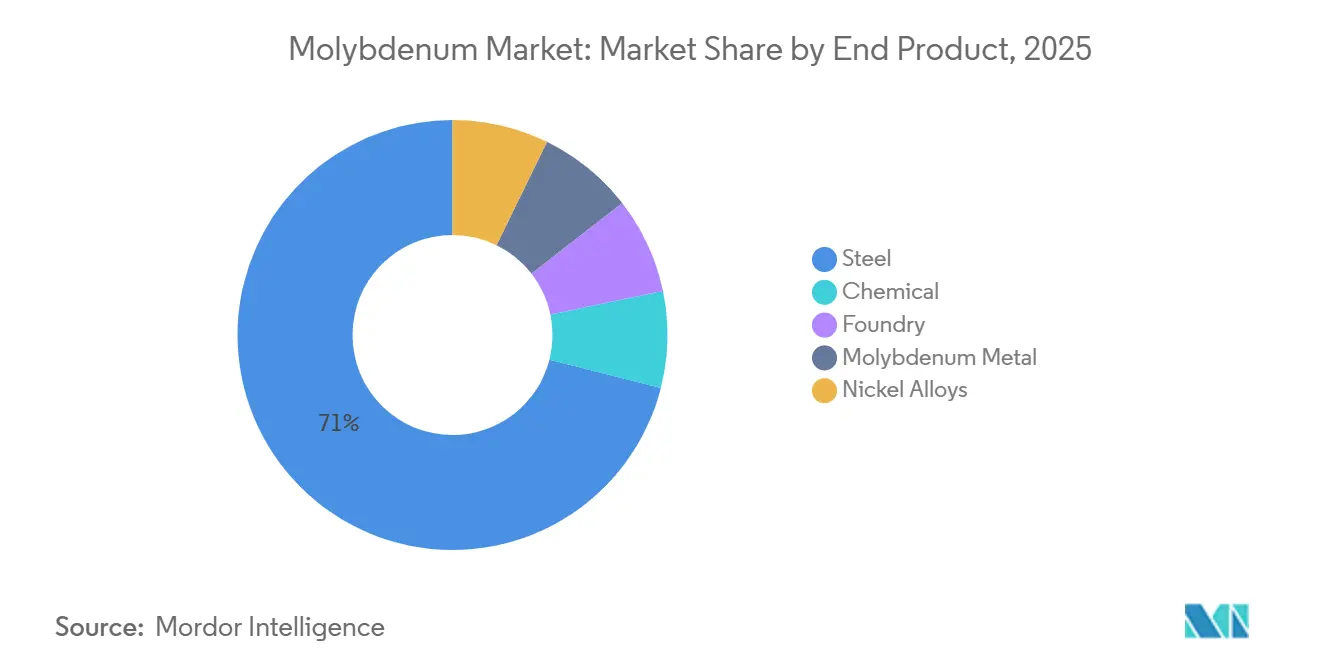
- By end product, steel commanded 71.08% of the molybdenum market share in 2025; the chemical is forecast to expand at a 4.71% CAGR through 2031.
- By product form, ferromolybdenum led with a 39.31% contribution to the molybdenum market size in 2025, while molybdenum metal powder is advancing at a 4.78% CAGR to 2031.
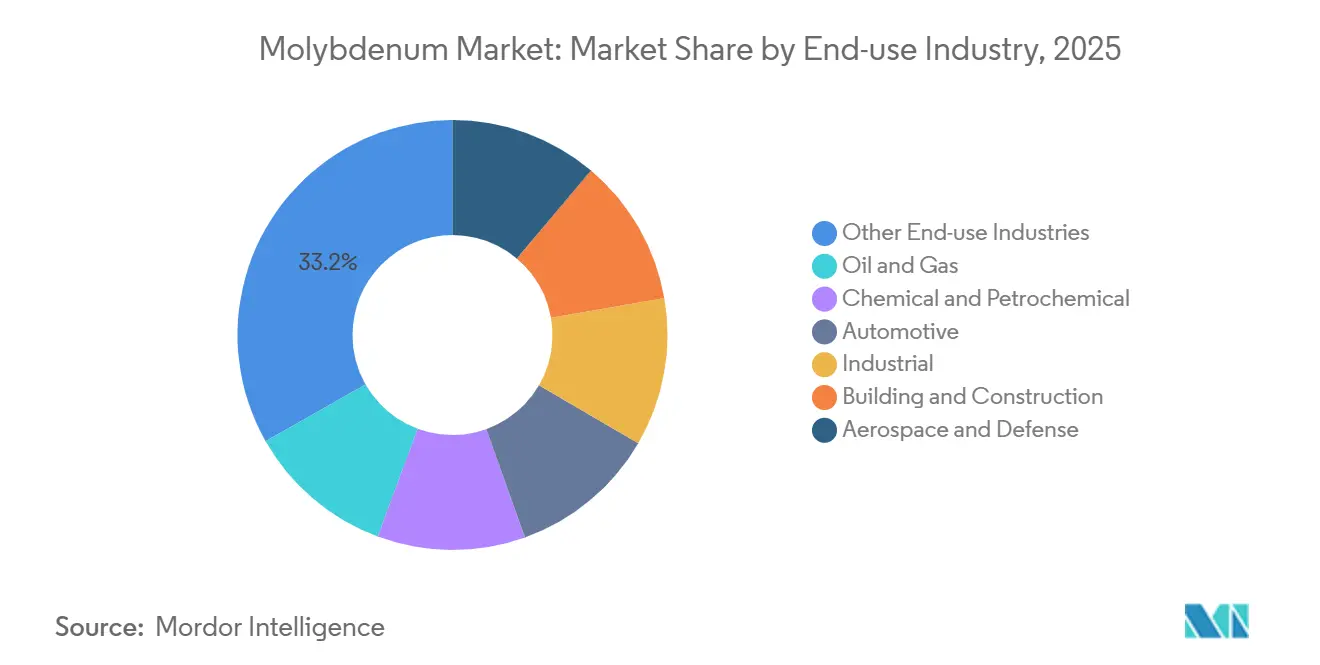
- By end-use industry, other end-use industries held 33.22% of the molybdenum market share in 2025, and aerospace and defense is projected to grow at a 4.82% CAGR through 2031.
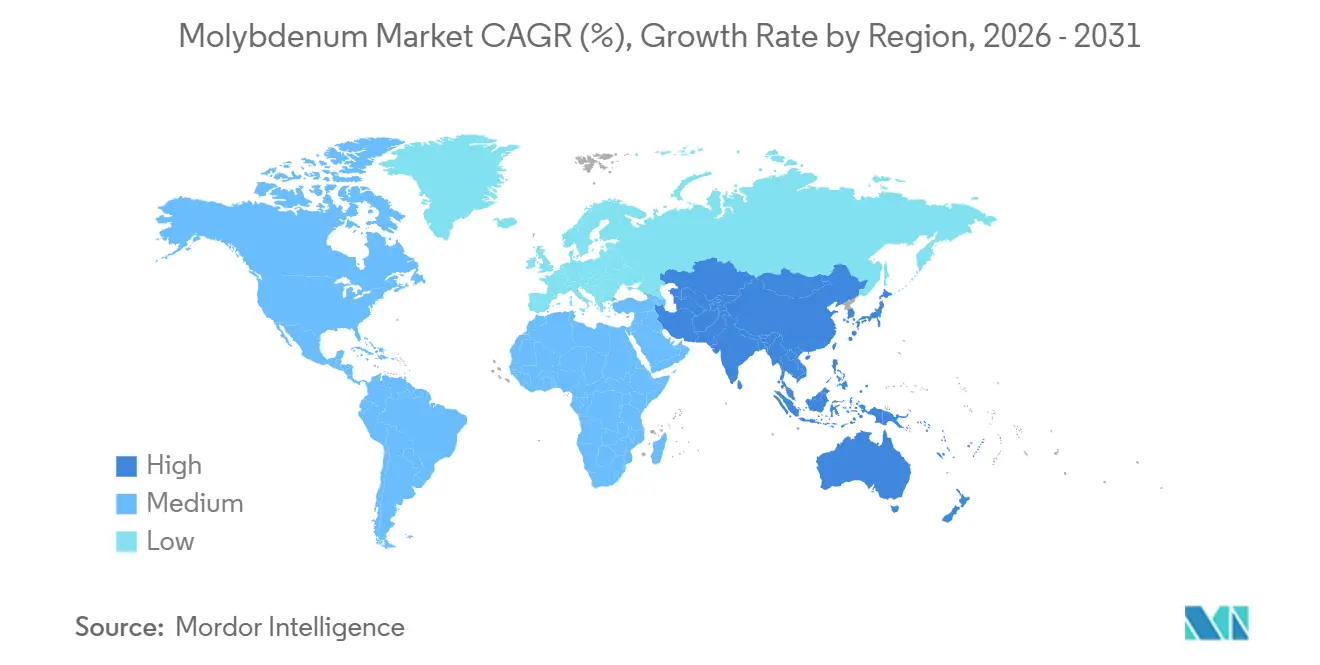
- By geography, Asia-Pacific held 54.08% of the molybdenum market share in 2025 and is projected to grow at a 4.90% CAGR through 2031.
Note: Market size and forecast figures in this report are generated using Mordor Intelligence’s proprietary estimation framework, updated with the latest available data and insights as of 2026.
Global Molybdenum Market Trends and Insights
Drivers Impact Analysis*
| Driver | (~) % Impact on CAGR Forecast | Geographic Relevance | Impact Timeline |
|---|---|---|---|
| Surge in high-strength low-alloy steel demand | +1.2% | Global, with concentration in Asia-Pacific and North America | Medium term (2-4 years) |
| Growth in renewable-energy installations needing Mo alloys | +0.9% | Global, led by Europe, China, and North America | Long term (≥4 years) |
| Deep-water oil and gas expansion boosting corrosion-resistant alloys | +0.7% | North America (Gulf of Mexico), South America (Brazil pre-salt), West Africa | Medium term (2-4 years) |
| EV power-electronics heat sinks using high-temp Mo parts | +0.6% | Asia-Pacific (China, South Korea), Europe, North America | Short term (≤2 years) |
| Hypersonic-weapon thermal shields requiring Mo-Re alloys | +0.5% | United States, China, Russia | Long term (≥4 years) |
| Source: Mordor Intelligence | |||
Surge in High-Strength Low-Alloy Steel Demand
HSLA steels with 0.15-0.30% Mo are replacing carbon grades in automotive body-in-white and long-distance pipe, where weight reduction and weldability trim total ownership cost. Molybdenum additions refine austenite grain size and accelerate ferrite nucleation, enabling more than 550 MPa yield strength without ductility loss. China’s provincial upgrades toward specialty steels and North American electric-arc furnaces, following automotive lightweighting mandates, together add incremental ferromolybdenum demand. Asia-Pacific remains the epicenter, followed by North America, where new pipeline integrity rules reinforce uptake.
Growth in Renewable-Energy Installations Needing Mo Alloys
Wind-turbine gearboxes and solar-thermal receiver tubes specify Mo-bearing stainless and nickel alloys to survive cyclic thermal stress and aggressive heat-transfer fluids. The National Renewable Energy Laboratory tags molybdenum as critical in CSP receivers operating above 550 °C. Duplex stainless foundations for offshore wind in the North Sea and East China Sea likewise push Mo intensity higher, a trend acknowledged in the European Commission’s critical-materials roadmap. As renewable megawatts climb, so does demand for Mo-rich alloys.
Deep-Water Oil and Gas Expansion Boosting Corrosion-Resistant Alloys
HPHT projects in the Gulf of Mexico, Brazil’s pre-salt, and West Africa specify UNS N10276 or N06625 alloys that require more than 6% Mo to keep PREN above 40, preventing localized corrosion in sour environments[1]Bureau of Safety and Environmental Enforcement, “HPHT Materials Report,” bsee.gov. Nickel-molybdenum alloys safeguard subsea manifolds and flowlines designed for more than 15,000 psi, securing a steady pull on molybdenum concentrates and oxide despite volatility in crude prices.
EV Power-Electronics Heat Sinks Using High-Temp Mo Parts
Inverters and on-board chargers generate heat fluxes more than 100 W/cm²; molybdenum heat spreaders, with 138 W/m·K conductivity and an expansion coefficient near SiC, lower junction temperatures by 15 °C compared with aluminum, extending SiC device life. Asian gigafactories and European Tier-1 suppliers are therefore procuring fine molybdenum powder for sintered base plates, pushing short-term consumption.
Restraints Impact Analysis*
| Restraint | (~) % Impact on CAGR Forecast | Geographic Relevance | Impact Timeline |
|---|---|---|---|
| High raw-material and conversion cost | -0.8% | Global, with acute pressure in regions lacking domestic ore | Short term (≤2 years) |
| Tightening mining and environmental regulations | -0.6% | North America, Europe, China | Medium term (2-4 years) |
| China's strategic export licensing on select Mo powders | -0.4% | Global, excluding China | Short term (≤2 years) |
| Source: Mordor Intelligence | |||
High Raw-Material and Conversion Cost
Spot oxide prices climbed to USD 48,300/t in June 2025 as Chilean and Peruvian supply tightened. Roasting and reduction together account for up to 40% of conversion cost, and independents without captive power see margins compress when prices spike. Regions relying on imports face added freight and duty charges, limiting new capacity even during demand surges.
Tightening Mining and Environmental Regulations
EPA Effluent Guidelines cap metals discharge and mandate filtered tailings in the United States, while the Global Tailings Standard requires perpetual monitoring and MCE design worldwide[2]United States Environmental Protection Agency, “Ore Mining Effluent Guidelines,” epa.gov . In China, Henan and Shaanxi are imposing stricter soil-remediation rules, and Canada’s BC authorities demand ISO 14001 compliance. Higher capital intensity stretches project timelines and slows greenfield approvals.
*Our forecasts treat driver/restraint impacts as directional, not additive. The impact forecasts reflect baseline growth, mix effects, and variable interactions.
Segment Analysis
By End Product: Steel Dominates but Chemical Accelerates
Steel absorbed 71.08% of 2025 consumption as minor Mo additions lift yield strength and temper resistance. The chemical segment is pacing faster at 4.71% CAGR because refineries refresh hydrodesulfurization catalysts and electrolyzer builders adopt MoS₂ electrodes. This trajectory suggests that catalytic and electrochemical niches will capture disproportionate volume increments through 2031. Steel will hold numerical leadership, yet downstream value will concentrate around high-purity chemical derivatives that command premium pricing.
Demand diversity also insulates the molybdenum market from single-sector swings. Even if automotive steel moderates, refinery catalyst turnover, battery anode commercial trials, and supercapacitor programs provide offsetting pulls. Such dispersion stabilizes the overall molybdenum market size outlook.


By Product Form: Ferromolybdenum Leads, Metal Powder Surges
Ferromolybdenum held 39.31% of the 2025 volume because it integrates seamlessly into steel furnaces. Molybdenum metal powder, however, is growing at a field-leading 4.78% CAGR, reflecting additive-manufacturing, semiconductor, and heat-sink adoption. End users pay 30-50% premiums for D50 15-45 µm powders with ≤0.15% oxygen, creating a price corridor detached from bulk oxide benchmarks.
Concentrate and roasted oxide remain swing-supply bridges between mine output and converters, yet their growth mirrors mining cycles more than demand fundamentals. The powder segment’s ascent, therefore, signals a structural lift in value perception within the molybdenum market.
By End-use Industry: Aerospace and Defense Sets the Growth Pace
Other End-use Industries— energy Generation and storage, electronics and semiconductors, etc.—held the largest 2025 share at 33.22%, reflecting molybdenum’s versatility. Aerospace and defense, however, claims the fastest path forward at a 4.82% CAGR as hypersonic-vehicle programs proliferate. Even moderate procurement volumes move the needle, given the 60-70% Mo content in Mo-Re billets. Oil and gas, chemicals, and automotive round out diversified baseline demand, anchoring the molybdenum market against cyclical shocks.
Geography Analysis
Asia-Pacific consumed 54.08% of global volume in 2025 and is advancing at 4.90% CAGR to 2031. China continues to dominate through specialty-steel upgrades, electrolyzer builds, and semiconductor expansions. India’s highway and renewable megaprojects complement demand, while Japan and South Korea pull high-purity feed for electronics and shipbuilding.
In North America, U.S. hypersonic and space initiatives, HPHT subsea projects in the Gulf of Mexico, and Canada’s oil-sands infrastructure keep molybdenum intensity high despite modest steel-output growth.
Europe is anchored by Germany’s machinery exports, the U.K.’s aerospace cluster, and Italy’s stainless-steel mills. Wind-foundation demand in the North Sea and nuclear refurbishment in France sustain alloy use, even as overall steel capacity flatlines. Rest-of-World demand remains nascent but rises in tandem with Brazilian pre-salt developments and Middle-East petrochemical investments.

Competitive Landscape
Vertically integrated copper-moly producers—Freeport-McMoRan, China Molybdenum, Codelco, GRUPO MÉXICO, and Antofagasta plc—control about 54% of primary ore, supporting moderate consolidation. Freeport’s Henderson and Climax mines lead dedicated production, while China Molybdenum’s Tenke Fungurume expansions add byproduct optionality. Specialty processors such as Molymet dominate ultra-low-impurity oxide, whereas Jinduicheng and Climax target semiconductor-grade powder.
Chinese export licensing on ≥97%-pure powder reshapes downstream competition: Western aerospace primes now seek U.S. or Chilean feed, granting integrated Western miners greater leverage. ESG credentials grow more consequential as the Copper Mark extends assurance to byproduct streams and buyers audit against ISO 14001 and the Global Tailings Standard.
Molybdenum Industry Leaders
Antofagasta plc
China Molybdenum Co. Ltd.
Codelco
Freeport-McMoRan
GRUPO MÉXICO
- *Disclaimer: Major Players sorted in no particular order

Recent Industry Developments
- September 2025: Almonty Industries Inc., a global producer of tungsten essential to the U.S. defense and technology sectors, initiated a large-scale drilling program at its Sangdong Molybdenum Project in Yeongwol, Gangwon Province, South Korea. The program aimed to gather data to determine whether molybdenum mineral reserves could be confirmed for potential future production.
- July 2025: Air Liquide successfully started operations at a new plant in Hwaseong, Gyeonggi Province, South Korea. This molybdenum manufacturing facility, the largest globally, supplied semiconductor customers with its advanced materials offering, Subleem.


Global Molybdenum Market Report Scope
Molybdenum is a silver-gray metal typically mined as a by-product of copper and tungsten extraction. Molybdenum improves strength, hardenability, weldability, toughness, increased temperature strength, and corrosion resistance when added to steel and cast irons.
The Molybdenum Market is segmented by end product, product form, end-use industry, and geography. By end product, the market is segmented into steel, chemical, foundry, molybdenum metal, and nickel alloys. By product form, the market is segmented into ferromolybdenum, molybdenum concentrates, roasted molybdenum (technical oxide), molybdenum metal powder, and molybdenum chemicals. By end-use industry, the market is segmented into oil and gas, chemical and petrochemical, automotive, industrial, building and construction, aerospace and defense, and other end-use industries (energy generation and storage, electronics and semiconductors, etc.). The report also covers market size and forecasts for molybdenum in 12 countries across major regions. For each segment, the market sizing and forecasts have been done on the basis of volume (tons).
| Steel |
| Chemical |
| Foundry |
| Molybdenum Metal |
| Nickel Alloys |
| Ferromolybdenum |
| Molybdenum Concentrates |
| Roasted Molybdenum (Technical Oxide) |
| Molybdenum Metal Powder |
| Molybdenum Chemicals |
| Oil and Gas |
| Chemical and Petrochemical |
| Automotive |
| Industrial |
| Building and Construction |
| Aerospace and Defense |
| Other End-use Industries (Energy Generation and Storage, Electronics and Semiconductors, etc.) |
| China |
| United States |
| Chile |
| Peru |
| Mexico |
| Armenia |
| Other Producer Countries |
| Asia-Pacific | China |
| India | |
| Japan | |
| South Korea | |
| Rest of Asia-Pacific | |
| North America | United States |
| Canada | |
| Mexico | |
| Europe | Germany |
| United Kingdom | |
| Italy | |
| France | |
| Russia | |
| Rest of Europe | |
| Rest of the World | South America |
| Middle-East and Africa |
| By End Product | Steel | |
| Chemical | ||
| Foundry | ||
| Molybdenum Metal | ||
| Nickel Alloys | ||
| By Product Form | Ferromolybdenum | |
| Molybdenum Concentrates | ||
| Roasted Molybdenum (Technical Oxide) | ||
| Molybdenum Metal Powder | ||
| Molybdenum Chemicals | ||
| By End-use Industry | Oil and Gas | |
| Chemical and Petrochemical | ||
| Automotive | ||
| Industrial | ||
| Building and Construction | ||
| Aerospace and Defense | ||
| Other End-use Industries (Energy Generation and Storage, Electronics and Semiconductors, etc.) | ||
| By Geography (Production Analysis) | China | |
| United States | ||
| Chile | ||
| Peru | ||
| Mexico | ||
| Armenia | ||
| Other Producer Countries | ||
| By Geography (Consumption Analysis) | Asia-Pacific | China |
| India | ||
| Japan | ||
| South Korea | ||
| Rest of Asia-Pacific | ||
| North America | United States | |
| Canada | ||
| Mexico | ||
| Europe | Germany | |
| United Kingdom | ||
| Italy | ||
| France | ||
| Russia | ||
| Rest of Europe | ||
| Rest of the World | South America | |
| Middle-East and Africa | ||


Key Questions Answered in the Report
What is the size of the molybdenum market?
The molybdenum market size is 329.21 million tons in 2026 and is forecast to reach 404.79 million tons by 2031, at a 4.22% CAGR.
Which end-user industry is growing the quickest?
Aerospace and defense lead with a projected 4.82% CAGR thanks to hypersonic-vehicle and turbine-engine demand.
Why is Asia-Pacific the largest consumer of molybdenum?
China’s specialty-steel upgrades, India’s infrastructure pipeline, and Japan’s electronics output collectively push the region’s share above 50%.
What role does molybdenum play in renewable energy?
Renewable energy strengthens duplex stainless for offshore wind and forms key alloys and catalysts in concentrated solar power and green-hydrogen plants.
Page last updated on:


