Molecular Weight Marker Market Size and Share
Market Overview
| Study Period | 2020 - 2031 |
|---|---|
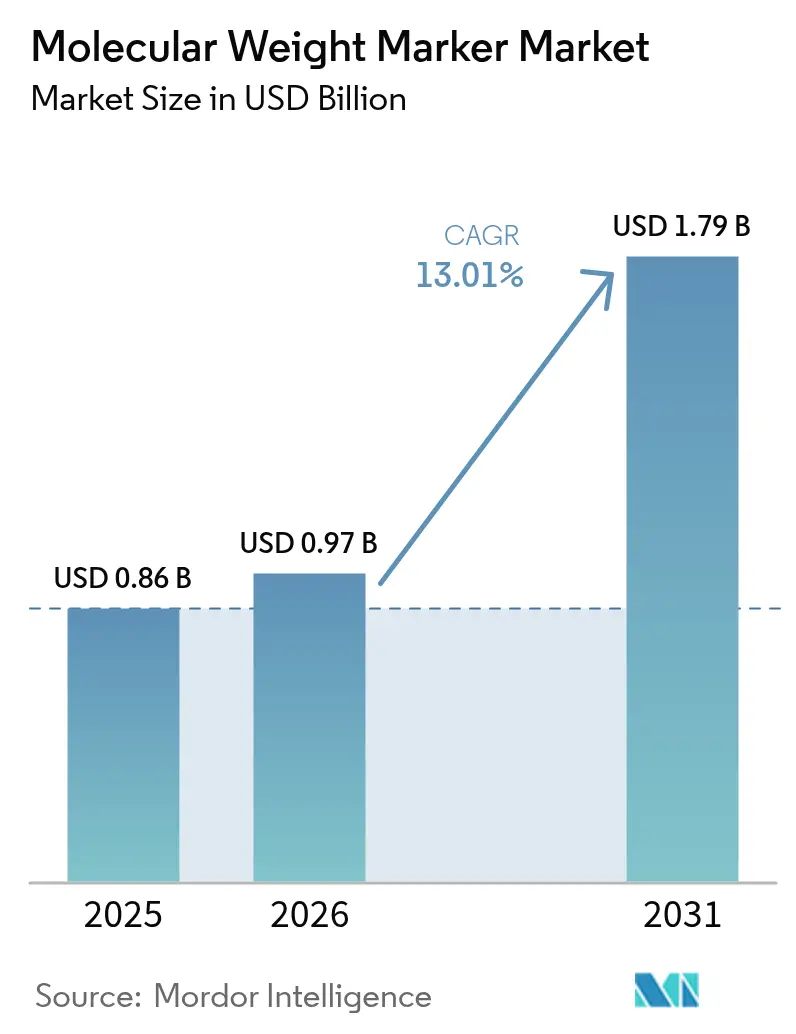
| Market Size (2026) | USD 0.97 Billion |
| Market Size (2031) | USD 1.79 Billion |
| Growth Rate (2026 - 2031) | 13.01% CAGR |
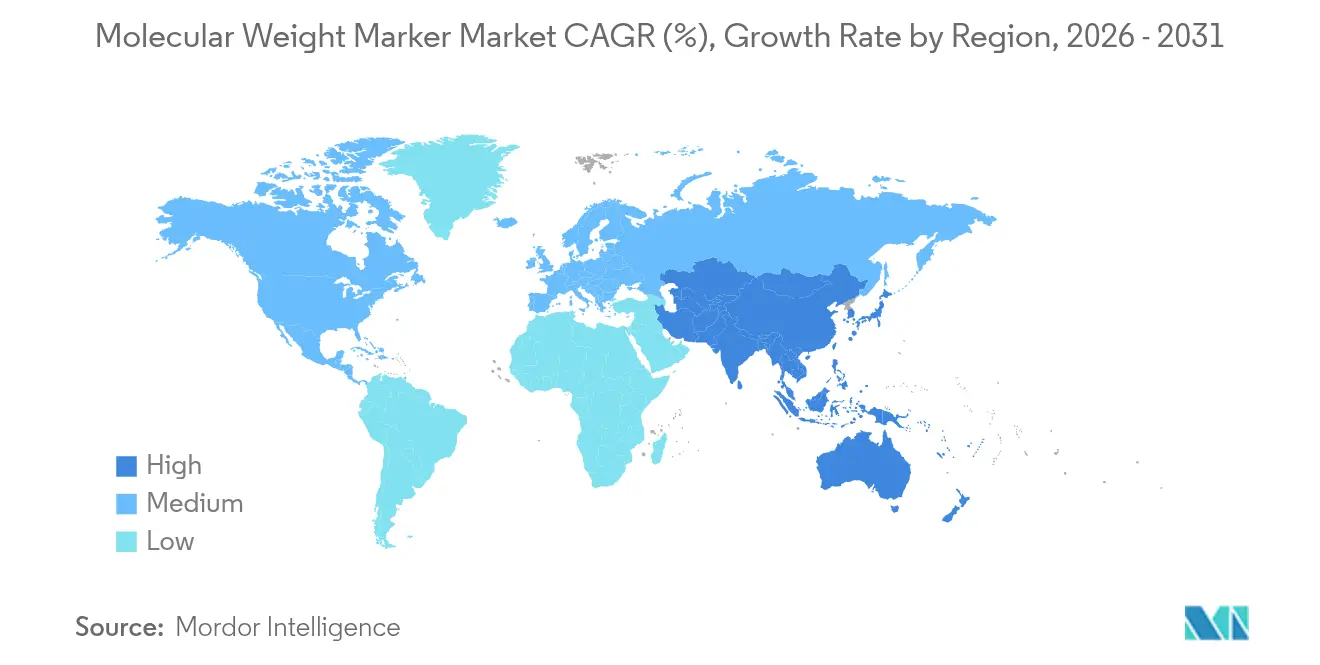
| Fastest Growing Market | Asia Pacific |
| Largest Market | North America |
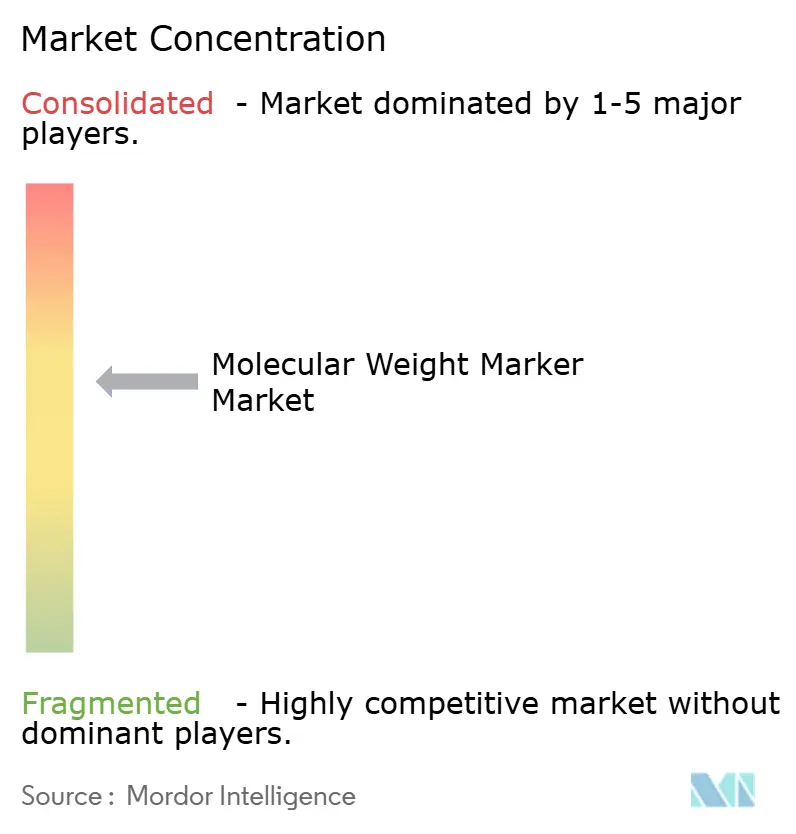
| Market Concentration | Medium |
Major Players *Disclaimer: Major Players sorted in no particular order Image © Mordor Intelligence. Reuse requires attribution under CC BY 4.0. | |
Molecular Weight Marker Market Analysis by Mordor Intelligence
The global molecular weight markers market size in 2026 is estimated at USD 0.97 billion, growing from 2025 value of USD 0.86 billion with 2031 projections showing USD 1.79 billion, growing at 13.01% CAGR over 2026-2031. This rapid advance reflects the convergence of genomics R&D funding, expanding molecular diagnostics volumes and stringent cell- and gene-therapy quality‐control protocols that elevate demand for highly standardized ladders. AI-ready blot-imaging platforms are reshaping laboratory preferences toward fluorescent protein and DNA ladders that deliver consistent, machine-readable signals. The North American innovation ecosystem anchors early adoption, yet ambitious population-scale genomics programs in Asia-Pacific generate the largest incremental volume gains. Vendors are responding with vertically integrated offerings that bundle traditional electrophoresis consumables with automation, informatics and ready-to-use chemistries to mitigate skilled-labor shortages and regulatory complexity. These competitive moves position the molecular weight markers market at the center of emerging multi-omics workflows, creating new revenue pools as point-of-care (POC) diagnostics, microfluidic devices and continuous bioprocessing migrate from proof-of-concept to commercial deployment.
Key Report Takeaways
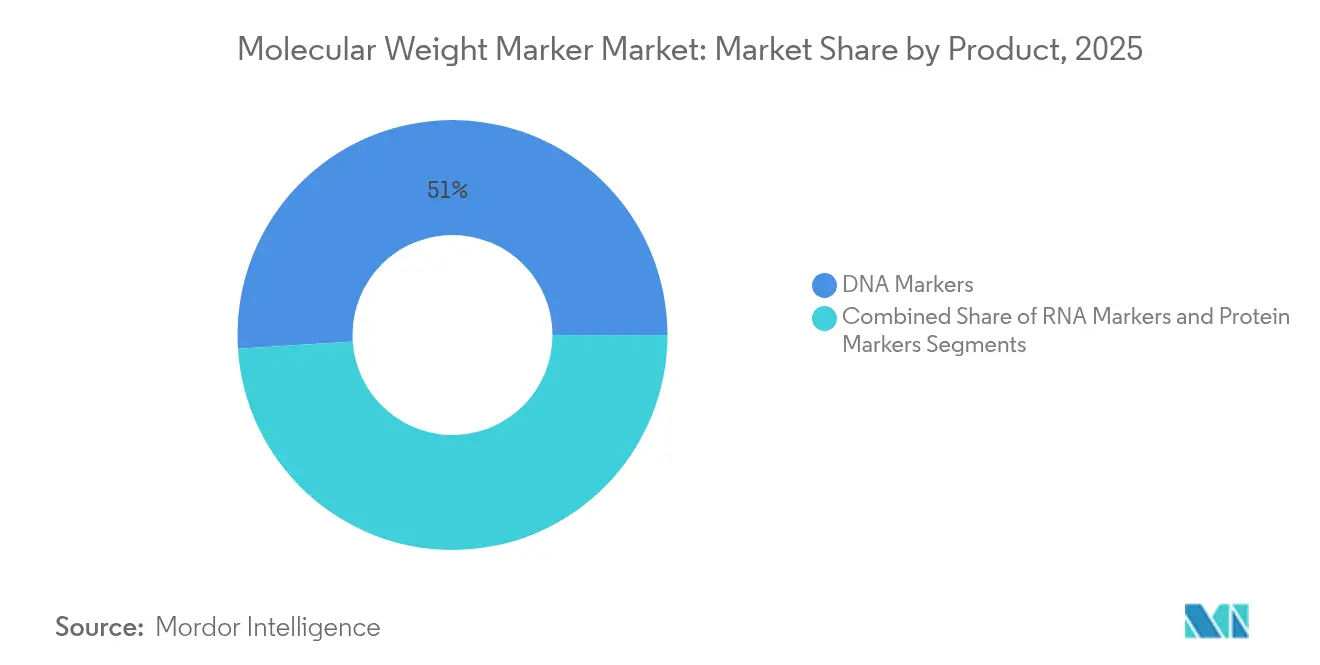
- By product, DNA markers held 51.02% of the molecular weight markers market share in 2025 while RNA markers are projected to expand at a 14.02% CAGR to 2031.
- By application, nucleic-acid assays accounted for 60.10% of the molecular weight markers market size in 2025; proteomics applications are advancing at a 14.52% CAGR through 2031.
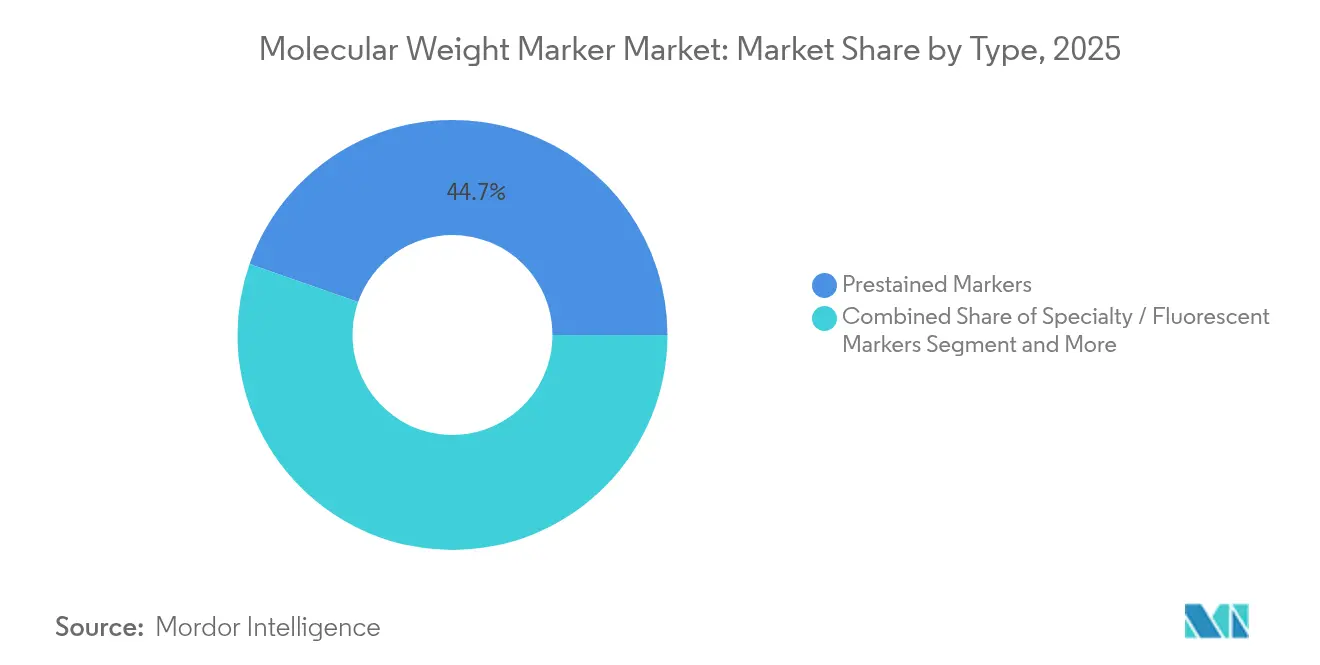
- By type, prestained ladders dominated with a 44.65% revenue share in 2025, whereas specialty fluorescent ladders are forecast to grow at 13.86% CAGR over the same horizon.
- By end-user, pharmaceutical and biotechnology companies captured 34.78% revenue share in 2025; clinical and diagnostic laboratories record the highest projected CAGR at 15.2% to 2031.
- By geography, North America led with 37.95% share of the molecular weight markers market in 2025, and Asia-Pacific posts the fastest-growing regional CAGR at 14.3% through 2031.
Note: Market size and forecast figures in this report are generated using Mordor Intelligence’s proprietary estimation framework, updated with the latest available data and insights as of 2026.
Global Molecular Weight Marker Market Trends and Insights
Drivers Impact Analysis*
| Driver | (~) % Impact on CAGR Forecast | Geographic Relevance | Impact Timeline |
|---|---|---|---|
| Rising global R&D expenditure in genomics & proteomics | +3.2% | North America, Asia-Pacific | Long term (≥ 4 years) |
| Expanding molecular diagnostics volumes (PCR/NGS) | +2.8% | North America, Europe | Medium term (2-4 years) |
| Wider availability of ready-to-use prestained ladders | +1.9% | Global | Short term (≤ 2 years) |
| Cell- & gene-therapy QC protocols requiring high-accuracy DNA ladders | +2.1% | North America, Europe, Asia-Pacific | Medium term (2-4 years) |
| Mini-gel platforms in POC devices increasing low-range marker demand | +1.6% | Developed markets first | Short term (≤ 2 years) |
| AI-driven blot-imaging software pushing need for fluorescent protein ladders | +1.4% | North America, Europe expanding worldwide | Medium term (2-4 years) |
| Source: Mordor Intelligence | |||
Rising Global R&D Expenditure in Genomics & Proteomics
Government-funded genomics programs are scaling sequencing output and standardizing analytical workflows. Japan plans to profile 100,000 cancer genomes within five years, requiring consistent molecular weight markers to harmonize data across institutions[1]Yuki Katsuya, “Current and Future Trends in Whole Genome Sequencing in Cancer,” cancerbiomed.org. India’s 10,000-genome initiative employs the CARE ethical framework, favoring high-accuracy DNA ladders compatible with community oversight. The US National Nanotechnology Initiative earmarked USD 2.16 billion in 2024, part of which underwrites biotech tools such as molecular weight standards for nano-enabled drug design. AI-centric research budgets further amplify demand because machine-learning pipelines require uniform input quality to train reliable biomarker-discovery models.
Expanding Molecular Diagnostics Volumes (PCR/NGS)
POC and decentralized laboratories are increasing throughput and shortening turnaround times. A PCB-based real-time PCR chip heats at 8°C/s with ±0.1°C accuracy, enabling single-use assays that depend on low-range molecular weight ladders tailored to rapid runs. The Dragonfly LAMP-LAMP platform attains 96.1% viral-detection sensitivity in portable form factors, triggering demand for prestained ladders that remain stable in field conditions. High-throughput NGS workflows, such as the myeloMATCH trial, require robust DNA ladders to confirm library integrity ahead of same-day reporting. Microfluidic “lab-on-a-chip” systems finish nucleic-acid analysis within 28 minutes at USD 9.5 per test, pushing suppliers to package markers in single-use cartridges that align with cost-sensitive diagnostic economics.
Wider Availability of Ready-to-Use Prestained Ladders
Laboratories coping with staffing gaps adopt ready-to-use consumables that cut preparation steps. Vendors now offer color-coded multichannel formats, integrating loading dye and density reagents to shrink run times by 12–15%. Shelf-life optimizations through glycerol-free formulations allow ambient shipping, a feature essential for emerging-market labs lacking cold-chain logistics. Educational institutions lean on these ladders to streamline teaching labs, introducing early-career scientists to standardized molecular weight markers market workflows without elaborate preparation.
Cell & Gene-Therapy QC Protocols Require High-Accuracy DNA Ladders
Regulators mandate precise host-cell DNA quantification for viral-vector and mRNA products. The FDA notes that human-cell residual DNA carries elevated oncogenic risk, enforcing strict variant-size acceptance limits that only high-resolution DNA ladders satisfy. CRISPR-Cas9 edits often insert concatemeric sequences that are detectable only when ladders cover large size ranges with minimal migration variance. Continuous bioprocessing initiatives integrate online electrophoresis to approve batches in real time, pressuring marker vendors to design products compatible with automated sampling interfaces.
Restraints Impact Analysis*
| Restraint | (~) % Impact on CAGR Forecast | Geographic Relevance | Impact Timeline |
|---|---|---|---|
| Shortage of skilled electrophoresis technicians | −1.8% | North America, Europe | Short term (≤ 2 years) |
| Stringent reagent-grade regulatory certifications (IVDR, USP) | −1.4% | Europe, Global | Medium term (2-4 years) |
| Batch variability triggers reproducibility audits in pharma QA | −1.1% | Global pharma hubs | Medium term (2-4 years) |
| Shift toward microfluidic & capillary-electrophoresis systems | −0.9% | Developed markets | Long term (≥ 4 years) |
| Source: Mordor Intelligence | |||
Shortage of Skilled Electrophoresis Technicians
US molecular labs reported 13.4% unfilled positions in 2024, slowing test throughput and prompting automation investments. Recruitment challenges raise labor costs, so managers prefer single-tube, prestained ladders that cut prep steps. Academic collaborations are emerging to expand certification programs, but pipelines will take several years to stabilize. In Europe, retirement waves compound deficits, especially in rural hospitals where travel distances deter potential hires.
Stringent Reagent-Grade Regulatory Certifications (IVDR, USP)
The European IVDR demands extensive clinical evidence for in-vitro reagents, lengthening dossier timelines. In parallel, the US FDA tightened impurity testing for high-risk excipients, requiring batch-specific certificates for diethylene glycol and ethylene glycol[2]Mopa Esuga, “Ensuring Product Safety: FDA Guidance,” qualitymatters.usp.org. Vendors must validate new analytical methods while managing dual auditing cycles, a burden particularly acute for small and medium enterprises active in the molecular weight markers industry.
*Our forecasts treat driver/restraint impacts as directional, not additive. The impact forecasts reflect baseline growth, mix effects, and variable interactions.
Segment Analysis
By Product: RNA Markers Drive Innovation Wave
RNA markers are registering the fastest 14.02% CAGR to 2031 as mRNA vaccine pipelines mature and next-generation sequencing (NGS) protocols become ubiquitous. Accurate poly(A) tail and capping-efficiency verification relies on well-defined ladders that cover a broad 100–10,000 nt range, elevating adoption among therapeutic developers. DNA markers retained 51.02% molecular weight markers market share in 2025 due to entrenched PCR, cloning and Southern-blot routines. However, demand is shifting toward high-molecular-weight formats that resolve CRISPR-induced genomic alterations in synthetic biology programs. Protein markers benefit from rising proteomics funding, exemplified by Thermo Fisher’s Olink acquisition, which added 5,300 biomarkers to high-throughput screening pipelines and invigorated need for calibrated protein ladders.
Commercial laboratories value prestained protein ladders that remain visible without staining, saving 30 minutes per run and improving lab productivity when technician bandwidth is scarce. Academic groups exploring structural proteomics increasingly adopt fluorescent dual-channel ladders to align with multiplex imaging systems. Meanwhile, RNA researchers prioritize nuclease-free packaging to maintain ladder integrity, prompting suppliers to shift toward foil-wrapped, single-use vials that eliminate freeze-thaw degradation.


By Application: Proteomics Surges Past Traditional Boundaries
Proteomics applications are advancing at 14.52% CAGR, narrowing the historical dominance of nucleic-acid workflows. Western blotting remains the primary use case, yet emerging disciplines such as top-down proteomics, ribosome profiling and thermal-shift assays now employ ladders for size confirmation in complex matrices. Automated gel extraction robots integrated with AI analysis cut sample-band excision time by 40%, driving greater ladder consumption per experiment. Nucleic-acid assays maintain a 60.10% share of the molecular weight markers market size, upheld by pandemic-era PCR capacity that persists for respiratory-virus surveillance.
In POC environments, 15-minute laser-heated PCR cycles require snap-cooling ladders that migrate predictably under rapid thermal transitions. Southern and Northern blotting remain relevant in epigenetics and long-read validation studies, respectively, but sequence-direct detection continues to pull some volume away. Researchers therefore prefer universal ladders covering overlapping size ranges for both nucleic-acid and protein analyses to streamline inventory.
By Type: Specialty Markers Capitalize on Technology Convergence
Prestained ladders held 44.65% revenue share in 2025 because they eliminate post-run staining, a key advantage in high-throughput labs. Specialty fluorescent ladders are growing by 13.86% CAGR as AI-enabled imaging gains traction. Dual-dye formulations allow simultaneous DNA and protein visualization, facilitating combined transcriptomics-proteomics assays within a single gel. Unstained ladders cater to workflows directing gel slices to downstream mass spectrometry, where prestaining chemicals would interfere with ionization efficiency.
Photostable fluorescent markers minimize photobleaching during repeated imaging cycles, crucial for time-course studies spanning several hours. Colorimetric prestaining remains popular in teaching labs where immediate visual confirmation matters more than quantitative precision. Manufacturers are experimenting with lyophilized pellets that rehydrate in sample buffer, extending shelf life to three years without refrigeration—a feature aligned with field diagnostics and low-resource settings.
By End-User: Clinical Labs Accelerate Diagnostic Integration
Clinical and diagnostic laboratories are projected to grow at 15.2% CAGR through 2031 as decentralized testing expands and reimbursement codes cover rapid molecular panels. POC instruments with built-in micro-gels are adopted by urgent-care clinics and mobile health units, increasing ladder demand in ready-made cartridge form. Pharmaceutical and biotechnology firms retained 34.78% market share in 2025 due to active gene-therapy pipelines that mandate rigorous QC, including residual host-cell DNA analysis.
Academic institutes drive fundamental discoveries and often test experimental ladder formats, serving as proving grounds for new formulations before commercial rollout. Contract research organizations (CROs) maintain varied ladder inventories to accommodate client protocols, representing a stable if fragmented demand base. Workforce shortages push all end-users toward automation-friendly consumables, elevating interest in bar-coded vials that integrate with laboratory information systems for traceability.
Geography Analysis
North America controlled 37.95% of the molecular weight markers market in 2025, supported by a mature biotech ecosystem, sustained federal R&D allocations and early adoption of AI-driven laboratory automation. The USD 2.16 billion 2024 National Nanotechnology Initiative budget underwrites molecular analysis tools, including size standards for nanoformulation research. M&A activity, exemplified by Thermo Fisher’s USD 3.1 billion Olink integration, consolidates consumables portfolios and funnels resources into high-throughput proteomics. Yet a 13.4% vacancy rate in molecular diagnostics laboratories compels facilities to adopt turnkey ladders that minimize manual intervention. FDA guidance on batch uniformity further escalates quality expectations, favoring suppliers with validated, lot-stable products.
Asia-Pacific is the fastest-expanding region at 14.3% CAGR through 2031, underpinned by government-sponsored population genomics and the rise of indigenous vaccine manufacturing. Japan’s 100,000-genome program and India’s CARE-guided 10,000-genome initiative call for cross-lab standardization, boosting demand for high-precision DNA ladders. China’s lung-cancer profiling work integrates germline-somatic mutation data, broadening applications for dual-size DNA and RNA ladders. Regional manufacturers focus on cost-optimized POC platforms, stimulating a parallel requirement for compact, lyophilized markers that withstand transit in humid climates.
Europe follows steady growth, benefiting from collaborative research networks and an emphasis on sustainability. IVDR implementation harmonizes quality standards, rewarding companies with robust documentation structures. AI-assisted gel analysis projects from leading universities amplify demand for fluorescent ladders compatible with automated imaging pipelines. Environmental directives prompt suppliers to reduce hazardous dyes and shift toward plant-derived pigments in prestained products, aligning with EU Green Deal objectives.

Competitive Landscape
The molecular weight markers market demonstrates moderate consolidation as global suppliers pursue acquisitions to broaden multi-omics portfolios. Thermo Fisher strengthened its proteomics position through the USD 3.1 billion Olink uptake, integrating >5,300 validated protein biomarkers with existing ladder lines. Agilent augmented oligonucleotide and CRISPR services by acquiring BIOVECTRA for USD 925 million, signaling intent to co-develop size standards tuned to gene-editing workflows. QIAGEN’s plan to launch three sample-preparation instruments demonstrates strategic alignment between automation and consumable sales; the QIAsymphony Connect platform processes up to 96 samples, creating a pull-through effect for bar-coded ladder cartridges.
Emergent competitors focus on specialty fluorescent ladders optimized for AI analytics, carving out high-margin niches despite lower absolute volumes. Contract manufacturers in South Korea and Singapore ramp up OEM production, offering private-label prestained ladders with ISO 13485 certification to Western brands seeking cost advantages. Demand-planning data suggest top five vendors command about 55% of global revenues, leaving room for regional specialists targeting clinical labs and academic customers with tailored formulations.
Innovation pipelines emphasize lyophilized, single-dose ladders that reconstitute instantly, addressing cold-chain gaps in sub-Saharan Africa and Southeast Asia. Vendors also explore biodegradable gel capsules to reduce plastic waste, collaborating with academic partners to validate performance parity. White-space opportunities persist in capillary electrophoresis standards, where high-conductivity fluorescent dyes can improve detector sensitivity, especially for peptide mapping.
Molecular Weight Marker Industry Leaders
Promega Corporation
Merck KGaA (MilliporeSigma)
Thermo Fisher Scientific Inc.
QIAGEN N.V.
Bio-Rad Laboratories Inc.
- *Disclaimer: Major Players sorted in no particular order

Recent Industry Developments
- March 2025: Nature Communications reported 96.1% sensitivity for the Dragonfly portable diagnostic platform using lyophilized LAMP assays, confirming the shift toward field-ready molecular workflows.
- January 2025: QIAGEN detailed plans for QIAsymphony Connect, QIAsprint and QIAmini sample-preparation systems, each designed to streamline oncology and genomics workflows and minimize hands-on time.


Global Molecular Weight Marker Market Report Scope
As per the scope of the report, molecular-weight markers are a set of standards that are used to identify the approximate size of a molecule run on a gel during electrophoresis. Protein, DNA, and RNA molecular weight markers are commercially available.
The molecular weight marker market is segmented by product, application, type, and geography. The product segment is sub-segmented into DNA marker, protein marker, and RNA marker. The application segment is sub-segmented into nucleic acid application and proteomics application. The type segmented is further divided into prestained marker, unstained marker, and specialty marker. The geography segment is further divided into North America, Europe, Asia-Pacific, the Middle East and Africa, and South America. The report also covers the estimated market sizes and trends for 17 different countries across major regions globally. The report offers the value (USD) for all the above segments.
| DNA Markers |
| Protein Markers |
| RNA Markers |
| Nucleic-Acid Applications | PCR |
| Northern Blotting | |
| Southern Blotting | |
| Molecular Cloning | |
| Other Nucleic-Acid Apps | |
| Proteomics Applications | Western Blotting |
| Gel Extraction | |
| Other Proteomics Apps |
| Prestained Markers |
| Unstained Markers |
| Specialty / Fluorescent Markers |
| Academic & Research Institutes |
| Pharmaceutical & Biotechnology Companies |
| Contract Research Organizations |
| Clinical & Diagnostic Laboratories |
| North America | United States |
| Canada | |
| Mexico | |
| Europe | Germany |
| United Kingdom | |
| France | |
| Italy | |
| Spain | |
| Rest of Europe | |
| Asia-Pacific | China |
| Japan | |
| India | |
| South Korea | |
| Australia | |
| Rest of Asia-Pacific | |
| Middle East and Africa | GCC |
| South Africa | |
| Rest of Middle East and Africa | |
| South America | Brazil |
| Argentina | |
| Rest of South America |
| By Product | DNA Markers | |
| Protein Markers | ||
| RNA Markers | ||
| By Application | Nucleic-Acid Applications | PCR |
| Northern Blotting | ||
| Southern Blotting | ||
| Molecular Cloning | ||
| Other Nucleic-Acid Apps | ||
| Proteomics Applications | Western Blotting | |
| Gel Extraction | ||
| Other Proteomics Apps | ||
| By Type | Prestained Markers | |
| Unstained Markers | ||
| Specialty / Fluorescent Markers | ||
| By End User | Academic & Research Institutes | |
| Pharmaceutical & Biotechnology Companies | ||
| Contract Research Organizations | ||
| Clinical & Diagnostic Laboratories | ||
| Geography | North America | United States |
| Canada | ||
| Mexico | ||
| Europe | Germany | |
| United Kingdom | ||
| France | ||
| Italy | ||
| Spain | ||
| Rest of Europe | ||
| Asia-Pacific | China | |
| Japan | ||
| India | ||
| South Korea | ||
| Australia | ||
| Rest of Asia-Pacific | ||
| Middle East and Africa | GCC | |
| South Africa | ||
| Rest of Middle East and Africa | ||
| South America | Brazil | |
| Argentina | ||
| Rest of South America | ||


Key Questions Answered in the Report
What is the current size of the molecular weight markers market?
The molecular weight markers market size stands at USD 0.97 billion in 2026, with a forecast value of USD 1.79 billion by 2031.
Which region leads global revenue?
North America leads with 37.95% share owing to sustained biotech funding and rapid adoption of AI-enabled laboratory automation.
Which product segment is growing fastest?
RNA ladders show the highest growth, registering a 14.02% CAGR through 2031 as mRNA-based therapeutics and NGS workflows scale.
Why are fluorescent protein ladders gaining attention?
AI-driven gel-imaging platforms require consistent fluorescent signals for automated band detection, boosting demand for specialty fluorescent ladders.
How are workforce shortages influencing market demand?
Laboratory staffing gaps push institutions toward ready-to-use, automation-friendly ladders that shorten preparation time and reduce the need for specialized electrophoresis expertise.
Page last updated on:


