Modular Data Center Market Size and Share
Market Overview
| Study Period | 2020 - 2031 |
|---|---|
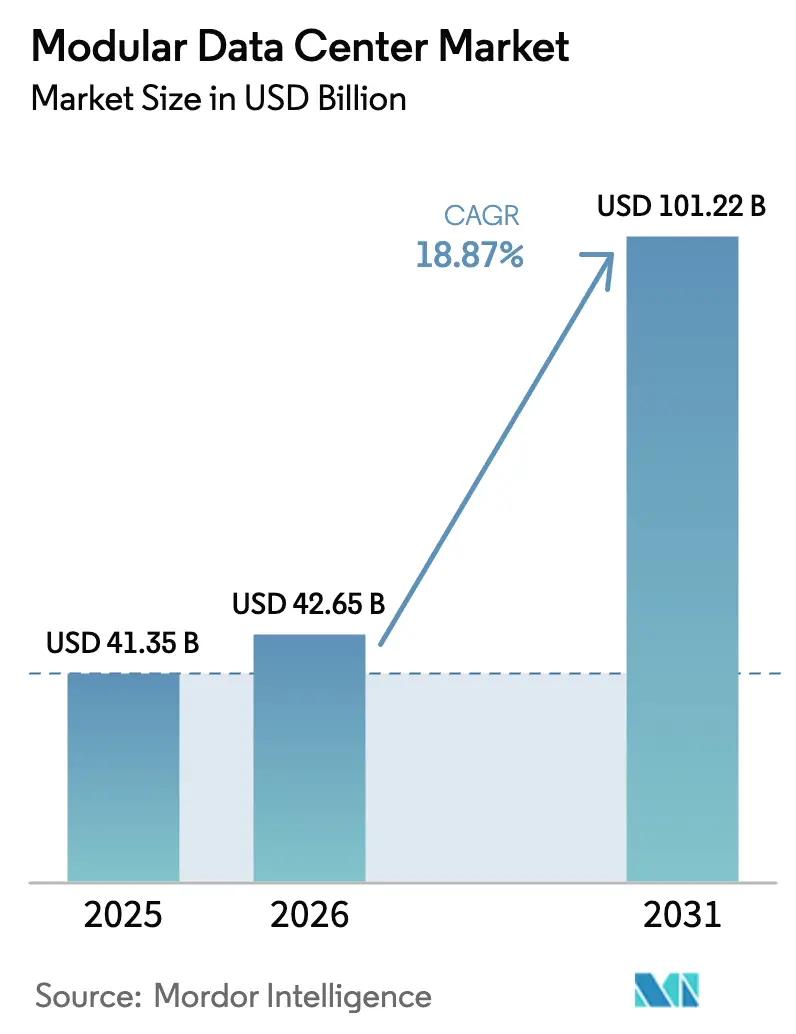
| Market Size (2026) | USD 42.65 Billion |
| Market Size (2031) | USD 101.22 Billion |
| Growth Rate (2026 - 2031) | 18.87% CAGR |
| Fastest Growing Market | Asia Pacific |
| Largest Market | North America |
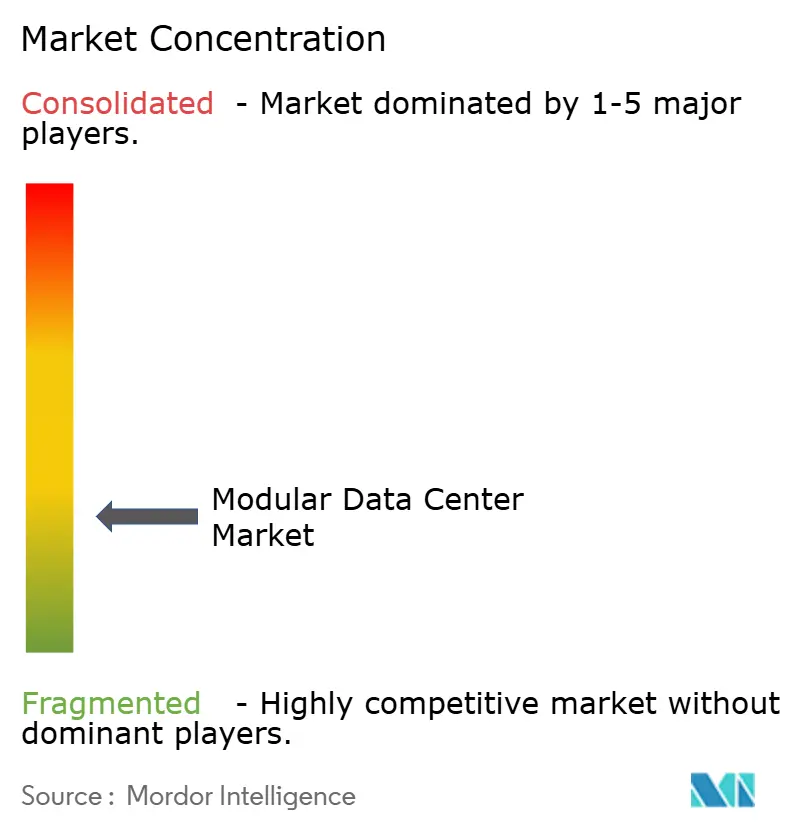
| Market Concentration | Low |
Major Players *Disclaimer: Major Players sorted in no particular order Image © Mordor Intelligence. Reuse requires attribution under CC BY 4.0. | |
Modular Data Center Market Analysis by Mordor Intelligence
The Modular Data Center Market size was valued at USD 41.35 billion in 2025 and is estimated to grow from USD 42.65 billion in 2026 to reach USD 101.22 billion by 2031, at a CAGR of 18.87% during the forecast period (2026-2031).
Accelerated demand stems from artificial-intelligence training clusters, stringent data-sovereignty laws, and the operational need to activate capacity in months rather than years. Functional hardware modules still anchor revenue, yet operators now emphasize lifecycle services that optimize assets, compress unplanned downtime, and spread costs across operating budgets. Edge-computing deployments close to 5G macro sites, liquid-cooled GPU pods exceeding 40 kW per rack, and micro-regional sovereign-cloud nodes together create a durable growth runway, while circular-economy directives push vendors toward designs that facilitate disassembly, reuse, and secondary-market trade. Competitive differentiation is shifting from iron and steel to software-defined orchestration, predictive maintenance, and direct-to-chip or immersion thermal strategies, even as hyperscalers negotiate renewable-energy tariffs and locational tax abatements to offset rising power prices.
Key Report Takeaways
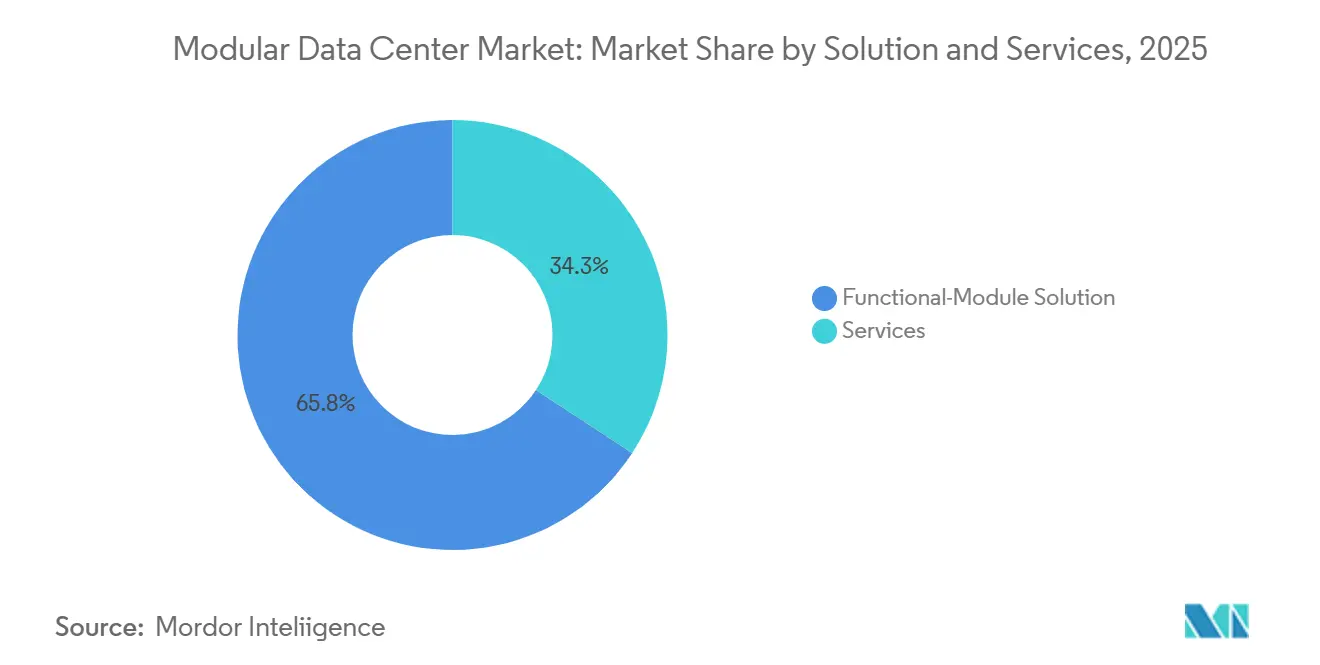
- By solution, functional-module solution led with 65.75% revenue share in 2025, whereas services are forecast to expand at a 19.42% CAGR through 2031.
- By application, data-center expansion accounted for 38.78% of the modular data center market share in 2025, while hyperscale edge and AI-focused high-performance computing workloads are advancing at a 19.87% CAGR to 2031.
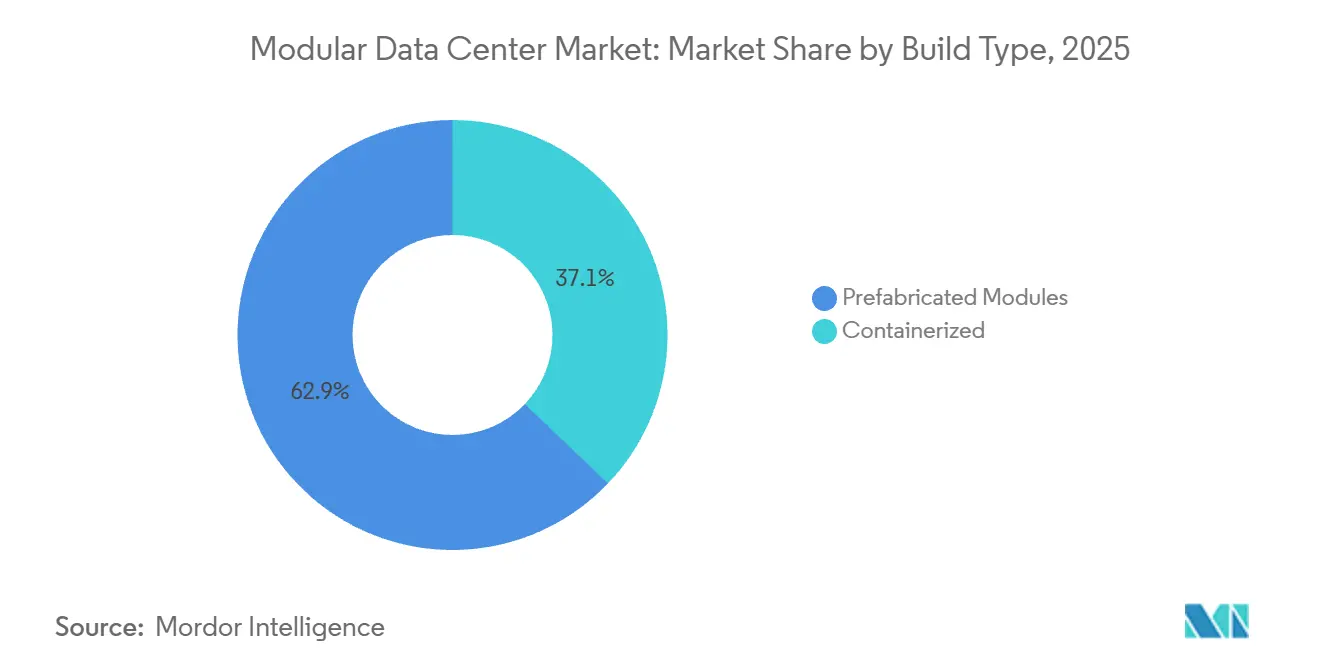
- By build type, prefabricated formats accounted for 62.87% of the modular data center market in 2025; containerized modules are projected to post a 19.53% CAGR between 2026-2031.
- By deployment type, indoor all-in-one units held 55.68% share of the modular data center market size in 2025, whereas outdoor skid-mounted systems are expanding at a 19.62% CAGR through 2031.
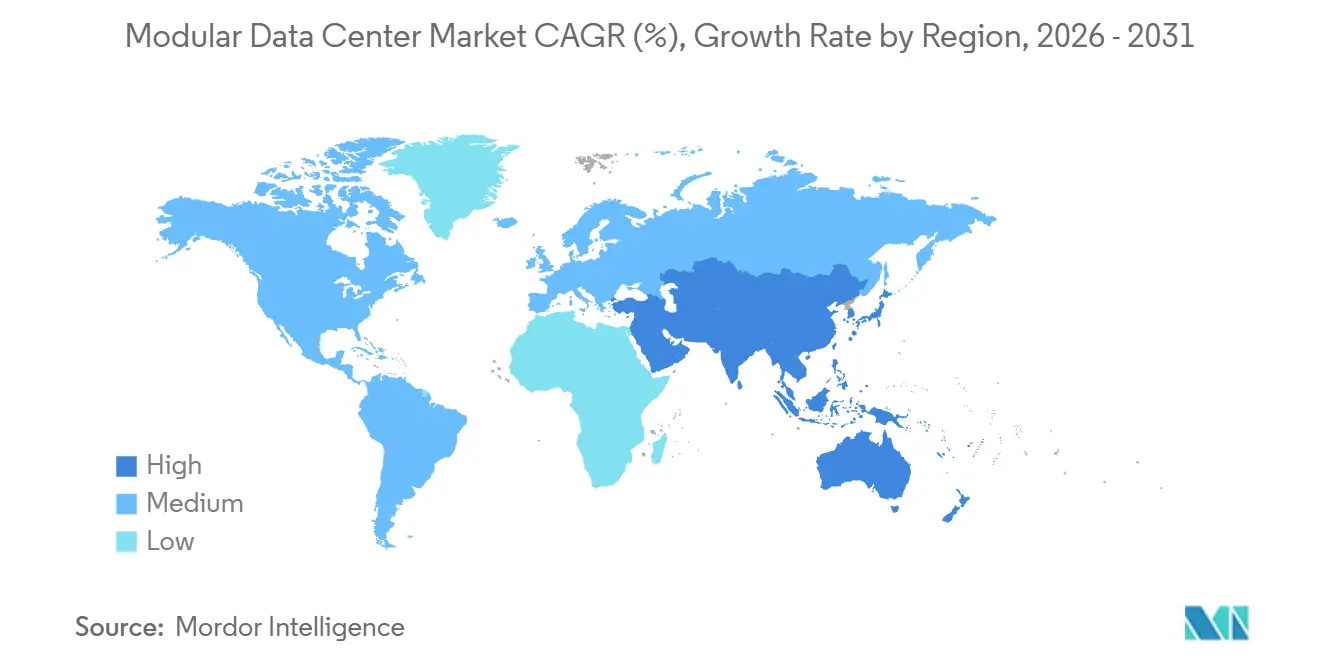
- By geography, North America maintained a 40.12% revenue share in 2025, and Asia-Pacific is forecast to register a 20.02% CAGR through 2031.
Note: Market size and forecast figures in this report are generated using Mordor Intelligence’s proprietary estimation framework, updated with the latest available data and insights as of January 2026.
Market Trends and Insights
Drivers Impact Analysis of Modular Data Center Market*
| Driver | (~) % Impact on CAGR Forecast | Geographic Relevance | Impact Timeline |
|---|---|---|---|
| AI-Driven High-Density Liquid-Cool Modules | +4.20% | Global, concentrated in North America and Asia-Pacific | Medium term (2-4 years) |
| Rapid Edge-Computing Rollout | +3.80% | Global, spill-over to Middle East and Africa | Short term (≤ 2 years) |
| Hyperscale and Cloud Adoption Surge | +3.50% | North America, Europe, Asia-Pacific core | Medium term (2-4 years) |
| 5G-Triggered Quick-Build Demand | +2.90% | Asia-Pacific, Middle East, South America | Short term (≤ 2 years) |
| Data-Sovereignty Micro-Regional Builds | +2.10% | Asia-Pacific, Middle East and Africa, South America | Long term (≥ 4 years) |
| Circular Economy Mandates Driving Reuse | +1.60% | Europe, North America | Long term (≥ 4 years) |
| Source: Mordor Intelligence | |||
AI-Driven High-Density Liquid-Cool Modules
Graphics-accelerated workloads routinely push rack densities past 40 kW, a level that conventional air systems cannot support without breaching energy budgets. Direct-to-chip cold plates, rear-door heat exchangers, and single-phase immersion loops now ship pre-integrated inside factory-built enclosures, enabling modules to host 700 W accelerators today and roadmap-ready 1,000 W devices tomorrow.[1]Ian Buck, “GPU Roadmap Drives Liquid Cooling,” NVIDIA, nvidia.com Schneider Electric’s liquid-aware orchestration dynamically regulates flow rates and fan curves, producing power-usage-effectiveness (PUE) ratios near 1.15, versus 1.4 for legacy air designs. Vertiv pilots in 2025 trimmed facility energy use by 30% by coupling coolant telemetry with machine-learning fault prediction. Adoption is spreading to sovereign-cloud builds in China, where ZTE modules pair immersion baths with modular power trunks, sustaining sub-10 ms inference latency for large-language models. A tightening supply chain for pumps, heat exchangers, and dielectric fluids is creating lead-time risk that operators must hedge through multisourcing contracts.
Rapid Edge-Computing Rollout
Latency targets of 10 ms for autonomous mobility, computer vision analytics, and industrial IoT are pushing compute outward from regional hyperscale campuses. Pre-engineered units can reach power-on in 6 to 9 months, one-third the time of a conventional build, letting operators seize a first-mover advantage in unserved metros.[2]“Edge Computing and Modular Integration,” Uptime Institute, uptimeinstitute.com Hewlett Packard Enterprise bundled Edgeline servers into containerized shells that process 4K traffic-camera feeds in Dubai, cutting backhaul payloads by 60%. Dell’s APEX nodes, fortified for outdoor deployment, extend cloud functions into rural India where last-mile fiber is sparse. Mobile network operators, on pace to exceed 10 million 5G base stations by 2027, co-locate micro-data centers with radio sites to uphold ultra-reliable low-latency service objectives.[3]“5G Deployment Statistics,” GSMA, gsma.com Yet thin field-service coverage and a scarcity of on-premises engineers escalate reliance on out-of-band monitoring and autonomous remediation software.
Hyperscale and Cloud Adoption Surge
Amazon Web Services, Microsoft Azure, and Google Cloud now account for roughly 60% of global cloud infrastructure spend, and their roadmaps increasingly favor modular arrays to drip-feed capacity in 5-10 MW slabs. Staged rollouts mitigate utilization risk and align capital with bookings, especially in regions where fiber or power availability remains fluid. Azure’s modular campus in Norway combined hydropower with prefabricated halls to achieve carbon neutrality within a year. Google’s containerized CDN nodes in Latin America improved last-mile latency by 40% for São Paulo users. Hybrid-cloud strategies further boost demand, because corporations can spin up on-premise modules that satisfy residency mandates while tethering to public cloud backbones for burst capacity.
5G-Triggered Quick-Build Demand
Standalone 5G slices supporting augmented reality, vehicle-to-everything, and remote-surgery applications require compute within a few hops of the radio towers. Containerized enclosures keep pace with RAN upgrades and often bypass full building-code review by qualifying as temporary structures. China Mobile fielded 500 units across provincial capitals in 2025, driving end-to-end latency below 5 ms for industrial automation pilots. In India, Airtel deployed outdoor modules incorporating solar arrays and lithium-ion backup to maintain 99.9% uptime on weak grids. Middle Eastern telcos pursuing Vision 2030 digital agendas used prefabricated blocks to launch cloud-gaming services without constructing central facilities hundreds of kilometers away.
Restraints Impact Analysis of Modular Data Center Market*
| Restraint | (~) % Impact on CAGR Forecast | Geographic Relevance | Impact Timeline |
|---|---|---|---|
| High Upfront CAPEX and Vendor Lock-In | -2.80% | Global, acute in South America and Africa | Short term (≤ 2 years) |
| Grid-Capacity and Permitting Bottlenecks | -2.30% | North America, Europe, Asia-Pacific urban centers | Medium term (2-4 years) |
| Power-Efficiency and Sustainability Gaps | -1.50% | Europe, North America | Medium term (2-4 years) |
| Limited Customisation for Mega-Facilities | -1.10% | Global, centered in hyperscale projects | Long term (≥ 4 years) |
| Source: Mordor Intelligence | |||
High Upfront CAPEX and Vendor Lock-In
Factory integration, crating, and specialized power or cooling assemblies add a 20-30% premium per megawatt to modular data centers compared to stick-built halls. For small and medium enterprises with limited balance sheets, financing hurdles push workloads toward colocation cages rather than proprietary modules. Proprietary coolant manifolds, busways, and control software harden switching costs, exposing operators to stranded assets if strategic pivots dictate alternative ecosystems. A 2025 operator survey found that two-fifths delayed adoption primarily due to lock-in concerns, and worried about parts availability once product lines sunset. Emerging leasing models shift capex to opex, yet trade off operational autonomy, a bargain risk-averse firms often decline.
Grid-Capacity and Permitting Bottlenecks
Rapid construction does not guarantee fast energization. Interconnection queues in Northern Virginia, Dublin, and Singapore have already exceeded 2 years, forcing developers either to self-generate or accept curtailment clauses that weaken uptime guarantees. Ireland’s ongoing moratorium drove several projects to relocate to provincial towns where fiber backhaul is less dense, diluting the edge latency proposition. New municipal ordinances in Frankfurt, London, and Amsterdam demand renewable power evidence and heat-reuse commitments before green-lighting builds, stretching permitting timelines and adding engineering complexity. In the United States, pending transmission-queue reforms may disadvantage modules that rely on behind-the-meter generation rather than long-term utility contracts, nudging capex up by an estimated 15-25% when private microgrids are bundled into site plans.
*Our forecasts treat driver/restraint impacts as directional, not additive. The impact forecasts reflect baseline growth, mix effects, and variable interactions.
Modular Data Center Market Segment Analysis
By Solution and Services:
Lifecycle Economics Favor Managed OfferingsA functional-module solution led with a 65.75% revenue share in 2025, yet services are forecast to post a 19.42% CAGR as operators pivot toward outcome-based models. Enterprises contract advisory firms to simulate digital twins, quantify thermal pinch points, and right-size redundant feeds before construction, trading modest design fees for lower stranded capital once racks fill out. During integration, factory-acceptance tests now include liquid-loop balancing and dielectric-fluid sampling, steps that avert thermal runaway incidents capable of destroying thousand-dollar accelerators. Managed-service portfolios bundle Internet-of-Things telemetry, machine-learning fault prediction, and spare-parts logistics under fixed annual fees, shifting the risk of unplanned downtime to vendors. These annuity streams, already commanding premium margins, motivate suppliers to prolong module lives through field-upgrade kits and circular-reuse programs, embedding a virtuous cycle that locks customers in for multiple refresh generations.
Functional modules, however, continue to dominate greenfield demand inside the modular data center market. Operators staging growth in 5-10 MW tranches prefer discrete power, cooling, and IT skids that expand piecemeal as bookings materialize. All-in-one containers have particular appeal in bandwidth-constrained geographies where importing multiple subsystems can inflate customs fees. Eaton’s xStorage block, which couples lithium-ion batteries with UPS switchgear, rolled into Australian microgrids and trimmed on-site labor hours by half. The ability to blend modular power trunks from one vendor with GPU pods from another gives colocation providers room to tailor solutions and preserve sourcing leverage, even as advanced liquid-cool modules push them toward deeper vendor partnerships.


By Application:
Edge and AI Pods Outpace Capacity ExpansionsIn 2025, conventional capacity-expansion projects held a 38.78% share; yet hyperscale edge, AI, and high-performance-computing (HPC) pods are projected to outgrow every other use case at a 19.87% CAGR through 2031. Enterprises train foundation models or simulate autonomous vehicles by installing liquid-cooled enclosures housing hundreds of GPUs, thereby shrinking model training cycles from months to weeks. Research consortia embedded modular clusters to support genomics, weather simulation, and computational fluid dynamics, citing faster procurement and easier relocation when grant funding shifts. Disaster-recovery mandates in seismic zones such as Japan and Chile sparked demand for units pre-staged on corporate campuses, ready to assume primary loads within hours of an earthquake.
Starter data centers sized for 50-200 kW IT loads resonate with retailers and healthcare chains launching regional analytics hubs. Packaged pricing of USD 500,000-1.5 million, often bundled with vendor financing, undercuts the internal cost of retrofitting server rooms. Crypto-mining interest cooled after proof-of-stake transitions, yet the same high-density containers now cater to rendering farms and engineering simulation bursts. Overall, the modular data center market for AI-centric workloads is set to more than triple between 2026-2031, remapping vendor roadmaps toward higher-density cooling, ultra-low-latency fabrics, and higher-voltage busways capable of powering next-generation accelerators.
By Build Type:
Containerized Flexibility Compresses Deployment TimelinesPrefabricated halls accounted for 62.87% of revenue in 2025, but containerized units are advancing with a 19.53% CAGR, narrowing the gap as telcos and content-delivery networks pursue portability. Standard 40-foot ISO containers can be railed or trucked to remote mines, offshore rigs, or disaster zones within weeks, providing blast-radius isolation and clear asset boundaries for lease accounting. Delta Electronics delivered 1,000-V DC containerized pods into Chilean lithium mines, where ambient dust routinely destroys open-frame racks. Integrated gensets, dual battery strings, and redundant condensers let operators ride through grid outages lasting days, a critical feature in emerging markets with volatile infrastructure.
Prefabricated modules still dominate in metros where land tenure is secure and grid connections robust. Their steel-and-concrete shells meet long-lived building codes, integrate free-cooling economizers, and frequently achieve PUE below 1.2. Operators often mix both styles of containerized blocks at the network edge, feeding into prefabricated cores located inside carrier hotels. Regulatory nuances also influence choice. Many jurisdictions classify containers as temporary, allowing sub-12-month permitting, while fixed modules must navigate zoning, environmental impact assessments, and community noise reviews. As liquid cooling spreads, container form factors are widening to house coolant distribution units, challenging suppliers to maintain ISO footprint compatibility while offering higher rack counts.
By Deployment Type:
Outdoor Modules Tackle Harsh-Environment ComputeIndoor all-in-one cabinets led the modular data center market share with 55.68% in 2025, favored by banks, insurers, and retail chains retrofitting existing campuses. Controlled-humidity rooms, raised floors, and sound abatement keep acoustic signatures low and permit tighter hot-aisle containment. Yet outdoor modules are on track for a 19.62% CAGR, driven by 5G edge, oil-and-gas telemetry, and military mobile command posts. Huawei’s rugged skid, wrapped in anti-corrosive coatings, bundles solar arrays, lithium iron phosphate batteries, and evaporative coolers, sustaining 45 °C ambient air without performance throttling.
Thermal innovation is closing the efficiency gap. Phase-change panels inside roof cavities absorb heat spikes, while direct adiabatic pads stretch operational envelopes, lowering compressor runtime. Nonetheless, exposure to UV, sand, and humidity inflates upkeep budgets. Field data show filter swaps doubling versus indoor peers, and physical security hardening biometric locks, perimeter fencing, and ballistic panels adds roughly 10-15% to the bill of materials cost. Operators weigh these premiums against the strategic advantage of dropping compute into deserts, jungles, or remote coastlines where no viable structure exists. For many, outdoor modules remain the only pathway to meet strict latency goals across expansive geographic footprints.
Geography Analysis
North America Modular Data Center Market
North America preserved 40.12% of 2025 revenue, anchored by hyperscaler outlays topping USD 150 billion. Modular blocks enabled cloud titans to seed capacity in secondary metros such as Phoenix, Dallas, and Atlanta, where land and power costs undercut those in headline hubs. State-level incentives, including property-tax abatements and renewable-credit multipliers, sharpened the value proposition, while utility interruptible tariffs shaved 15-20% off electricity bills. Ironically, the region’s crown jewel, Northern Virginia, now fights grid headroom shortages exceeding 40 GW, leading developers to bolt natural-gas peakers to sites or accept curtailments that dent uptime targets. Canada’s provinces capitalize on abundant hydropower, luring sustainability-oriented operators to Quebec and British Columbia and spawning a cluster of prefabricated halls co-located with transmission substations. Mexico’s near-shoring wave for North American manufacturing is reviving edge adoption in Monterrey and Tijuana, where modules can be commissioned on the same timeline as new factories.
APAC Modular Data Center Market
Asia-Pacific is primed for a 20.02% CAGR over 2026-2031, driven by national data-sovereignty edicts and capital earmarked for disaster resilience. China’s “East Data, West Computing” scheme diverts workloads to inland provinces flush with wind and solar, sparking modular parks in Gansu and Ningxia that routinely post sub-1.2 PUE. India’s incentive-laden electronics push seeds data-center builds in Pune and Hyderabad, with local integrators supplying racked-and-stacked containers to domestic cloud challengers. Japan’s rooftop installations in Osaka and Fukuoka cater to financial-sector disaster recovery, embedding seismic isolation bearings beneath prefabs to cushion quake shocks. Australia couples solar farms and battery arrays with modules, allowing operators to brand facilities “carbon neutral” from day one, a marketing edge when courting multinational tenants.
EMEA and South America Modular Data Center Market
Europe navigates stringent environmental regulations mandating heat reuse and emissions disclosure. Frankfurt’s power-grid moratorium rerouted investment to Munich and Hamburg, where combined-heat-and-power plants siphon server exhaust for district heating. London maintains colocation magnetism thanks to post-Brexit data-adequacy accords, and modular extensions slip past planning objections by erecting steel-framed shells below skyline sightlines. The Middle East, spearheaded by Saudi Arabia’s Vision 2030, announces giga-projects such as NEOM that integrate carbon-free energy and mixed-use district cooling. Africa’s modular footprint, although small, clusters in Nigeria, Egypt, and South Africa; solar-diesel hybrid containers leapfrog dicey grids to deliver sub-50 ms latency to millions of mobile subscribers. South America rallies around Brazil, where regional cloud availability zones hinge on modular blocks powered by renewable energy through power purchase agreements.

Regulatory Landscape
Regulation affecting modular data centers centers on energy-performance rules, safety standards for integrated electrical systems, and jurisdiction-specific permitting and ownership screens. ANSI/ASHRAE Standard 90.4-2022 Addendum b, approved on Sept 30, 2025, adds clearer compliance expectations for design and operation of data centers, influencing how modular providers document energy and cooling performance during procurement and inspections. In Europe, ramp-up of energy-efficiency obligations, including Germany's Energy Efficiency Act (EnEfG) requirements taking effect in July 2026 (with PUE thresholds for new data centers), reinforces the push toward factory-tested, high-efficiency modular power and cooling blocks and raises the bar for measurement and reporting at commissioning.
In the United States, state and federal actions add permitting and eligibility layers for large-load deployments. The White House issued an executive action in July 2025 aimed at accelerating federal permitting for data center infrastructure, while states are also formalizing their own frameworks. Pennsylvania published GRID Standards in May 2026 for state-supported projects, tying participation to defined submissions and certification steps, and Florida SB 484 (effective July 1, 2026) restricts utility service for certain large-load facilities tied to foreign entities of concern while increasing local discretion to reject developments. Alongside policy, modular projects commonly map compliance to recognized facility standards such as the ISO/IEC 22237 series and EPI MDCS, which are used in design assurance and third-party conformity programs.
Value Chain Analysis
The modular data center value chain starts with upstream components and materials, including switchgear, busways, UPS and batteries, cooling equipment (CDUs, heat exchangers, pumps, and immersion fluids), structural enclosures, and monitoring and controls. These inputs feed OEMs and specialized assemblers that integrate power, cooling, and IT racks into factory-built blocks, followed by system integrators that pre-commission and validate modules (including factory-acceptance testing) before logistics providers deliver containerized or prefabricated units to site. Downstream participants include EPC and civil contractors that prepare pads and connections, utilities and interconnection stakeholders that govern energization timelines, and then operators (hyperscalers, colocation firms, enterprises, and telcos) that purchase modules and contract lifecycle services such as remote monitoring, maintenance, spares, and refurbishment.
Value capture continues to shift from on-site build labor toward factory assembly, integration engineering, and services that sustain uptime for high-density AI loads. Field constraints shape the chain: transformer and grid-related equipment can carry multi-year lead times, and labor shortages increase dependence on standardized, repeatable module designs that reduce on-site work. The supply network is also adapting around deployment logistics, with construction sites adjusting layouts and lifting plans to move and install pre-assembled units, and with some firms using Foreign Trade Zones to manage inventory and tariff timing for long-lead imports.
Competitive Landscape
The market is fragmented, underscoring the modular data center market's architecture, which spans power, cooling, IT hardware, and professional services. Schneider Electric stitched AI into EcoStruxure IT, cutting mean repair times by 35% for a European colocation operator. Vertiv paired immersion OEM LiquidStack to target racks drawing over 100 kW, while ABB patented an 800-V DC busway that trims copper usage by 40%, lowering both materials and ohmic losses.
Liquid-cooling niche players such as Submer ride the thermal-density wave, pushing full-pod immersion tanks that integrate leak-detection optics and dielectric-fluid reclamation circuits. Prefab specialists Baselayer and Bladeroom court enterprises with turnkey opex bundles that combine financing, remote hands, and end-of-life asset disposition. Meanwhile, power heavyweights Eaton and Delta Electronics differentiate through energy-storage innovations, embedding lithium-iron-phosphate strings with 95% round-trip efficiency.
Regulation shapes strategy. The forthcoming IEC 62368-1 update will tighten thermal runaway safeguards for integrated UPSs, potentially requiring costly redesigns. European circular-economy law compels vendors to publish component recovery rates, prompting design-for-disassembly and buy-back programs. Against that backdrop, operators increasingly evaluate suppliers on sustainability scorecards, uptime SLA histories, and capacity to deliver multi-region spares within 72 hours. The net effect fosters cooperative competition; vendors partner on integrated stacks while competing fiercely for high-margin lifecycle service annuities.
Modular Data Center Industry Leaders
IBM Corporation
Huawei Technologies Co. Ltd
Baselayer Technology LLC
Dell Technologies Inc.
Hewlett Packard Enterprise Co.
- *Disclaimer: Major Players sorted in no particular order
Modular Data Center Market Companies Covered in this Report
- Vertiv Holdings Co.
- Schneider Electric SE
- Huawei Technologies Co. Ltd.
- Dell Technologies Inc.
- Hewlett Packard Enterprise Co.
- IBM Corporation
- Rittal GmbH and Co. KG
- Eaton Corporation plc
- Delta Electronics Inc.
- ABB Ltd.
- Cannon Technologies Ltd.
- Baselayer Technology LLC
- Bladeroom Group Ltd.
- Instant Data Centers LLC
- Colt Data Centre Services
- EdgeConneX Inc.
- PCX Holding LLC
- Cisco Systems Inc.
- ZTE Corporation
- Aspen Systems Inc.
- DATAPOD Pty Ltd.
- Synergy Associates
- Johnson Controls International plc (Silent-Aire)
- Amazon Web Services Inc.

Market Opportunities and Future Outlook
Two immediate whitespace areas are standardization-led interoperability and grid-aware modular architectures. Industry efforts such as IEEE Project P3710, authorized in June 2026 to guide standards-based design of modular data centers across power distribution and IT configurations, create room for vendors and integrators to package compliant reference designs, verification services, and documentation toolchains that reduce re-engineering across jurisdictions. In parallel, Open Compute Project modular technical guidance and the OCP-ASHRAE collaboration on cooling environments strengthen common design language for high-density thermal and power interfaces, supporting multi-vendor stacks where operators want to avoid lock-in while still adopting containerized and prefabricated build types.
Execution bottlenecks highlight where modular suppliers can expand offerings beyond hardware. Grid constraints and permitting friction in major hubs lift demand for modules that integrate more site-power functionality, higher-voltage distribution, monitoring, and commissioning support so projects can progress while waiting on interconnection. Recent company actions also reinforce momentum toward faster, repeatable deployment systems: NTT Facilities introduced its Hyper Ready Module construction system in July 2026 to cut hyperscale construction timelines, and Flex has publicly quantified modular schedule and on-site test and cabling reductions, supporting procurement interest in factory-assembled approaches. The opportunity set also extends to lifecycle services, including remote operations, spares staging, and upgrade kits for liquid cooling, as operators push rack densities beyond conventional air-cooled limits and seek predictable performance validation at commissioning.
Recent Industry Developments in Modular Data Center Market
- July 2026: IBM announced compact z17 and LinuxONE 5 rack-mount configurations designed for standard 19-inch racks, with general availability stated for August 12, 2026. The move aligns mission-critical computing with standardized rack and modular environments, supporting footprint optimization and more uniform integration into modern data center buildouts.
- May 2026: Huawei held its 2026 Global AIDC Industry Summit in Dongguan, China, and launched a grid-interactive AI Data Center strategy framed around power-supply and modular-construction innovations. By tying modular build approaches to site power architecture and grid interaction, the announcement reinforces vendor positioning around energy-aware designs for high-density AI deployments.
- August 2025: Vertiv announced global availability of Vertiv OneCore, a scalable, factory-assembled prefabricated infrastructure solution designed to support roughly 5 MW to 50 MW deployments in standardized blocks. This expands the menu of repeatable, faster-to-deploy options for AI, HPC, and other high-density projects that prioritize schedule certainty and factory validation.


Modular Data Center Market Report Scope and Research Methodology
Market Definition and Coverage
For this methodology, the modular data center market covers prefabricated and factory-integrated data center building blocks that bundle IT space with power and cooling, and are shipped and commissioned faster than conventional builds.
Scope exclusions: We exclude second-hand ISO containers that are converted on-site for temporary or interim workloads, because their cost structure and operating life do not match factory-integrated modules used for permanent data halls.
Segments Covered in This Report
- By Solution and Services
- Functional-Module Solution
- Individual Module
- All-in-One Module
- Services
- Consulting and Design
- Integration and Deployment
- Managed and Maintenance
- Functional-Module Solution
- By Application
- Disaster Recovery
- Hyperscale Edge / AI and High-Performance Computing
- Data Center Expansion
- Starter / SMB Data Centers
- AI / GPU Training Pods
- Crypto-Mining and HPC Containers
- By Build Type
- Containerized
- Prefabricated Modules
- By Deployment Type
- Outdoor Modular (Skid-Mounted)
- Indoor Modular (All-in-One Solutions)
- By Geography
- North America
- United States
- Canada
- Mexico
- South America
- Brazil
- Argentina
- Rest of South America
- Europe
- Germany
- France
- United Kingdom
- Italy
- Spain
- Rest of Europe
- Asia-Pacific
- China
- Japan
- India
- South Korea
- Australia
- Rest of Asia-Pacific
- Middle East and Africa
- Middle East
- Saudi Arabia
- United Arab Emirates
- Turkey
- Rest of Middle East
- Africa
- South Africa
- Egypt
- Nigeria
- Rest of Africa
- Middle East
- North America
Data Sources, Market Sizing, and Validation
Desk Research
Desk research was used to set the market boundaries and to collect consistent reference series that do not move materially week to week. We used public sources such as U.S. Energy Information Administration releases on electricity trends, International Telecommunication Union indicators on network traffic, International Energy Agency materials on energy efficiency, and U.S. Census Bureau trade and construction statistics where it helped proxy prefabricated building activity.
Alongside that, we reviewed company filings, earnings decks, association websites, and trusted press coverage to understand how modular rollouts are being positioned across enterprise and edge use cases. We also relied on paid subscriptions for company financials and intelligence, news and financials, patent search, and, where needed, shipment-level import and export signals for selected components. These examples are not exhaustive, and we referenced additional public and paid sources to capture inputs, validate relationships, and clarify gaps where definitions vary.
Primary Interviews and Surveys
Primary work focused on validating what is actually being bought and deployed, then aligning pricing and volume assumptions with what practitioners report from live projects. We spoke with stakeholders across modular solution providers, component suppliers, integrators, colocation operators, and enterprise buyers, covering demand patterns across APAC, EMEA, and the Americas to reduce blind spots and confirm the final model logic.
Distribution of primary research fieldwork respondents
| Company type | Respondent position | Region |
|---|---|---|
| Top tier: 32% | CXOs: 15% | APAC: 41% |
| Mid tier: 53% | Functional/Unit leaders: 38% | EMEA: 37% |
| Smaller Players: 15% | Managers: 47% | Americas: 22% |
Market-Sizing & Forecasting
Sizing starts with a top-down build that reconstructs addressable spend using data center capacity additions and retrofit activity, then applies modular adoption rates by deployment context (edge sites, enterprise expansions, and new builds) to arrive at a value pool. We corroborate the top-down total with selective bottom-up approximations, including sampled project counts by country cluster, average module configuration per site, and typical ASP bands for integrated power and cooling blocks, which are then used to tune the final totals.
Inputs were selected to reflect how this market behaves in practice, so we emphasized variables such as new data center builds versus expansions, edge site density, time-to-deploy preferences, shifts in average power density, energy efficiency and cooling choices, and lead times for factory-built modules. Where pricing varies widely, we handled gaps by using region-specific ASP ranges validated in interviews, then taking the conservative mid-point when evidence was mixed.
For forecasting, we used scenario analysis so adoption can shift differently under faster capacity builds and under tighter power availability and permitting timelines. The final forecast path is anchored in expert consensus on capacity growth and modular penetration, and then adjusted for realistic ramp rates rather than assuming immediate step-changes.
Data Validation & Update Cycle
Outputs are checked against independent signals such as data center investment announcements, power availability commentary, and observed shifts in deployment models, so that a single weak input does not drive the final number. When a variance looks unusually high, we re-check assumptions, re-run sensitivity cases, and re-contact selected respondents to confirm whether the change is real or a modeling artifact.
Before sign-off, the work is reviewed in steps, first for arithmetic and unit consistency, then for scope consistency, and finally for market logic across regions. Reports are refreshed annually, with interim updates when material events occur, and a fresh review pass is completed right before delivery so the client receives the latest updated view.
Mordor Intelligence's Modular Data Center Market Estimate Compared With Other Published Estimates
Published market sizes for modular data centers can vary more than buyers expect, even when the topic label looks identical. The gaps usually come from what is counted as modular, which year is treated as the base, and how quickly adoption is assumed to move across edge and enterprise deployments.
By tracking adoption rates from capacity additions and refreshing pricing inputs through interviews, Mordor Intelligence keeps the market total tied to factory-integrated modules and excludes second-hand container conversions, which some sources may include within a broader prefabricated definition. Differences also show up when one estimate anchors on an earlier year with lower demand, or uses aggressive penetration jumps without cross-checking against project lead times and power availability constraints.
Benchmark comparison
| Source | Market Size | Gaps in Research Methodology |
|---|---|---|
| Mordor Intelligence | USD 42.65 B (2026) | |
| Industry Publisher A | USD 29.04 B (2024) | Uses a different base year and forecast window, which shifts the total because modular adoption and pricing were lower earlier in the cycle, and the definition can be wider across prefabricated formats. |
| Market Publisher B | USD 29.31 B (2024) | Anchors on 2024 sizing and may apply higher long-term growth assumptions without the same deployment lead-time and power-constraint checks, which can pull the starting value away from later-year demand reality. |
The spread is mainly explained by base-year choice and the boundary around what counts as a modular unit versus adjacent prefabricated formats. When the scope is kept consistent and the key inputs are tied back to capacity, adoption, and realistic ASP ranges, the results become easier to trace and repeat for planning.


Key Questions Answered in the Report
What is the projected value of the modular data center market in 2031?
The sector is expected to reach USD 101.22 billion by 2031, advancing at an 18.87% CAGR from 2026.
Which application is set to grow fastest through 2031?
Hyperscale edge, AI, and HPC workloads will record the highest CAGR at 19.87%, outpacing traditional capacity-expansion projects.
Why are containerized builds gaining popularity?
Standard ISO containers shorten permitting, enable relocation, and integrate on-board power and cooling, driving a 19.53% CAGR outlook.
How do liquid-cooling modules improve efficiency?
Direct-to-chip and immersion systems cut PUE to roughly 1.15, enable rack densities above 40 kW, and can slash facility energy use by 30%.
Which region will expand the quickest?
Asia-Pacific leads with a forecast 20.02% CAGR, propelled by data-sovereignty mandates and renewable-powered inland campuses.
What is a key barrier for small enterprises considering modular solutions?
High upfront capital outlays and worries over vendor lock-in often steer smaller companies toward colocation rather than self-owned modules.
Page last updated on:


