
Mobile Backhaul Market Size and Share
Market Overview
| Study Period | 2020 - 2031 |
|---|---|
| Market Size (2026) | USD 40.2 Billion |
| Market Size (2031) | USD 80.65 Billion |
| Growth Rate (2026 - 2031) | 14.95 % |
| Fastest Growing Market | Asia Pacific |
| Largest Market | Asia Pacific |
| Market Concentration | Medium |
Major Players *Disclaimer: Major Players sorted in no particular order Image © Mordor Intelligence. Reuse requires attribution under CC BY 4.0. | |
Mobile Backhaul Market Analysis by Mordor Intelligence
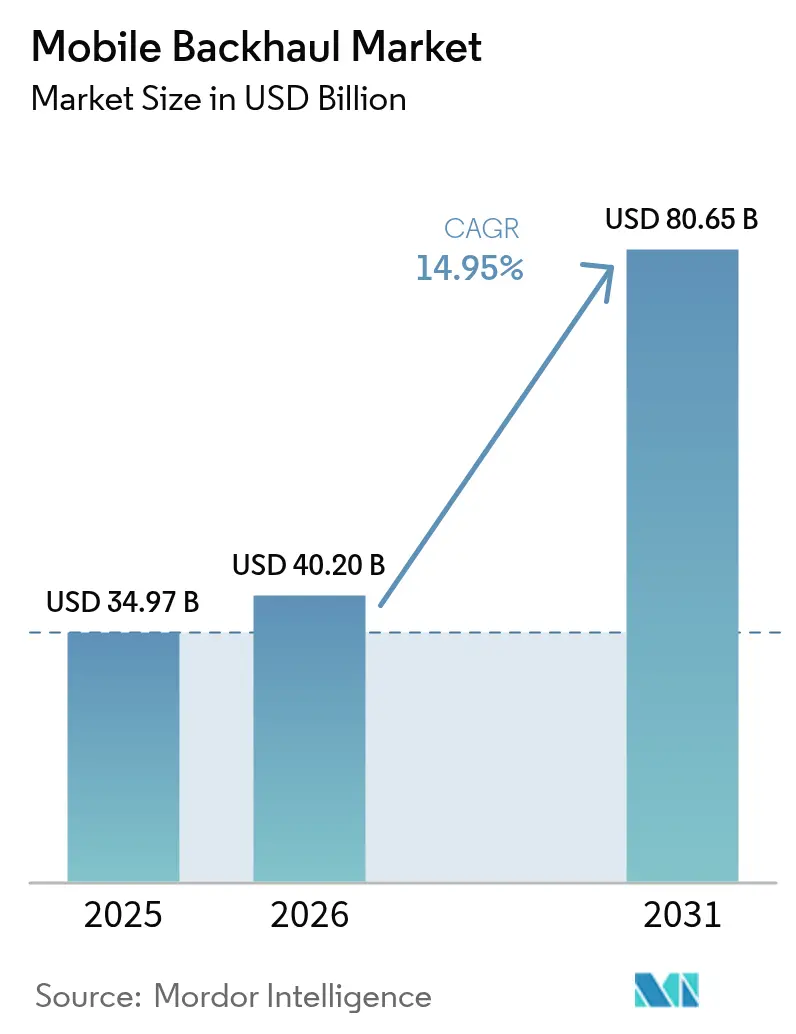
Mobile Backhaul market size in 2026 is estimated at USD 40.2 billion, growing from 2025 value of USD 34.97 billion with 2031 projections showing USD 80.65 billion, growing at 14.95% CAGR over 2026-2031.
Growth is propelled by escalating smartphone penetration, the sharp rise in video streaming, and dense 5G rollouts that demand 10 Gbps and soon 100 Gbps per cell per site capacity. Operators are swapping copper lines for fiber and high-capacity wireless links, while neutral-host models reduce duplication as 5G investments top USD 1.1 trillion between 2020 and 2025[1]EnerSys White Paper, “Powering 5G: Challenges and Solutions,” enersys.com. Open architectures, software-defined transport, and edge compute place new performance and security pressures on backhaul, yet they can lower life-cycle costs through commercial off-the-shelf hardware. Asia Pacific leads with a 35% revenue contribution and shows the fastest regional CAGR at 17.3% as China, Japan, South Korea, and India install millions of small cells. Operators everywhere now blend fiber’s scale with microwave, millimeter-wave, and low-Earth-orbit (LEO) satellite hops to fill coverage gaps and accelerate rollouts.
Key Report Takeaways
- By deployment, wired links commanded 54.30% of the mobile backhaul market share in 2025; wireless backhaul is projected to outpace at a 16.18% CAGR to 2031.
- By equipment type, microwave radios held 40.55% of the mobile backhaul market size in 2025; small-cell backhaul equipment is advancing at a 17.08% CAGR through 2031.
- By service type, managed services accounted for 48.40% of the mobile backhaul market share in 2025 and are expanding at a 16.05% CAGR.
- By network architecture, Cloud RAN/fronthaul is the fastest-growing segment at a 16.42% CAGR, while macro-cell backhaul remains the largest.
- By geography, Asia Pacific led with 34.60% revenue in 2025 and is set to post a 16.92% CAGR to 2031.
Note: Market size and forecast figures in this report are generated using Mordor Intelligence’s proprietary estimation framework, updated with the latest available data and insights as of 2026.
Market Trends and Insights
Drivers Impact Analysis of Mobile Backhaul Market*
| Driver | (~) % Impact on CAGR Forecast | Geographic Relevance | Impact Timeline |
|---|---|---|---|
| Mobile data traffic & smartphone adoption | +5.30% | Global, strongest in Asia Pacific | Medium term (2-4 years) |
| Rapid 5G rollout & densification | +4.70% | North America, Europe, East Asia | Short term (≤ 2 years) |
| Cloud-native and Open RAN architectures | +2.80% | North America, Europe, and advanced Asian markets | Medium term (2-4 years) |
| Satellite LEO backhaul for rural reach | +1.60% | Rural zones worldwide | Long term (≥ 4 years) |
| Fiber leasing by utilities & private networks | +1.10% | North America, Europe | Medium term (2-4 years) |
| Source: Mordor Intelligence | |||
Growing Mobile Data Traffic & Smartphone Adoption
Average monthly data per smartphone is forecast to soar from 21 GB in 2023 to 56 GB by 2029, with video expected to account for 75% of mobile traffic. Regional divergence is emerging: North American users may hit 66 GB per month while Sub-Saharan Africa lingers near 23 GB, forcing operators to engineer country-specific backhaul mixes. Hybrid topologies that splice fiber trunks with high-band microwave hops now dominate urban densification because they meet capacity needs without prolonged street-dig permitting. Small-cell proliferation adds thousands of short-haul links, prompting fresh investment in automated network-management platforms that can tune capacity per site in real time.
Rapid 5G Rollout Driving Capacity Needs
Base-station density is climbing from 4–5 to 40–50 sites per km² in 5G clusters, multiplying backhaul terminations. China alone is building more than 600,000 5G macro and small cells, a count projected to outstrip 4G by 1.3–1.5 times [2]Gelonghui Research, “China 5G Base Station Build-out Tracker,” gelonghui.com. Each 5G cell now requires 10 Gbps uplinks and stringent latency of sub-5 ms, accelerating the adoption of 70/80 GHz E-band radios and time-sensitive networking over fiber. Capital stress is nudging many operators toward shared towers and leased dark fiber, lowering up-front costs while ensuring upgrade paths to 100 Gbps interfaces.
Cloud-Native & Open RAN Architectures
Virtualized RAN disaggregates radio, transport, and core functions, letting carriers use standardized servers instead of proprietary appliances. Early deployments report double-digit cost savings and faster feature rollouts, yet they introduce multi-vendor integration hurdles and wider attack surfaces. Operators increasingly source best-of-breed radios, switches, and timing units, then rely on managed backhaul providers to orchestrate performance. Open transport interfaces such as eCPRI unlock statistical multiplexing that trims fronthaul bit-rates while preserving latency targets for massive-MIMO beamforming.
Satellite LEO Backhaul for Rural Reach
LEO constellations like Starlink demonstrate 102 Mbps downlink and 18 ms latency, enabling reliable cell-site to backhaul where trenching fiber would cost multiples more. Service providers in sub-Saharan Africa and the Pacific islands are offering bundles that combine satellite downlinks with local microwave rings to cut per-site bandwidth expense. Still, a five-year satellite replacement cycle keeps total cost per connected home roughly 45% above fiber over a 30-year horizon. Partnerships between LEO operators and tower companies are emerging to aggregate demand and unlock volume-based pricing.
Restraints Impact Analysis of Mobile Backhaul Market*
| Restraint | (≈) % Impact on CAGR Forecast | Geographic Relevance | Impact Timeline |
|---|---|---|---|
| High capex for fiber & spectrum | -2.80% | Global; strongest in developing regions | Medium term (2-4 years) |
| SDN backhaul cybersecurity risks | -1.50% | Developed markets | Long term (≥ 4 years) |
| Source: Mordor Intelligence | |||
High Capex for Fiber & Spectrum Costs
Fiber trenching in dense cities can run beyond USD 100,000 per Kilometer, a figure that climbs sharply where road-opening permits are scarce. Rising electricity prices also double macro-site power draw when 4G and 5G bands overlap, inflating operational overhead. In developing economies, limited access to low-interest financing delays fiber build-outs, forcing carriers to rely on microwave even where long-term economics favor fiber. The result is uneven quality-of-experience across urban and rural divides, hindering digital-inclusion goals.
SDN Backhaul Cybersecurity Risks
NTIA catalogued 1,338 distinct vulnerabilities in early Open RAN pilots, with 46% assessed as high risk[3]National Telecommunications and Information Administration, “Open RAN Security Assessment,” ntia.gov. As control-plane functions move into software, attackers gain new vectors, from misconfigured APIs to poisoned machine-learning models. Carriers are investing in Zero-Trust frameworks and MACsec encryption for fronthaul switching, yet multi-vendor patch cycles still lag. The threat of fines and reputational damage is steering some operators toward specialized security-as-a-service offerings bundled with managed backhaul contracts.
*Our forecasts treat driver/restraint impacts as directional, not additive. The impact forecasts reflect baseline growth, mix effects, and variable interactions.
Mobile Backhaul Market Segment Analysis
By Deployment:
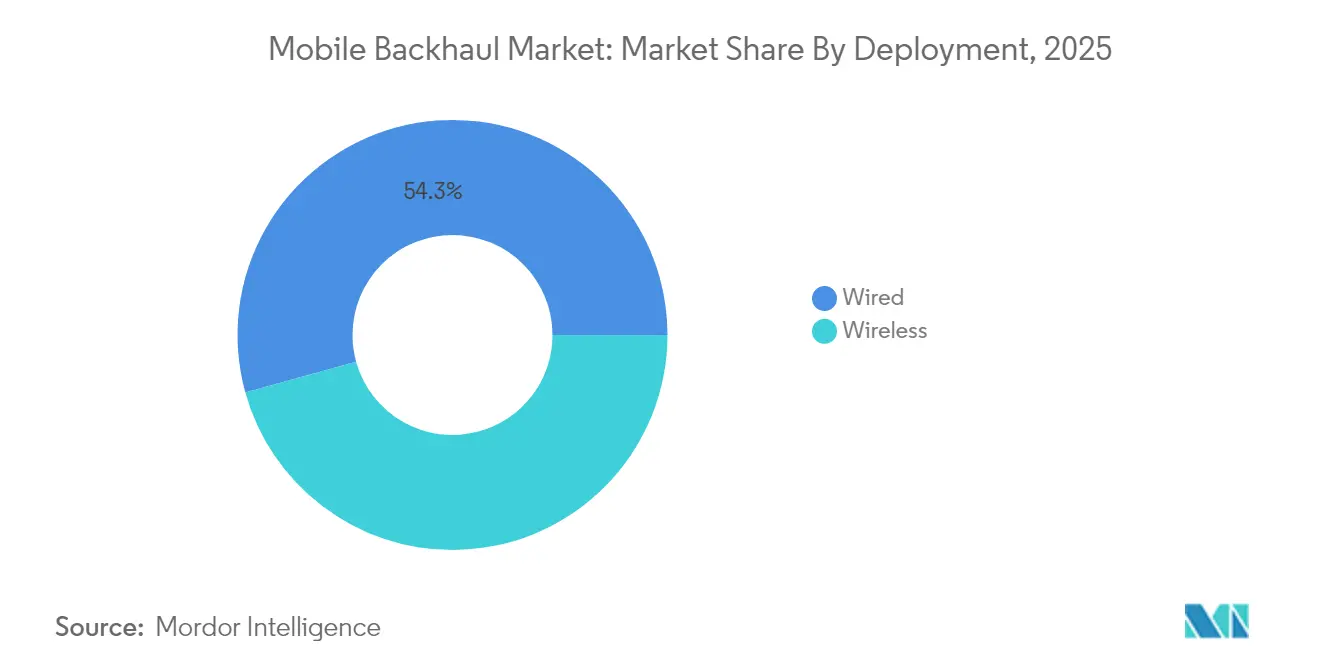
Wired Foundations, Wireless MomentumFiber-based links constituted 54.30% of the mobile backhaul market in 2025 due to their unrivalled capacity and low latency. This share translates to the largest deployment slice of the mobile backhaul market size at USD 18.99 billion in 2025. Wireless alternatives, however, are set to post a 16.18% CAGR through 2031, narrowing the gap as urban densification and pop-up events demand rapid turn-ups. Operators mesh 70/80 GHz E-band radios with leased dark fiber trunks, delivering 10 Gbps per hop while avoiding costly civil works.
Hybrid architectures are now standard: fiber remains the preferred medium for core aggregation, but microwave and millimeter-wave serve edge small cells and enterprise venues where permits or geography stall trenching. Emergent W-band and D-band links promise multi-gigabit throughput over 1–2 km, complementing fiber for dense clusters. In sparsely populated regions, operators splice LEO satellite backhaul into microwave rings, creating contiguous coverage without exceeding budget ceilings. This flexibility underpins the long-term competitiveness of the mobile backhaul market.



By Equipment Type:
Microwave Scale, Small-Cell InnovationMicrowave radios held 40.55% of the mobile backhaul market size in 2025, reflecting decades of field-proven reliability. Vendors have pushed spectral efficiency to 16 bps/Hz while adding link-bonding schemes that aggregate non-contiguous channels. Small cells backhaul gear, though only a fraction of revenue today, is set for a 17.08% CAGR as stadiums, malls, and transport hubs adopt indoor 5G.
The mobile backhaul market is witnessing a pivot toward integrated access and backhaul (IAB), where a 28 GHz radio simultaneously serves user devices and relays traffic upstream. This reduces rooftop congestion and simplifies zoning. Millimeter-wave chipset advances cut power draw by 30% since 2023, enabling pole-mount and window-mount nodes that require minimum site work. Vendors that bundle self-organizing-network software are winning tenders because they lower truck rolls and optimize link alignment in cluttered environments.
By Service Type:
Managed Expertise Takes RootManaged services captured 48.40% of the mobile backhaul market share in 2025, reflecting operator preference to offload planning, deployment, and operations. Multi-vendor networks and stringent timing demands make in-house mastery expensive; specialized partners now guarantee service-level agreements down to ±50 ns phase accuracy for 5G TDD sync.
Growth accelerates as enterprises launch private 5G networks and municipalities roll out smart-city sensors that rely on low-latency paths to edge data centers. Providers overlay AI-driven analytics that predict congestion and automate capacity augments, trimming mean-time-to-repair by half versus manual workflows. Professional integration, maintenance, and security services round out the portfolio, ensuring holistic lifecycle coverage and underpinning the expansion of the mobile backhaul market.
By Network Architecture:
Cloud RAN Reshapes TopologyMacro-cell backhaul still forms 61.10% of revenue because wide-area coverage remains indispensable. Yet Cloud RAN/fronthaul links are posting the fastest revenue jump at 16.42% CAGR as operators centralize baseband processing. eCPRI adoption slashes required bandwidth by packing IQ samples more efficiently, lowering transport costs by up to 60% in early trials.
Edge compute further disperses workloads: latency-sensitive functions process at metro data centers, while analytics tasks reside in the regional core. This layered approach forces backhaul planners to engineer deterministic latency paths, spurring investment in segment-routing IPv6 and Sync-E timing over packets. Integrated Access and Backhaul under 3GPP Release 16 adds new flexibility but can overload relay nodes under heavy load, making intelligent slice orchestration a prerequisite for a consistent user experience.

By End-User:
Tower Companies and Neutral Hosts AscendMobile Network Operators held 70.20% revenue in 2025, yet tower companies and neutral-host providers grew at 17.35% CAGR as shared fiber and power shave duplication. Neutral-host models thrive in airports and metros where separate parallel builds are impractical. The mobile backhaul industry is seeing utilities, railways, and oil majors monetize rights-of-way by leasing conduits, turning infrastructure into an asset.
Private enterprises, ports, factories, and mining camps deploy isolated LTE/5G networks for mission-critical operations. These setups require bespoke backhaul tuned for deterministic jitter, galvanizing niche integrators with deep vertical know-how. This broadening customer mix diversifies revenue streams and stabilizes demand cycles for backhaul hardware and services.
Geography Analysis
APAC Mobile Backhaul Market
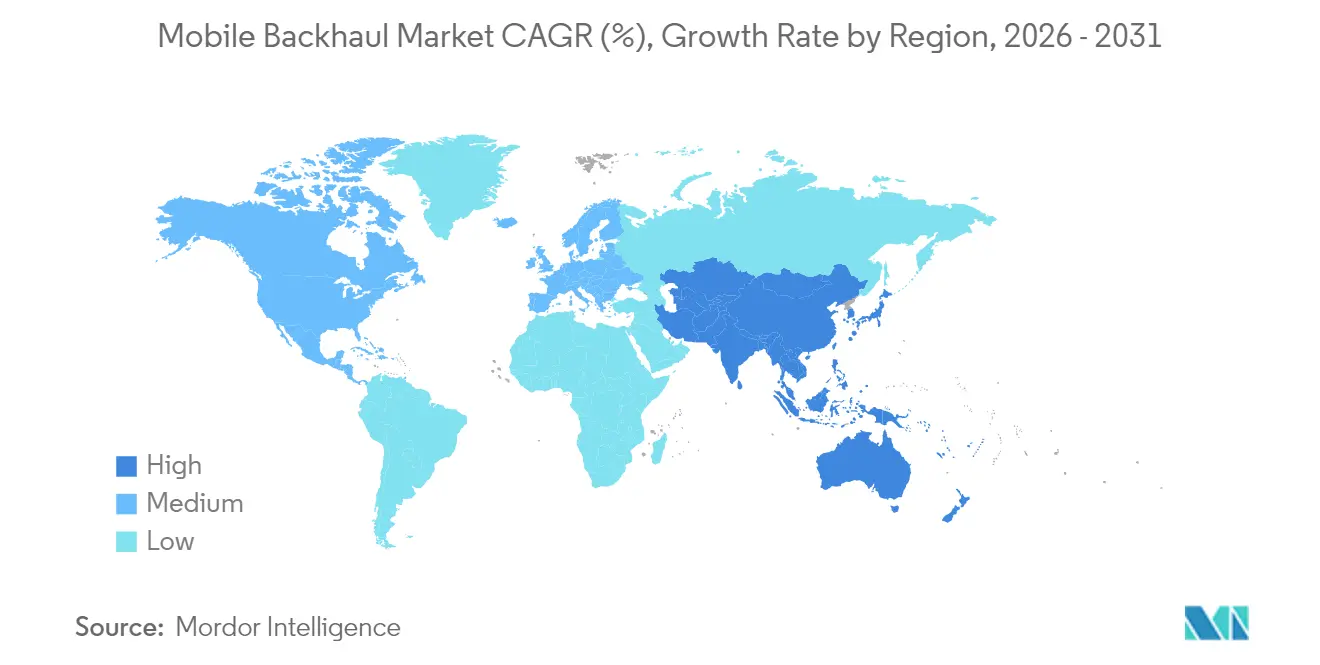
Asia Pacific commands 34.60% of the mobile backhaul market, expanding at 16.92% CAGR thanks to outsized 5G investments, state subsidies, and dense urban populations. China, Japan, and South Korea already blanket major cities with standalone 5G, driving steep demand for 10 Gbps microwave hops that skirt excavation bottlenecks. India’s recent spectrum auctions have unleashed a fiber-laying spree along highways and into tier-2 cities, while operators also pilot satellite-plus-microwave hybrids for Himalayan and island coverage. Government schemes that underwrite rural fiber further sustain momentum.
North America Mobile Backhaul Market
North America, while smaller by volume, leads innovation in virtualized RAN and dark-fiber aggregation. Verizon and T-Mobile bolstered their optical footprints by acquiring regional fiber players in 2024, locking in scalable backhaul to support fixed-wireless access rollouts. The Federal Communications Commission’s USD 9 billion 5G Fund incentivizes cell-site upgrades in remote counties, channeling investments toward microwave and satellite backhaul where terrain hampers trenching. Fixed-mobile convergence accelerates as operators reuse fiber for both gigabit broadband and cell-site uplinks, amplifying return on capital.
EMEA and LATAM Mobile Backhaul Market
Europe’s mature markets balance stringent regulatory reviews with a push for pan-EU 5G corridors. Infrastructure-sharing frameworks lower duplicate capex, while public–private partnerships finance cross-border fiber routes vital for low-latency services such as connected freight. Meanwhile, the Middle East fast-tracks smart-city visions that rely on dense small-cell grids, and African carriers tap LEO constellations to backhaul remote coverage islands. Latin America sees 5G launches in 17 countries, with carriers forming consortia to lease submarine-cable capacity and distribute it inland via microwave chains, weaving resilience into national networks.

Regulatory Landscape
Mobile backhaul deployments are shaped by spectrum licensing, wholesale-access remedies for fiber, and transport interoperability standards. In December 2025, the Telecom Regulatory Authority of India (TRAI) released recommendations covering point-to-point assignment approaches for multiple microwave backhaul bands including 6 GHz, 7 GHz, 13 GHz, 15 GHz, 18 GHz, 21 GHz, E-band, and V-band, highlighting how administrative processes can speed 5G transport turn-ups. In Canada, Innovation, Science and Economic Development (ISED) opened a July 2025 consultation on additional backhaul spectrum in the 21.2-21.8 GHz and 22.4-23.0 GHz ranges, reinforcing the role of mid-to-high microwave spectrum availability in densification.
On the fixed access side, Ofcom published the Telecoms Access Review 2026-31 statement in March 2026, setting the UK wholesale access framework through March 2031. This is relevant for fiber-heavy backhaul where duct and pole access remedies influence build economics. Technical compliance also increasingly references global standards: Broadband Forum TR-331 Issue 2 (November 2024) defines PON-based mobile backhaul requirements for multi-vendor interoperability, while ITU-T and 3GPP continue updating transport and IAB specifications, including 3GPP TS 38.340 Release 19 for backhaul adaptation in integrated access and backhaul.
Value Chain Analysis
The mobile backhaul value chain runs from component suppliers, including RF front-ends, timing and routing silicon, optical modules, coherent DSPs, and specialty fiber, to system OEMs and software providers such as microwave radios, optical transport, routers and switches, SDN controllers, and assurance. The chain then extends to integrators and managed service providers, followed by end customers including MNOs, tower companies and neutral hosts, ISPs, and private enterprises and utilities. Standards bodies and alliances affect upstream design choices, with 3GPP Release 19 (TS 38.340) formalizing backhaul adaptation for IAB and the Mobile Optical Pluggables Alliance (MOPA) publishing blueprints aimed at volume readiness for next-generation pluggables toward 2027.
Supply constraints and qualification cycles can extend lead times and influence sourcing strategy, especially for high-speed coherent DSPs and certain fiber types. That can delay node upgrades or metro aggregation builds and encourage dual-sourcing where possible. Downstream, value increasingly comes from engineering and operations, including timing and synchronization design, security hardening (including secure boot and hardware root-of-trust requirements referenced in ETSI-aligned procurement in parts of Europe), and automation tooling that reduces truck rolls across dense small-cell footprints. As a result, OEMs and partners tend to bundle hardware with orchestration, observability, and lifecycle services rather than compete only on radio or optical unit pricing.
Competitive Landscape
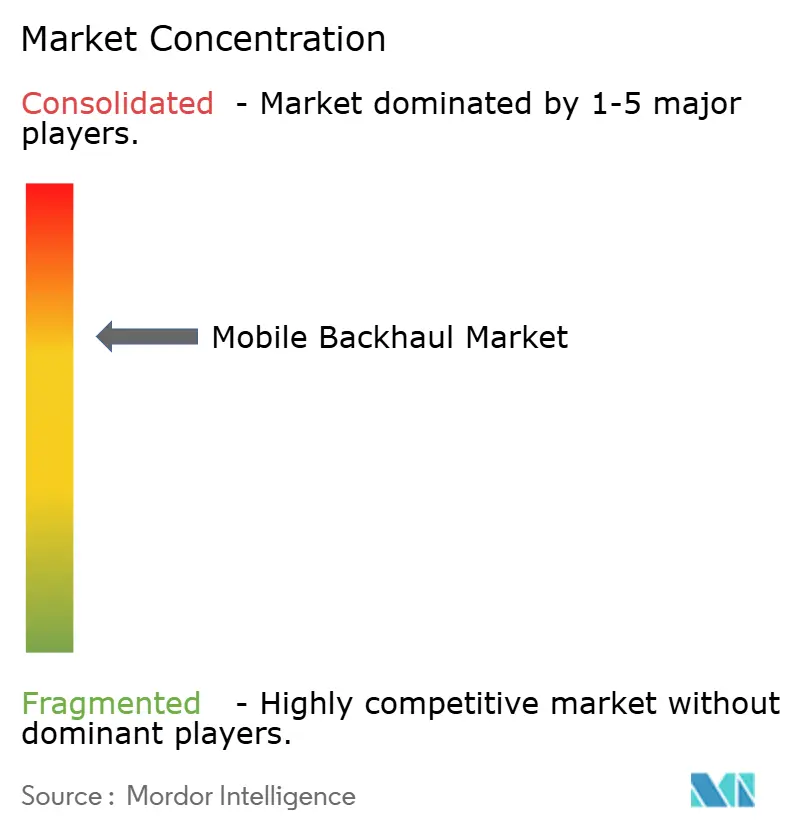
The mobile backhaul market is moderately concentrated: Huawei, Ericsson, Nokia, ZTE, and Cisco together exceed 70% revenue, with Huawei and Ericsson alone controlling 45% of global microwave shipments[4]TelecomLead, “Global Microwave Transmission Market Q1 2025,” telecomlead.com. Regional variance is marked, Nokia and Aviat hold a 56% share in North America, while Ceragon and Huawei lead Asia Pacific with 47%. The rise of Open RAN ecosystems introduces fresh challengers such as NEC, Fujitsu, and Parallel Wireless that bundle radios with transport controllers, eroding incumbents’ lock-in.
Technology is the prime differentiator. Nokia’s pole-mount small-cell with integrated backhaul drew early adopters in dense European metros, while Ericsson partnered with Turkcell to pilot W-band links that triple spectrum resources beyond 80 GHz and achieve 100 Gbps throughput. Ceragon expanded millimeter-wave coverage by snapping up Siklu, gaining compact 70/80 GHz radios suitable for suburban avenues. Vendors also tout AI-driven link-adaptation engines that boost uptime without manual retuning.
Neutral-host fiber operators and tower companies negotiate bulk equipment contracts, intensifying price pressure. Vendors counter by offering lifecycle services from planning and build to security monitoring, binding customers via multi-year agreements. White-space opportunities emerge in rural LEO gateways, private-network backhaul, and edge-compute ingress, where agile specialists can outpace conglomerates weighed down by legacy portfolios.
Mobile Backhaul Industry Leaders
Fujitsu Limited
NEC Corporation
Ericsson Inc.
Huawei Technologies
Cisco Systems, Inc.
- *Disclaimer: Major Players sorted in no particular order
Mobile Backhaul Market Companies Covered in this Report
- Market level overview
- Huawei Technologies Co.
- Ericsson AB
- Nokia Corporation
- ZTE Corporation
- NEC Corporation
- Cisco Systems
- Fujitsu Limited
- Aviat Networks
- Ceragon Networks Ltd.
- BridgeWave Communications
- ATandT Inc.
- Verizon Communications Inc.
- Ciena Corporation
- Juniper Networks
- Siklu Communication Ltd.
- Infinera Corporation
- CommScope Holding Company
- Telefonica S.A.
- Intelsat S.A.
- Parallel Wireless

Market Opportunities and Future Outlook
Higher-capacity site connectivity and more deterministic IP transport are creating whitespace for upgrades from 1GE toward 10GE and 25GE at the cell site, alongside SRv6-enabled traffic engineering and Layer 3 functionality closer to the radio. Huawei presented a 5G-Advanced-oriented mobile backhaul architecture in March 2026 built around 10GE/25GE site connectivity and end-to-end SRv6, framing a path for operators to relieve congestion as per-site throughput rises. Event-venue and other high-density deployments provide visible proof points for this shift: in January 2026, HKT completed 25 Gbps mobile backhaul deployments at Hong Kong venues including Kai Tak Sports Park and Hong Kong Coliseum, which aligns with demand for rapid, high-capacity turn-ups in concentrated traffic zones.
Converged fiber and packetized access options also create expansion room where trenching is slow or costly, particularly through infrastructure sharing and PON-based backhaul in select markets. In September 2025, U Mobile signed a long-term partnership with Sacofa to use more than 11,000 km of fiber for 5G backhaul across Sarawak, showing how regional fiber owners can enable mobile densification. At the same time, regulatory actions can alter the microwave-based backhaul business case: in June 2026, Indias Department of Telecommunications published draft administrative allocation rules that retained slab-based pricing for backhaul spectrum, keeping cost sensitivity front and center for operators relying on licensed microwave in challenging geographies.
Recent Industry Developments in Mobile Backhaul Market
- June 2026: Telefonica reached an agreement to acquire the rural microwave backhauling platform LineoX from Asterion Industrial Partners. The move strengthens Telefonica control over specialized rural transport assets and can streamline upgrades and operations for microwave-heavy backhaul footprints in Spain.
- May 2026: Inter Venezuela selected Harmonic to implement a nationwide PON-based mobile backhaul service using XGS-PON and Harmonic cOS virtualization. The project expands fiber-fed backhaul options for mobile densification while using a more access-like build model to accelerate site connectivity.
- April 2024: Omnispace and MTN partnered to develop an Africa-wide mobile-satellite IoT connectivity approach that uses satellite-enabled backhaul for coverage extension. The collaboration supports remote-area service delivery where terrestrial backhaul is constrained, broadening the toolset for operators balancing coverage and cost.


Mobile Backhaul Market Report Scope and Research Methodology
Market Definition and Coverage
For this study, the mobile backhaul market is defined as spending on the transport links, related equipment, and associated services that carry aggregated mobile traffic from radio sites to the operator core or edge across wired and wireless transmission paths.
Scope exclusions: Fronthaul and passive fiber access built only for fixed broadband (including dark-fiber leasing used purely for fixed access) are excluded from this market sizing.
Segments Covered in This Report
- By Deployment
- Wired
- Fiber/Optical
- Copper/DSL
- Wireless
- Microwave
- Millimetre-Wave (E- and V-band)
- Satellite
- Free-Space Optics
- Wired
- By Equipment Type
- Routers and Switches
- Microwave Radios
- Optical Transport Equipment
- Small-Cell Backhaul Equipment
- Others
- By Service Type
- Professional Services
- Managed Services
- Installation and Integration
- Maintenance and Support
- By Network Architecture
- Macro-Cell Backhaul
- Small-Cell Backhaul
- Cloud RAN/Fronthaul
- By End-user
- Mobile Network Operators
- Neutral-Host and Tower Companies
- Internet Service Providers
- Private Enterprises and Utilities
- By Geography
- North America
- United States
- Canada
- Mexico
- South America
- Brazil
- Argentina
- Rest of South America
- Europe
- United Kingdom
- Germany
- France
- Spain
- Italy
- Russia
- Rest of Europe
- Asia-Pacific
- China
- India
- Japan
- South Korea
- Australia
- Rest of Asia-Pacific
- Middle East
- GCC
- Turkey
- Rest of Middle East
- Africa
- South Africa
- Nigeria
- Egypt
- Rest of Africa
- North America
Data Sources, Market Sizing, and Validation
Desk Research
Desk research was used to set the outer boundaries of demand and to understand how operator networks are expanding and being modernized. We relied on public and official sources such as the ITU, the World Bank, national telecom regulators, OECD broadband statistics, and standards bodies like 3GPP and IEEE for definitions and adoption milestones, plus peer-reviewed journals for transport-technology performance and upgrade triggers.
To translate those signals into a workable model, we also reviewed operator and infrastructure-provider annual reports, investor presentations, earnings call commentary, and reputable telecom press for rollout timing, spectrum and site densification cues, and typical backhaul upgrade paths. In a few cases, paid subscriptions were used only to improve company financial context and to validate patent activity and shipment direction, which helped avoid overcounting overlapping product categories. The sources listed here are illustrative, and many additional public references were used for cross-checks and clarification.
Primary Interviews and Surveys
Primary work was done through structured expert interviews and short surveys with telecom operators, tower and neutral-host participants, network integrators, and backhaul equipment and service providers across major regions. Respondent input was mainly used to confirm what gets budgeted as backhaul versus adjacent network layers, to align average pricing and mix-shift assumptions, and then to pressure-test the model outputs against observed upgrade cycles.
Distribution of primary research fieldwork respondents
| Company type | Respondent position | Region |
|---|---|---|
| Top tier: 31% | CXOs: 18% | APAC: 43% |
| Mid tier: 51% | Functional/Unit leaders: 34% | EMEA: 37% |
| Smaller Players: 18% | Managers: 48% | Americas: 20% |
Market-Sizing & Forecasting
Sizing starts from a top-down build that reconstructs addressable backhaul spend using mobile-network traffic growth, 4G and 5G rollout pace, and the resulting site densification needs. Those needs are then mapped into wired and wireless backhaul upgrades by region. We tracked practical inputs such as the mix of fiber versus microwave links, typical capacity upgrades per site, router and optical transport refresh cycles, and the share of managed and professional services attached to deployments (where services are contracted separately).
Once the initial totals were formed, the numbers were corroborated with selective bottom-up approximations, including sampled price per link by technology and region, supplier and channel checks on shipment direction, and sanity checks against operator capex commentary. Where bottom-up visibility was patchy, gaps were handled by using ranges validated in interviews and then applying conservative midpoints until better confirmation was obtained.
Forecasts were developed using scenario analysis tied to a small set of drivers that experts could agree on, including 5G coverage buildout timing, traffic growth, fiberization targets, and availability of spectrum bands commonly used for wireless backhaul. The scenario outputs were then reviewed to ensure the implied growth does not break physical deployment constraints like installation lead times and upgrade cadence.
Data Validation & Update Cycle
Totals and sub-totals were triangulated by checking that regional outputs align with independent signals such as operator rollout timelines, technology mix statements, and the expected direction of transport capacity upgrades. Outliers were flagged, re-worked, and then rechecked through a second analyst review before sign-off, especially when a segment shift could swing the result.
The report is refreshed annually, and interim updates are made when material events occur, such as major policy changes, sharp capex resets, or step-changes in deployment approach. Before delivery, one last pass is completed so clients receive the latest updated view based on the most recent public disclosures and re-contacts when needed.
Mordor Intelligence's Mobile Backhaul Market Size Versus Other Published Estimates
Published market sizes for mobile backhaul can appear far apart because the boundary between backhaul, transport, and access is treated differently across studies. Some sources also combine equipment-only totals with services-inclusive totals. Timing also plays a part, since base-year choice, currency conversion points, and how quickly assumptions are refreshed can shift the current-year value.
Fiberization shares, wireless backhaul link upgrades, and operator capex signals are used as evidence checks to anchor the Mordor Intelligence estimate to what is actually being deployed and budgeted as backhaul in the field. Once those checks are applied, the largest remaining gaps usually come from whether dark-fiber leases and fixed-broadband optical access are included, plus how aggressive the assumed price declines and capacity step-ups are over the forecast period.
Benchmark comparison
| Source | Market Size | Gaps in Research Methodology |
|---|---|---|
| Mordor Intelligence | USD 40.2 B (2026) | |
| Global Research Publisher A | USD 47.5 B (2025) | Uses a broader label of mobile and wireless backhaul and can pull in adjacent wireless transport items, with a different base-year timing that can lift the stated current value. |
| Industry Report House B | USD 25.4 B (2025) | Often frames the market more narrowly around selected equipment and service lines, and may apply more conservative upgrade cadence and pricing assumptions across regions. |
The comparison shows that year selection and scope boundaries drive most of the spread, not a single arithmetic difference. By keeping inclusions tied to backhaul-specific deployments and by validating mix and upgrade cadence through multiple signals, the final number remains traceable to clear inputs and repeatable sizing steps.


Key Questions Answered in the Report
What is the current size of the mobile backhaul market?
The mobile backhaul market size is USD 40.2 billion in 2026 and is projected to reach USD 80.65 billion by 2031.
Which region is growing fastest in mobile backhaul deployment?
Asia Pacific leads with a 34.60% revenue share in 2025 and is forecast to expand at a 16.92% CAGR through 2031, propelled by large-scale 5G rollouts.
Why are managed services gaining traction in mobile backhaul?
Managed services already hold 48.40% revenue because operators prefer outsourcing complex multi-vendor networks, and this segment is growing at 16.05% CAGR.
How does satellite backhaul complement fiber and microwave?
Low-Earth-orbit constellations provide 100 Mbps-plus links with sub-20 ms latency, bridging coverage gaps where fiber trenching is costly or terrain is challenging.
What security challenges arise with SDN and Open RAN backhaul?
NTIA identified over 1,300 vulnerabilities, with 46% high risk, because software-defined control planes increase attack surfaces, necessitating Zero-Trust and MACsec protections.
How will Cloud RAN affect future backhaul requirements?
Cloud RAN centralizes processing, raising fronthaul capacity and latency demands; eCPRI and segment-routing innovations are thus essential to deliver deterministic performance.
Page last updated on:


 Your data is secure and never sold or shared.


