
Global Mineral Fortification Market Size and Share
Market Overview
| Study Period | 2021 - 2031 |
|---|---|
| Market Size (2026) | USD 73.63 Billion |
| Market Size (2031) | USD 96.39 Billion |
| Growth Rate (2026 - 2031) | 5.53 % |
| Fastest Growing Market | Asia Pacific |
| Largest Market | Europe |
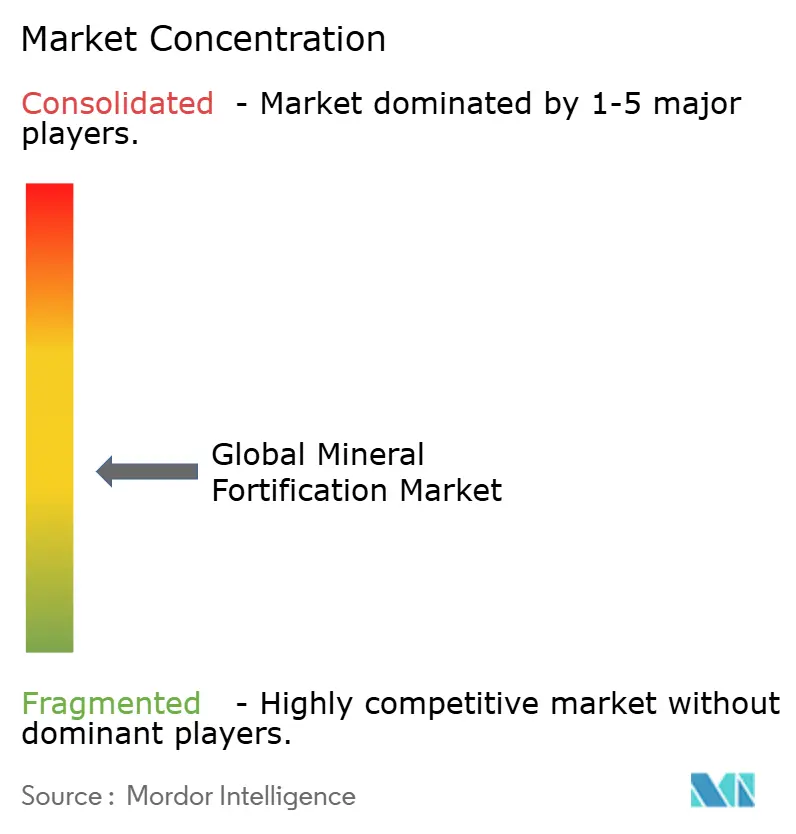
| Market Concentration | Medium |
Major Players
*Disclaimer: Major Players sorted in no particular order Image © Mordor Intelligence. Reuse requires attribution under CC BY 4.0. |
|
Global Mineral Fortification Market Analysis by Mordor Intelligence
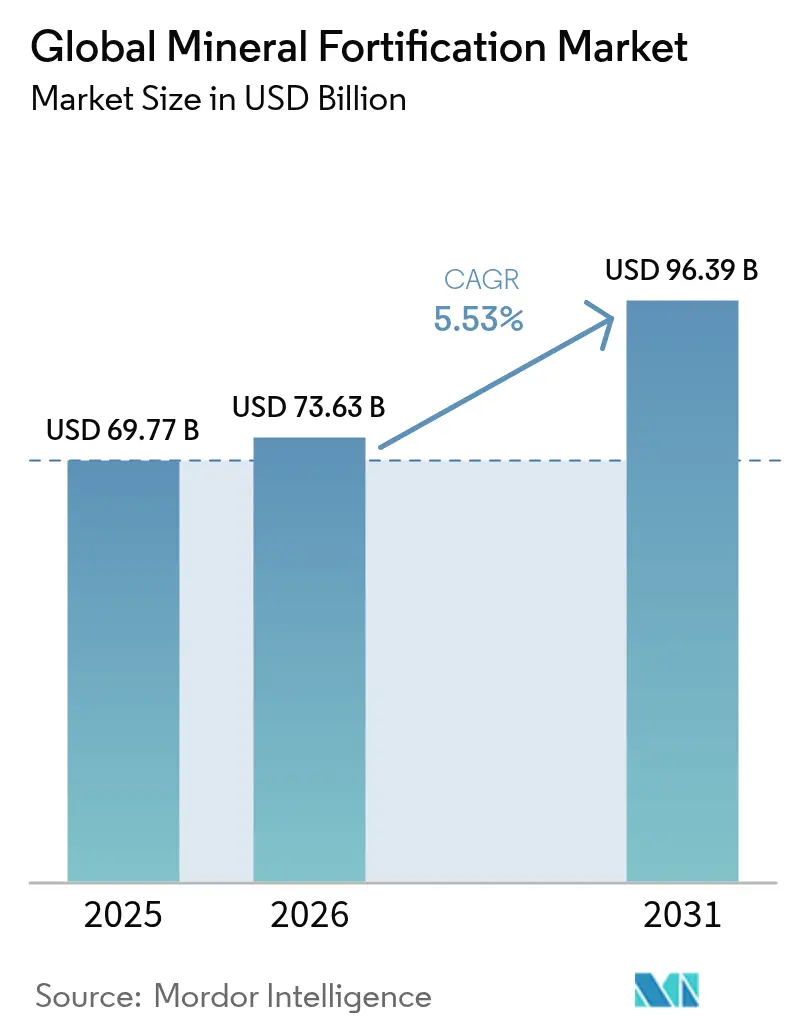
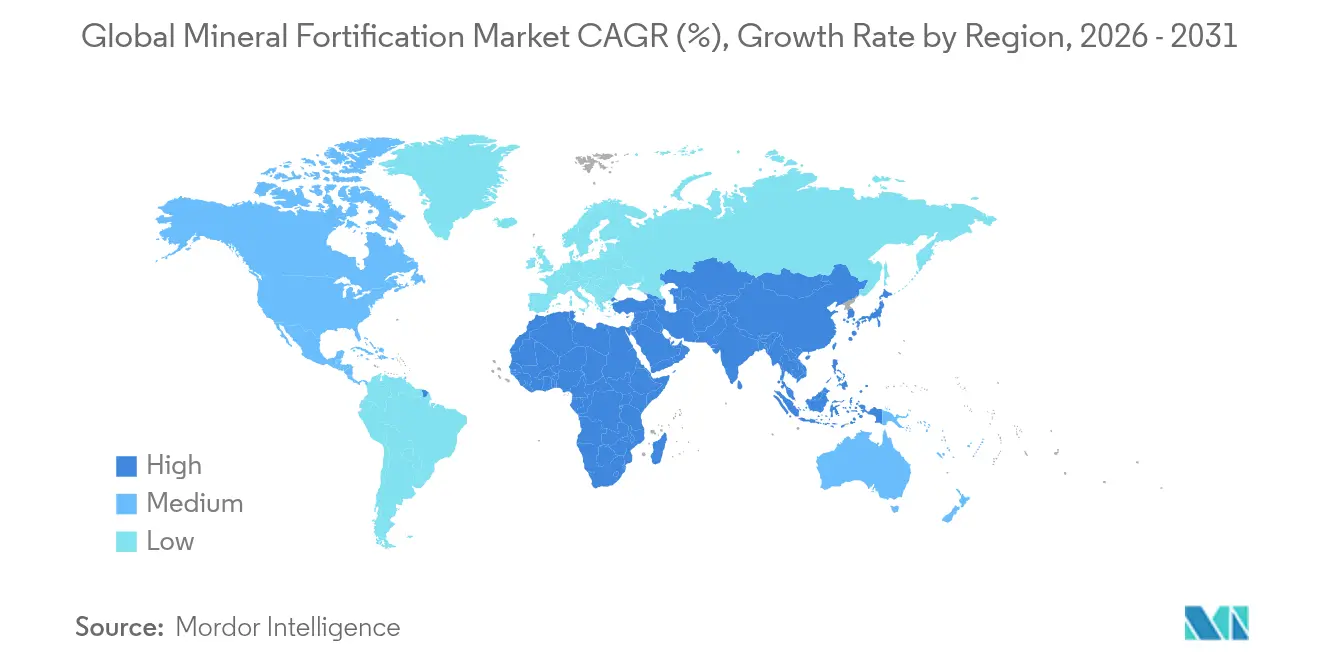
The mineral fortification market size is expected to grow from USD 69.77 billion in 2025 to USD 73.63 billion in 2026 and is forecast to reach USD 96.39 billion by 2031 at 5.53% CAGR over 2026-2031. The market growth is driven by increasing concerns about micronutrient deficiencies, government regulations, and advancements in nano-encapsulation technology. Mineral fortification provides a cost-effective solution for addressing micronutrient deficiencies, offering significant returns on investment for public health programs and ensuring sustained funding. While calcium remains the dominant mineral segment, zinc fortification is gaining prominence due to its importance in immune system function. Europe holds the largest market share due to established regulatory frameworks, while the Asia-Pacific region demonstrates the highest growth rate, supported by increasing urbanization and consumer purchasing power.
Key Report Takeaways
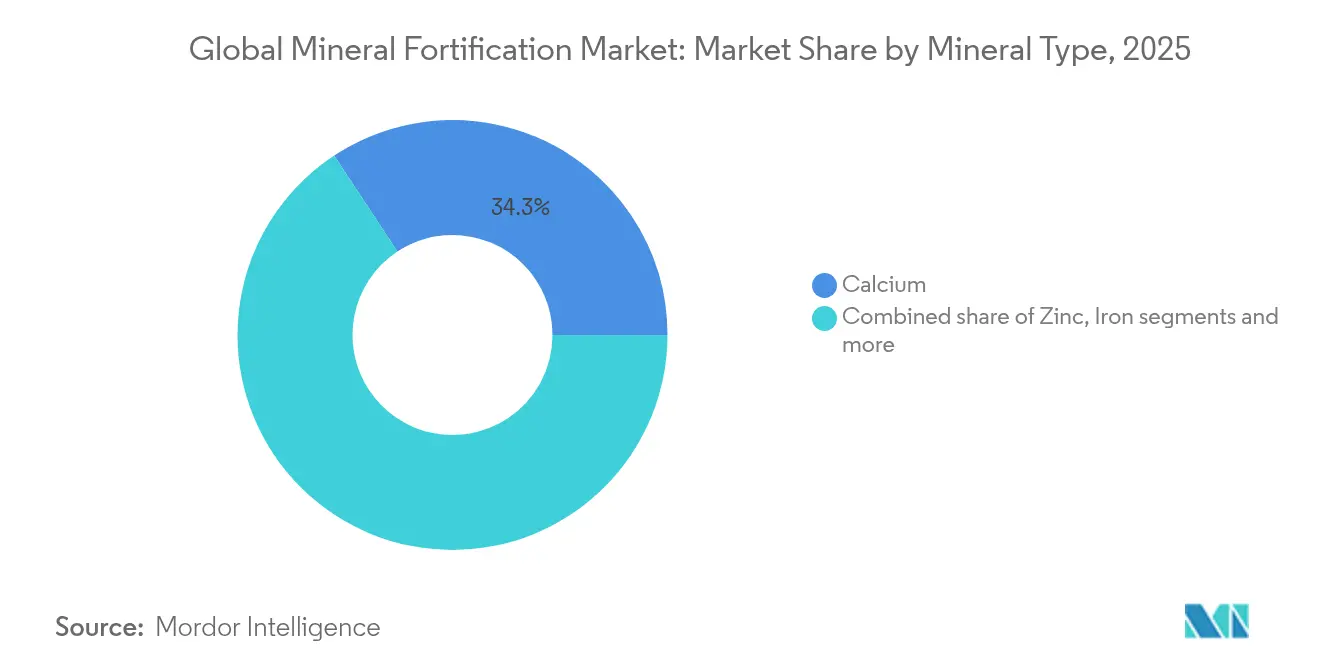
- By mineral type, calcium held 34.28% of the mineral fortification market size in 2025, while zinc is estimated to post the highest 7.09% CAGR to 2031.
- By form, powder formats represented 55.01% of the overall mineral fortification market in 2025; nano-form solutions show the fastest 8.25% CAGR.
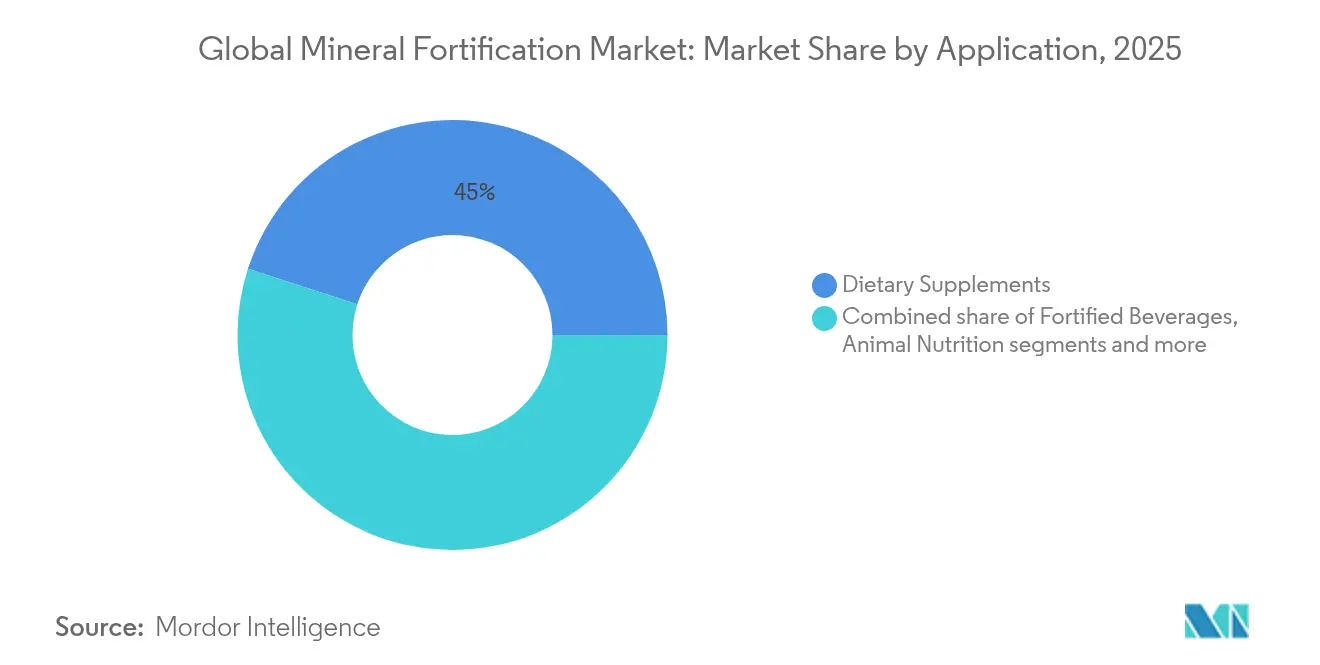
- By application, dietary supplements led with 45.02% of mineral fortification market share in 2025; infant and early-life nutrition is projected to expand at a 7.63% CAGR through 2031,
- By geography, Europe captured 35.02% revenue share in 2025, whereas Asia-Pacific is advancing at a 6.05% CAGR through 2031.
Note: Market size and forecast figures in this report are generated using Mordor Intelligence’s proprietary estimation framework, updated with the latest available data and insights as of 2026.
Market Trends and Insights
Drivers Impact Analysis of Global Mineral Fortification Market*
| Driver | (~) % Impact on CAGR Forecast | Geographic Relevance | Impact Timeline |
|---|---|---|---|
| High prevalence of micronutrient deficiencies | +1.8% | Global, with highest impact in Sub-Saharan Africa and South Asia | Long term (≥ 4 years) |
| Government-mandated mineral fortification programs | +1.5% | Global, with early adoption in North America and Europe | Medium term (2-4 years) |
| Rising demand for functional foods and beverages | +1.2% | North America, Europe, and urban Asia-Pacific | Medium term (2-4 years) |
| Growing supplement use among aging populations | +0.9% | North America, Europe, and developed Asia-Pacific markets | Long term (≥ 4 years) |
| Advancements in nano-encapsulation for fortification | +0.8% | Global, with technology hubs in North America and Europe | Short term (≤ 2 years) |
| Increasing adoption of plant-based and fortified alternative diets | +0.7% | North America, Europe, and urban centers globally | Medium term (2-4 years) |
| Source: Mordor Intelligence | |||
High prevalence of micronutrient deficiencies
The high prevalence of micronutrient deficiencies is a significant driver of the mineral fortification market. According to the World Health Organization (WHO), over 30.7% of women globally aged 15-49 years suffered from anaemia in 2023 [1]Source: World Health Organization, "WHO Global Anaemia estimates, 2025 Edition," who.int. Governments worldwide are implementing initiatives to combat this issue. For instance, the Indian government launched the National Iron Plus Initiative (NIPI) to address anemia caused by iron deficiency. Similarly, the United States has mandated the fortification of certain food products, such as salt with iodine and flour with folic acid, to reduce the prevalence of related deficiencies. In Africa, the Food Fortification Initiative (FFI) has collaborated with governments to promote the fortification of staple foods like maize flour and wheat flour. These efforts highlight the growing demand for fortified food products, driving the mineral fortification market during the forecast period.
Government-mandated mineral fortification programs
Government-mandated mineral fortification programs serve as a key driver for the mineral fortification market. These initiatives aim to address widespread micronutrient deficiencies, particularly in developing and underdeveloped regions. For instance, according to the Food Fortification Initiative, as of 2023, 94 countries have implemented mandatory fortification of at least one industrially milled cereal grain, such as wheat flour, maize flour, or rice [2]Source: Food Fortification Initiative, "Global Progress," ffinetwork.org. In India, the Food Safety and Standards Authority of India (FSSAI) has mandated the fortification of staple foods like rice, wheat flour, edible oil, and milk with essential vitamins and minerals, including iron, folic acid, and vitamins A and D, to combat malnutrition. Similarly, in the United States, the Food and Drug Administration (FDA) has long required the fortification of certain foods, such as the addition of folic acid to enriched grain products, which has contributed to a significant decline in neural tube defects. These programs not only enhance public health but also create a steady demand for fortified products, thereby driving market growth.
Rising demand for functional foods and beverages
The mineral fortification market is experiencing significant growth due to the rising demand for functional foods and beverages. Consumers are increasingly seeking products enriched with essential minerals to address nutritional deficiencies and promote overall health. This trend is driven by growing health awareness, changing dietary preferences, and the increasing prevalence of lifestyle-related diseases. Manufacturers are focusing on developing innovative fortified products to cater to this demand, incorporating minerals such as calcium, iron, zinc, and magnesium into a wide range of food and beverage offerings. The market is also benefiting from advancements in fortification technologies, which ensure better bioavailability and stability of minerals in fortified products. Additionally, supportive government regulations and initiatives promoting nutritional fortification are further propelling the market's growth. The market is poised for continued expansion during the forecast period, driven by these factors and the increasing adoption of fortified foods and beverages across various demographics.
Growing supplement use among aging populations
Demographic transitions toward aging populations create sustained demand for targeted mineral supplementation, as age-related physiological changes reduce nutrient absorption efficiency and increase micronutrient requirements. As the global population aged 80 years and above is projected to reach 265 million by mid-2030, according to the United Nations, the demand for fortified products is expected to rise [3]Source: United Nations, "Peace, dignity and equality on a healthy planet," un.org. Older adults are increasingly seeking supplements to address age-related nutritional deficiencies, improve bone health, and enhance overall well-being. For instance, calcium and vitamin D supplements are widely recommended to prevent osteoporosis, a condition prevalent among the elderly. Additionally, governments worldwide are promoting initiatives to improve nutritional intake among aging populations. The World Health Organization has emphasized the importance of micronutrient fortification in public health strategies, particularly for vulnerable groups like the elderly. Such measures are expected to further boost the adoption of mineral-fortified products during the forecast period.
Restraints Impact Analysis of Global Mineral Fortification Market*
| Restraint | (~) % Impact on CAGR Forecast | Geographic Relevance | Impact Timeline |
|---|---|---|---|
| Organoleptic and stability issues in fortified products | -0.8% | Global, with higher sensitivity in developed markets | Short term (≤ 2 years) |
| High cost of chelated minerals | -0.6% | Global, with greater impact in price-sensitive emerging markets | Medium term (2-4 years) |
| Complex regulatory limits on fortification levels | -0.5% | Europe, North America, and regulated Asia-Pacific markets | Long term (≥ 4 years) |
| Consumer preference for whole-food and clean-label products | -0.4% | North America, Europe, and affluent urban centers | Medium term (2-4 years) |
| Source: Mordor Intelligence | |||
Organoleptic and stability issues in fortified products
One of the significant restraints in the mineral fortification market is the organoleptic and stability issues associated with fortified products. These challenges arise due to the addition of minerals, which can alter the taste, color, texture, and overall sensory attributes of the product. Such changes may lead to reduced consumer acceptance, impacting the market growth. For instance, certain minerals, such as iron and zinc, can impart a metallic taste or cause discoloration in food and beverages, making them less appealing to consumers. Furthermore, stability issues, such as the degradation of fortified minerals during processing, storage, or distribution, can compromise the nutritional value and effectiveness of the product. Factors like exposure to heat, light, oxygen, and moisture can accelerate the degradation process, further complicating the formulation of fortified products. Addressing these concerns requires advanced formulation techniques and innovative delivery systems to ensure that the fortified products maintain their sensory appeal and nutritional integrity throughout their shelf life.
High cost of chelated minerals
The high cost of chelated minerals acts as a major restraint in the mineral fortification market. Chelated minerals, which are minerals bound to organic molecules to enhance their bioavailability, often involve complex manufacturing processes. These processes require advanced technology and stringent quality control measures, leading to increased production costs. Additionally, the raw materials used in the chelation process are often expensive, further driving up the overall cost. This high price point can limit the adoption of chelated minerals, particularly in price-sensitive markets or among manufacturers operating on tight budgets. As a result, the cost factor poses a challenge to the widespread use of chelated minerals in food, beverages, and dietary supplements, thereby impacting the growth of the mineral fortification market.Furthermore, the high cost of chelated minerals can create a barrier for small and medium-sized enterprises (SMEs) that may lack the financial resources to incorporate these minerals into their product formulations.
*Our forecasts treat driver/restraint impacts as directional, not additive. The impact forecasts reflect baseline growth, mix effects, and variable interactions.
Global Mineral Fortification Market Segment Analysis
By Application:
Supplements Lead While Infant Nutrition AcceleratesIn 2025, dietary supplements accounted for 45.02% of the mineral fortification market, driving growth by overcoming the typical challenges associated with food matrices, such as flavor, texture, and shelf-life limitations. The ability of dietary supplements to deliver essential minerals in a convenient and efficient manner has positioned them as a key contributor to the market's expansion. This segment continues to attract consumer interest due to its adaptability and effectiveness in addressing nutritional deficiencies. Additionally, the growing awareness of preventive healthcare and the increasing adoption of dietary supplements among various age groups have further fueled the demand for mineral-fortified products.
Infant and early-life nutrition, growing at a 7.63% CAGR, highlights the increasing recognition of the critical role fortification plays during the first 1,000 days of life. Research consistently demonstrates that mineral fortification during this period can result in significant lifelong benefits, including improved cognitive development and enhanced metabolic health. This growing awareness is driving demand for fortified products tailored to meet the specific nutritional needs of infants and young children. Governments and healthcare organizations are also emphasizing the importance of early-life nutrition through initiatives and programs aimed at reducing malnutrition and promoting fortified products. Furthermore, advancements in product formulations, such as the inclusion of bioavailable mineral compounds, are enhancing the efficacy of these products, making them more appealing to health-conscious parents and caregivers.



By Form:
Powder Stability Versus Nano InnovationPowders held a significant 55.01% share of the mineral fortification market in 2025, primarily due to their cost-effectiveness in logistics and extended shelf life. These premixes are widely used across various applications, including food and beverages, dietary supplements, and animal nutrition, as they offer a convenient and stable method for delivering essential minerals. Their ability to maintain mineral stability during storage and transportation makes them a preferred choice for manufacturers aiming to enhance product longevity and reduce costs. Additionally, powdered premixes are easy to handle and integrate into production processes, further driving their adoption in the market.
Meanwhile, nano-forms are emerging as a transformative innovation in the mineral fortification market, showcasing a robust 8.25% CAGR. These advanced formulations enable higher nutrient loading without altering the sensory profile of the final product, such as imparting a metallic taste. This technological advantage has opened up new opportunities for fortification in previously challenging applications, including clear beverages and high-acid foods. Nano-forms also offer improved bioavailability, ensuring better absorption of minerals by the human body, which is a critical factor in addressing nutritional deficiencies. As a result, they are gaining traction among manufacturers seeking to develop premium fortified products that cater to evolving consumer demands for health and wellness.
By Mineral Type:
Calcium Dominance Meets Zinc InnovationIn 2025, calcium accounted for 34.28% of the mineral fortification market, maintaining its position as a key component in various food products such as cereals, plant-based milks, and baked goods. Its widespread consumer recognition and the enforcement of government mandates for calcium fortification in flour have been instrumental in sustaining its market volume. Additionally, manufacturers are focusing on innovations to improve calcium's solubility at neutral pH levels, addressing challenges like sedimentation in ready-to-drink (RTD) beverages. These advancements aim to enhance the usability of calcium in diverse applications, ensuring its continued relevance in the market.
Zinc is the fastest-growing mineral in the fortification market, with a compound annual growth rate (CAGR) of 7.09%. The surge in demand for zinc is largely attributed to increased consumer awareness following research that highlights its critical role in supporting immune health, particularly in the post-pandemic era. This heightened focus on immunity has driven the incorporation of zinc into a broader range of fortified products. As consumers prioritize health and wellness, the market for zinc fortification is expected to expand further, supported by ongoing research and product development efforts aimed at maximizing its benefits.
Geography Analysis
Europe Mineral Fortification Market
Europe holds a 35.02% share of the mineral fortification market in 2025, supported by comprehensive regulatory frameworks, established fortification programs, and strong consumer acceptance of functional foods. Decades of systematic nutrition policy implementation have fostered a robust market environment. Countries like Germany and the United Kingdom lead in fortification initiatives, with government-backed programs ensuring widespread adoption. Additionally, the European Union's stringent food safety and labeling regulations enhance consumer trust, further solidifying the region's dominance in the market. The region also benefits from a high level of consumer awareness regarding the health benefits of fortified foods, supported by active participation from both public and private sectors.
APAC Mineral Fortification Market
The Asia-Pacific market is growing at a CAGR of 6.05% through 2031, driven by urbanization, higher disposable incomes, and increased health awareness among middle-class consumers. Regulatory developments, such as Japan's Good Manufacturing Practices for Food with Function Claims supplements and South Korea's Customised Health Functional Food System, support market growth. In India and China, government programs to address malnutrition through food fortification, combined with private sector development of affordable fortified products, are expanding the market. The Food Safety and Standards Authority of India (FSSAI) promotes the fortification of staple foods including rice, wheat, and milk to reduce micronutrient deficiencies.
The Americas and MEA Mineral Fortification Market
North America holds a significant market share due to its voluntary fortification initiatives and widespread supplement consumption. The region's stringent regulations regarding health claims create entry barriers for new companies while benefiting established manufacturers. South America and the Middle East and Africa present growth opportunities through government-mandated fortification programs and international development initiatives.

Regulatory Landscape
Mineral fortification is shaped by both mandatory staple-food programs and voluntary fortification policies, with growing emphasis on national food control systems, labeling compliance, and alignment to international guidance. The World Health Assembly resolution WHA76.19 (2023) reinforced WHO’s mandate to support Member States with guidance and standards for addressing micronutrient malnutrition through fortification, strengthening the policy basis for large-scale interventions across cereals, salt, and edible oils.
Regulatory governance and compliance expectations are also tightening through updated guidance and coordinated frameworks. In the United States, FDA fortification policy and nutrition labeling requirements influence product formulation and claims, alongside the Uniform Compliance Date for Food Labeling Regulations for products marketed through December 31, 2026. Internationally, WHO issued updated guidance in November 2025 on fortifying edible oils and fats with vitamins A and D, while in May 2026 the OECD opened a public consultation on Draft Good Practice Principles for effective regulatory governance of large-scale food fortification, indicating continued movement toward measurable program oversight and more consistent regulatory practices.
Value Chain Analysis
The mineral fortification value chain begins with sourcing mineral inputs (including mined ores and brines). Chemical refining follows to reach food-grade purity, along with conversion into usable forms such as inorganic salts, citrates, phosphates, and higher-bioavailability chelates. Downstream, specialty processing such as microencapsulation or nano-formulation helps address stability and organoleptic constraints, before premix blending and packaging (often under GMP controls) feed manufacturing of fortified food, beverages, dietary supplements, infant nutrition, and animal nutrition.
Midstream capacity and quality systems are differentiators, since producers must meet both technical performance and regulatory dossier requirements across multiple geographies. A concrete example is Budenheim’s May 2024 opening of its House of Nutrition facility in Germany (5,000 square meters, 4,400 tonnes per year capacity) for high-purity calcium, magnesium, and iron phosphates, supporting a more reliable supply of refined mineral ingredients. Downstream adoption is strengthened through structured multi-stakeholder programs linking premix suppliers, equipment and process partners, and local millers or oil producers; Buhler joining the Millers for Nutrition coalition (December 2024) and the subsequent launch of the Millers for Nutrition initiative in Pakistan (July 2025) also show how implementation capacity, QA, and training integrate into the operating value chain in mandated fortification markets.
Competitive Landscape
The mineral fortification market demonstrates moderate fragmentation, highlighting significant competitive opportunities for both established multinational corporations and specialized technology providers. The market is characterized by the presence of key players such as DSM-Firmenich, BASF, and Cargill, who dominate through their strategic approaches. These companies leverage vertical integration, managing the entire supply chain from raw material sourcing to the delivery of finished products. This strategy not only ensures cost efficiency but also enhances product quality and consistency, giving them a competitive edge in the market.
Market leaders are heavily focused on innovation, with substantial investments in research and development to maintain their technological advantage. For instance, DSM-Firmenich introduced Dry Vitamin A Palmitate NI, a product designed to address stability challenges in flour fortification. This innovation features enhanced particle size and a clean-label formulation, catering to the growing demand for clean-label products in the food industry. Similarly, BASF has been actively developing micronutrient premixes tailored to specific regional dietary deficiencies, while Cargill focuses on fortification solutions that integrate seamlessly into existing food production processes. These examples underscore the emphasis on product differentiation and meeting diverse consumer needs.
In addition to product innovation, companies are also exploring partnerships and acquisitions to strengthen their market position. For example, collaborations with local food manufacturers enable global players to expand their reach and adapt to regional preferences. The competitive landscape is further shaped by the entry of specialized technology providers, who bring niche expertise and innovative solutions to the market. This dynamic environment fosters continuous advancements, ensuring that the mineral fortification market remains a critical component of addressing global nutritional challenges.
Global Mineral Fortification Industry Leaders
-
BASF SE
-
Cargill, Incorporated
-
DSM-Firmenich AG
-
Archer Daniels Midland Company
-
Merck KGaA
- *Disclaimer: Major Players sorted in no particular order
Global Mineral Fortification Market Companies Covered in this Report
- Cargill Incorporated
- Archer Daniels Midland Company
- BASF SE
- DSM-Firmenich
- Croda International Plc
- Solutex GC, S.L.
- Clover Corporation Limited
- Kerry Group Plc
- Evonik Industries AG
- Lonza Group
- Cabio Biotech (Wuhan) Co., Ltd.
- Stepan Company
- Aker BioMarine ASA
- GC Rieber VivoMega AS
- Polaris S.A.S.
- Merck KGaA
- Epax Norway AS
- NOF EUROPE GmbH
- Lipoid GmbH
- Lipidome Lifesciences

Market Opportunities and Future Outlook
Near-term opportunities concentrate where large-scale fortification programs and higher-compliance customer segments (especially infant and early-life nutrition and regulated supplements) raise expectations for traceability, audit readiness, and tighter blending tolerances. In March 2026, dsm-firmenich completed a USD 10 million modernization at its Schenectady, New York premix site, adding 35 new blending units and upgrading powder conditioning to support food and infant nutrition customers in the Americas, which points to ongoing investment in higher-capability premix manufacturing for more complex mineral and micronutrient blends.
Program-driven scale-up and standardized implementation toolkits also create room for premix suppliers and local manufacturers to partner on compliant fortification of staples such as flour and edible oils. The NI-FFI Fortification Framework (2025) and UNICEF guidance (2024) reinforce the operational building blocks for national fortification delivery, while WHO’s continued work on food fortification guidance and strengthening national food control systems sustains demand for formulations that align with local standards and inspection regimes. This setting supports growth in tailored premixes, more stable mineral delivery formats including encapsulated and nano-form solutions for challenging matrices, and services that reduce formulation risk for manufacturers operating across multiple regulatory jurisdictions.
Recent Industry Developments in Global Mineral Fortification Market
- March 2026: dsm-firmenich completed a USD 10 million modernization project at its Schenectady, New York nutritional premix facility, adding 35 new blending units and upgrading material flow and powder conditioning. The upgrade strengthens supply capability for food and infant nutrition customers in the Americas and supports higher-complexity fortification blends with more stringent quality and traceability needs.
- March 2025: dsm-firmenich partnered with MedAccess to secure ceiling pricing for vitamin A and D3 blends used in edible oil fortification in low- and middle-income countries. The agreement supports affordability and procurement stability for public health fortification programs, improving continuity for manufacturers and implementers operating under budget constraints.
- September 2024: dsm-firmenich launched Dry Vitamin A Palmitate NI, a dry form designed to improve stability in wheat flour fortification. The product targets a common technical hurdle in large-scale fortification, helping mills and premix users maintain nutrient levels across processing and storage while meeting program specifications.


Global Mineral Fortification Market Report Scope and Research Methodology
Market Definition and Coverage
This market covers the value of minerals added to food and drink, dietary supplements, and animal feed to improve nutritional content. The scope includes premixes and direct mineral inputs sold for fortification use.
Scope exclusions: Products positioned only as general nutrition enhancers without a defined mineral fortification claim, and non-mineral fortifiers (such as vitamins and probiotics), are excluded.
Segments Covered in This Report
-
By Application
- Fortified Food Products
- Fortified Beverages
- Dietary Supplements
- Infant and Early-Life Nutrition
- Animal Nutrition
-
By Mineral Type
- Iron
- Calcium
- Zinc
- Iodine
- Selenium
- Others
-
By Form
- Powder
- Liquid
- Encapsulated/Micro-encapsulated
- Nano-form
-
By Geography
-
North America
- United States
- Canada
- Mexico
- Rest of North America
-
Europe
- Germany
- United Kingdom
- France
- Italy
- Spain
- Netherlands
- Sweden
- Poland
- Belgium
- Rest of Europe
-
Asia-Pacific
- China
- India
- Japan
- Australia
- South Korea
- Indonesia
- Thailand
- Singapore
- Rest of Asia-Pacific
-
South America
- Brazil
- Argentina
- Peru
- Colombia
- Chile
- Rest of South America
-
Middle East and Africa
- Saudi Arabia
- South Africa
- United Arab Emirates
- Nigeria
- Egypt
- Morocco
- Turkey
- Rest of Middle East and Africa
-
North America
Data Sources, Market Sizing, and Validation
Desk Research
Desk work starts by pinning down where fortification demand is visible in public records, and then linking it back to minerals and the food and feed categories that use them. We typically review sources such as Codex Alimentarius guidance, World Health Organization and UNICEF nutrition materials, Food and Agriculture Organization datasets, and national food regulator publications, including fortification standards and labeling rules.
To keep assumptions realistic, we also check government trade statistics and customs dashboards where available, peer reviewed nutrition journals for prevalence and efficacy signals, and company filings or investor presentations for product mix hints and capacity commentary. A limited set of paid subscriptions is used only to speed up company financials and news screening, and to cross check patent activity tied to mineral delivery formats. This desk source list is not exhaustive, and many other public references were used for data collection, validation, and clarification during analysis.
Primary Interviews and Surveys
Primary inputs come from structured calls and short surveys with ingredient suppliers, premix blenders, food and beverage manufacturers, supplement brands, animal nutrition formulators, and a few domain specialists who track fortification programs across regions. We use these discussions to test adoption levels by application, typical dosing and mix trends, pricing movement, and which regulations actually translate into commercial volumes in APAC, EMEA, and the Americas.
Distribution of primary research fieldwork respondents
| Company type | Respondent position | Region |
|---|---|---|
| Top tier: 33% | CXOs: 12% | APAC: 38% |
| Mid tier: 52% | Functional/Unit leaders: 33% | EMEA: 37% |
| Smaller Players: 15% | Managers: 55% | Americas: 25% |
Market-Sizing & Forecasting
Sizing is built by reconstructing the demand pool from consumption and production patterns in fortified end products, then translating that into mineral fortification value using application level usage and price assumptions. A top-down approach is used by mapping fortified food, beverage, supplement, and animal feed volumes to typical mineral inclusion rates. That result is then adjusted for regulation led penetration and voluntary fortification intensity.
The totals are corroborated with selective bottom-up approximations, such as supplier and premix revenue checkpoints, sampled price per kg ranges by mineral form, and channel discussions on what share of output is truly sold for fortification. Key inputs we lean on include fortified staple consumption trends, changes in mandatory fortification rules, relative movement between calcium, iron, zinc, and iodine mixes, the share shift toward powder versus liquid formats, and reported inflation in ingredient pricing and freight. Where a bottom-up view is incomplete, such as when private companies disclose limited detail, gaps are handled through ratio based expansion from comparable markets, then tested again in interviews.
Forecasting uses scenario analysis supported by a simple multivariate regression on drivers like population growth, packaged food volumes, supplement penetration, and regulatory coverage. The final pathway is selected after expert checks on what is feasible for industry supply and reformulation cycles.
Data Validation & Update Cycle
Validation is done by comparing model output against independent signals, such as fortified product launch activity, stated national fortification coverage, and consistency between application shares and known consumption patterns. Outliers are reviewed, assumptions are revisited, and if a variance remains large, we re contact relevant respondents to understand whether it is a real market shift or a data timing issue.
Before sign off, the model and key assumptions go through a multi step analyst review, so calculation logic, unit conversions, and currency handling remain consistent. The report is refreshed annually, and interim updates are made when material events occur, such as major regulatory changes or sharp ingredient price moves. Right before delivery, a final pass is completed so clients receive the latest updated view.
Mordor Intelligence's Mineral Fortification Market Estimate Compared With Other Published Estimates
Published market values for mineral fortification do not always match because research teams often use different definitions, different base years, and different ways to treat pricing and adoption in fortified foods, supplements, and animal nutrition.
In practice, gaps usually come from what is counted as fortification revenue, how quickly pricing is assumed to move for mineral inputs, and whether mandatory programs are treated as fully complied with or only partially realized in actual demand. Currency timing, inclusion of premix blending margins, and how updates are handled after regulation changes can also shift the final number.
Benchmark comparison
| Source | Market Size | Gaps in Research Methodology |
|---|---|---|
| Mordor Intelligence | USD 73.63 B (2026) | |
| Industry Publisher A | USD 69.70 B (2024) | Uses an earlier base year and a longer forecast window, and its application framing is broader. This can pull in adjacent nutrition enhancement activity that is not always tied to a fortification claim. |
| Global Consultancy B | USD 73.17 B (2025) | Anchors on a different base year and may treat penetration from fortification policies more aggressively. This can lift demand estimates if compliance and enforcement are assumed to be high across all end markets. |
Non-mineral fortifiers (such as vitamin enrichment) sit outside Mordor Intelligence's scope, which helps keep the value tied to mineral-only inputs and their fortification-led use across food, supplements, and feed. Looking across the three figures, the spread is mainly explained by base-year timing and how closely policy driven uptake is converted into real commercial volumes. These items can be checked and rechecked with clear variables.


Key Questions Answered in the Report
How large is the mineral fortification market in 2026?
The mineral fortification market size is USD 73.63 billion in 2026 and is projected to reach USD 96.39 billion by 2031 at a 5.53% CAGR.
Which application segment is growing fastest?
Infant and early-life nutrition shows the highest 7.63% CAGR, reflecting public-health focus on the first 1,000 days of life.
Why is zinc fortification gaining traction?
Zinc’s link to immune and cognitive health, combined with research showing potential to cut inadequate intake prevalence by half through mandated programs, underpins its 7.09% CAGR.
Which region offers the strongest growth opportunity?
Asia-Pacific is advancing at 6.05% CAGR, propelled by urbanization, rising incomes, and large-scale government fortification initiatives.
Page last updated on:


 Your data is secure and never sold or shared.


