Millimeter Wave Technology Market Size and Share
Market Overview
| Study Period | 2020 - 2032 |
|---|---|
| Market Size (2026) | USD 5.61 Billion |
| Market Size (2032) | USD 20.5 Billion |
| Growth Rate (2026 - 2032) | 24.11% CAGR |
| Fastest Growing Market | Asia Pacific |
| Largest Market | Asia Pacific |
| Market Concentration | Medium |
Major Players *Disclaimer: Major Players sorted in no particular order Image © Mordor Intelligence. Reuse requires attribution under CC BY 4.0. | |

Millimeter Wave Technology Market Analysis by Mordor Intelligence
The Millimeter Wave Technology Market size is expected to grow from USD 4.52 billion in 2025 to USD 5.61 billion in 2026 and is forecast to reach USD 20.5 billion by 2032 at 24.11% CAGR over 2026-2032.
Network operators are turning to frequencies above 24 GHz for capacity relief, and defense agencies are upgrading radar systems to 94 GHz for higher-resolution targeting. Dual demand arising from dense 5G rollouts and early 6G trials sustains capital spending, while falling device costs encourage adoption in medical imaging, industrial automation, and automotive ADAS. Asia Pacific commands the largest regional position thanks to multi-million-site 5G deployments, whereas North America drives innovation through spectrum liberalization and CHIPS-Act-backed semiconductor funding. Component suppliers benefit from patent-protected RF front-ends, yet supply-chain exposure to gallium-nitride wafers introduces strategic risk.
Key Report Takeaways
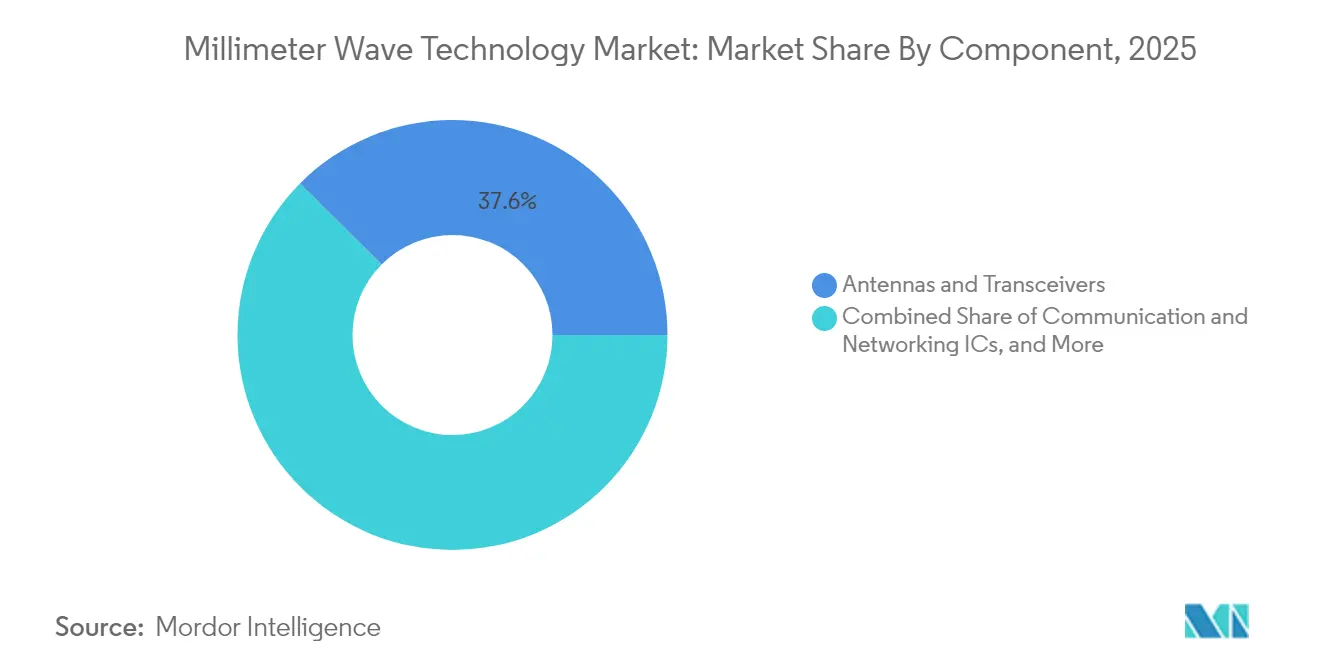
- By component, Antennas and Transceivers led with 37.55% revenue share in 2025; Imaging Sensors are forecast to expand at a 24.86% CAGR through 2031.
- By licensing model, the Fully/Partly Licensed segment held 77.20% of the millimeter wave technology market share in 2025, while Unlicensed bands recorded the highest projected CAGR at 25.60% to 2031.
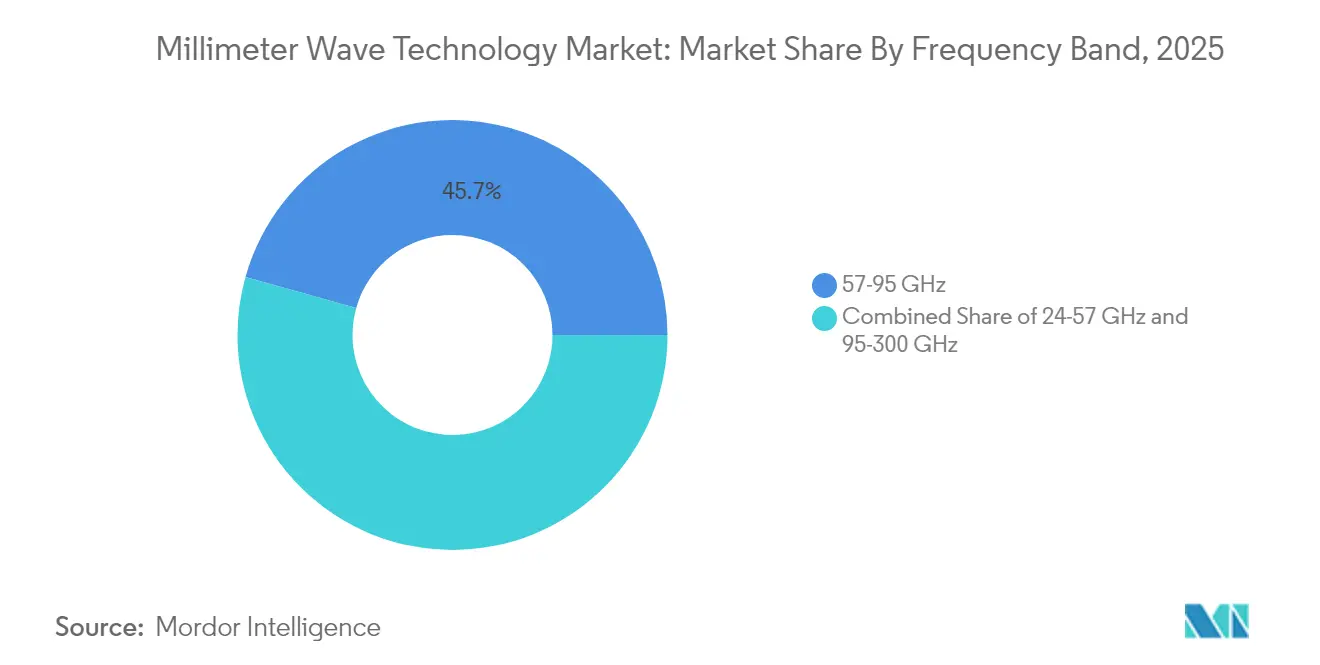
- By frequency band, the 57-95 GHz range accounted for 45.65% of the millimeter wave technology market size in 2025, and the 95-300 GHz band is advancing at a 25.90% CAGR through 2031.
- By application, Telecom Infrastructure captured 53.20% of the millimeter wave technology market size in 2025; Automotive ADAS and V2X are growing fastest at 26.20% CAGR to 2031.
- By geography, Asia Pacific occupied 41.60% of the millimeter wave technology market share in 2025 and is rising at a 27.20% CAGR through 2031.
Note: Market size and forecast figures in this report are generated using Mordor Intelligence’s proprietary estimation framework, updated with the latest available data and insights as of 2026.
Global Millimeter Wave Technology Market Trends and Insights
Drivers Impact Analysis*
| Driver | (~) % Impact on CAGR Forecast | Geographic Relevance | Impact Timeline |
|---|---|---|---|
| 5G network densification and small-cell backhaul demand | +6.20% | Global with a concentration in Asia Pacific and North America | Medium term (2-4 years) |
| Rising mobile and fixed-wireless data traffic in 24–100 GHz bands | +5.80% | Global, strongest in Asia Pacific and Europe | Short term (≤ 2 years) |
| Spectrum liberalisation and new auctions above 40 GHz | +4.10% | North America and Europe, emerging in the Asia Pacific | Long term (≥ 4 years) |
| Defense radar upgrades to 94 GHz for low-latency targeting | +3.70% | North America and Europe, selective in the Middle East | Medium term (2-4 years) |
| Source: Mordor Intelligence | |||


5G network densification and small-cell backhaul demand
Operators quickly discover that fiber becomes uneconomical when small-cell density exceeds urban zoning caps, so 60 GHz and E-band radio links are adopted to connect sites within weeks instead of months. Field trials in China, the United States, and India deliver multi-gigabit throughput, confirming that millimeter-wave backhaul can substitute for high-cost trenching activities. Equipment vendors now integrate software-defined beam steering to reduce alignment time, while urban authorities streamline rooftop permitting to accelerate site activation. Capital efficiency and time-to-market gains make wireless backhaul a cornerstone of the millimeter wave technology market.
Rising mobile and fixed-wireless data traffic in 24–100 GHz bands
Fixed-wireless customers consume up to five times the data of mobile subscribers, forcing operators to allocate contiguous 28 GHz blocks to residential gateways. Regulatory agencies respond by harmonizing 70/80/90 GHz rules to enable wider channels, and chipset makers have announced second-generation CPE platforms with integrated AI for link optimization. These advances support rural broadband programs and stimulate demand across the millimeter wave technology market.
Spectrum liberalization and new auctions above 40 GHz
The FCC is finalizing sharing frameworks for the 37 GHz band, and Europe is evaluating unpaired 42 GHz allocations for 5G-Advanced use cases. License holders view contiguous blocks above 95 GHz as future assets for terabit-per-second links. Early capital commitments by satellite-to-cell and industrial-sensor vendors intensify bidding interest, underpinning long-term growth for the millimeter wave technology market.
Defense radar upgrades to 94 GHz
Procurement budgets earmark USD 647 million for SPY-6 radar deliveries and USD 213 million for upgraded Sentinel systems that exploit 94 GHz for low-latency detection[2]Theresa Hitchens, “Navy Adds USD 647 Million to Raytheon SPY-6 Contract,” govconwire.com. Shared R&D between defense primes and commercial fabs shortens design cycles, enabling dual-use chips suitable for both military and civilian mmWave applications. The convergence lowers unit costs and sustains volume growth.
Restraints Impact Analysis*
| Restraint | (~) % Impact on CAGR Forecast | Geographic Relevance | Impact Timeline |
|---|---|---|---|
| RF front-end thermal management limits above 100 GHz | -3.40% | Global, acute in high-temperature environments | Medium term (2-4 years) |
| High-cost phased-array calibration in volume production | -2.80% | Global, higher impact in cost-sensitive markets | Short term (≤ 2 years) |
| Source: Mordor Intelligence | |||
RF front-end thermal management limits above 100 GHz
Heat concentration rises disproportionately as frequency increases, pushing gallium-nitride devices toward junction temperatures that degrade reliability. Advanced packaging using diamond substrates and micro-fluidic cooling is under evaluation, yet these approaches add material cost and prolong qualification cycles. Until scalable thermal solutions emerge, near-term deployments will cluster below 100 GHz, tempering the millimeter wave technology market’s upper-band growth.
High-cost phased-array calibration in volume production
Current automated test equipment cannot efficiently characterize thousands of antenna elements per module, doubling end-of-line costs in consumer devices. Start-ups are developing self-calibrating beamformers and over-the-air test techniques, but commercial roll-out remains two years away[4]Sivers Semiconductors, “FR3 Beamformer Wins CHIPS Grant,” sivers-semiconductors.com. This cost hurdle limits the deep penetration of millimeter-wave hardware into mid-priced handsets and IoT sensors.
*Our forecasts treat driver/restraint impacts as directional, not additive. The impact forecasts reflect baseline growth, mix effects, and variable interactions.
Segment Analysis
By Component: Imaging Sensors Open New Clinical Frontiers
Imaging Sensors deliver the fastest 24.86% CAGR through 2031, as terahertz imaging enables label-free tissue diagnosis in oncology and burn assessment. In contrast, Antennas and Transceivers preserve the largest 37.55% share in 2025 by supplying radio front-ends for mobile base stations. The millimeter wave technology market size for Imaging Sensors is expected to cross USD 3.25 billion by 2031 as hospitals adopt non-ionizing diagnostic tools. Complementary growth in Communication and Networking ICs arises from densified macro-cell deployments, while Interface and Control ICs ride the trend toward radar-on-chip integration.
R&D breakthroughs such as NTT’s 280 Gbps signal generation at 300 GHz improve link budgets and stimulate demand for frequency-agile synthesizers. Meanwhile, Other Components, chiefly advanced substrates and thermal interface materials, gain visibility as integrators seek higher power density. The result is a broadening component stack that anchors the millimeter wave technology market.


By Licensing Model: Unlicensed Bands Lower Entry Barriers
Fully or Partly Licensed spectrum delivered 77.20% of 2025 revenue, reflecting the premium attached to interference-free operations in telecom macro cells and defense networks. However, unlicensed allocations above 95 GHz advance at 25.60% CAGR as regulators create industrial presence-sensing rules that require minimal paperwork. SMEs leverage the simplified regime to deploy factory-floor radar for robotics and quality inspection, adding fresh revenue streams to the millimeter wave technology market.
Vendors now introduce dual-mode chipsets that auto-detect regulatory environments and adjust EIRP settings in real time, removing a key adoption barrier. Licensed spectrum will remain critical for mission-critical links, yet the unlicensed surge broadens the overall addressable base.
By Frequency Band: Sub-Terahertz Momentum Builds
The 57-95 GHz band held 45.65% millimeter wave technology market size in 2025, buoyed by 60 GHz indoor WiGig and 77 GHz automotive radar. Attention is shifting to the 95-300 GHz range, forecast to expand at 25.90% CAGR as 6G trials and imaging radar demand ever-wider bandwidths. Demonstrations at 300 GHz reach 280 Gbps over laboratory distances, validating the physics for future terabit links.
Component makers focus on waveguide-free packaging to cut insertion loss and ease assembly, while test-equipment suppliers invest in sub-THz vector-network analyzers. These innovations strengthen the foundation of the millimeter wave technology market and accelerate ecosystem readiness for commercial sub-terahertz rollouts.
By Application: Automotive ADAS Shifts Toward Imaging Radar
Telecom Infrastructure maintained a 53.20% share in 2025 as carriers raced to meet 5G capacity targets, yet Automotive ADAS advances at 26.20% CAGR on the promise of 4D imaging radar that outperforms legacy 24 GHz sensors in resolution and range. Vehicle platforms now specify 76-81 GHz corner radars for blind-spot detection and 90 GHz forward-looking units for adaptive cruise control.
Fixed-Wireless Access gains traction in suburban areas where fiber remains cost-prohibitive, and factory automation adds demand for precision presence sensing at 122 GHz. Medical and life-science imaging capitalizes on label-free diagnostics, while aerospace and defense communications sustain steady investment cycles. Collectively, these diversified use cases reinforce the millimeter wave technology market’s long-term growth narrative.
Geography Analysis
Asia Pacific commands 41.60% of 2025 revenue and is forecast to grow at 27.20% CAGR through 2031, propelled by China’s 4.4 million 5G base stations and India’s rapid FWA penetration. Regional governments allocate public funds to 5G-Advanced research, and contract manufacturers invest in gallium-nitride wafer lines to localize supply. Japan’s private 5G model shows slower mmWave uptake due to site-acquisition complexity, but corporate campuses are piloting 60 GHz indoor networks for AR training.
North America aligns spectrum policy with industrial innovation, releasing 37 GHz and 70/80/90 GHz bands while channeling CHIPS-Act incentives toward domestic fabs. Defense radar upgrades and fixed-wireless deployments underpin a resilient customer base, and partnerships such as Nokia-T-Mobile secure multi-year equipment pipelines. Canada adopts mmWave for rural broadband pilots, further expanding the millimeter wave technology market.
Europe positions itself as a technology laboratory. Germany supports 6G testbeds and micro-electronics clusters, and regulators craft 42 GHz auction terms that prioritize manufacturing innovation. Automotive radar demand from German OEMs drives collaboration with specialist chipmakers, while the UK explores 60 GHz transport-infrastructure links. The Middle East invests in smart-city proof-of-concepts, South Africa pilots 28 GHz FWA, and Brazil introduces targeted tax breaks for mmWave CPE assembly. Although revenue contributions from these emerging markets remain single-digit, growth rates surpass mature regions, adding dynamism to the millimeter wave technology market.


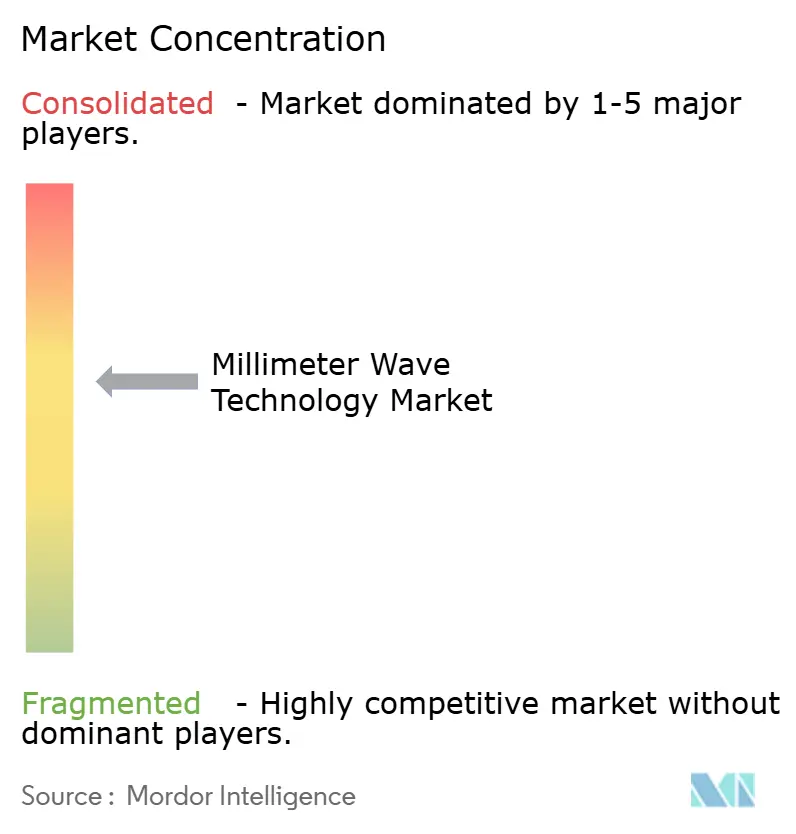
Competitive Landscape
Market concentration remains moderate as no single firm exceeds one-third of global shipments. Horizontal platform providers Qualcomm, Nokia, and Ericsson leverage broad patent portfolios to supply chipsets and RAN software across multiple verticals. Vertical specialists such as Arbe Robotics and Aeva differentiate through application-specific algorithms embedded in radar SoCs, securing design wins in Chinese and European automotive programs.
Acquisition activity intensifies: Qorvo bought Anokiwave for USD 31 million to secure beamforming IP, while Keysight committed USD 1.46 billion for Spirent to bolster test automation in sub-THz domains. Foundries expand gallium-nitride capacity after Polymatech’s USD 130 million investment in India, but wafer availability remains a bottleneck. Software-defined radios and AI-based channel estimation are emerging battlegrounds where hardware incumbents face competition from cloud-native entrants. The competitive narrative centers on time-to-market, thermal efficiency, and software differentiation all pivotal to success in the millimeter wave technology market.
Millimeter Wave Technology Industry Leaders
BridgeWave Communications (REMEC)
Ducommun Incorporated
Millimeter Wave Products Inc.
Intel Corporation
Siklu Communication (Ceragon)
- *Disclaimer: Major Players sorted in no particular order

Recent Industry Developments
- June 2025: NTT achieved 280 Gbps signal generation in the 300 GHz band, advancing sub-terahertz communications.
- June 2025: Raytheon secured USD 647 million SPY-6 radar production contract incorporating mmWave arrays.
- May 2025: Qualcomm and e& partnered on AI-powered 5G edge solutions in the UAE using mmWave spectrum.
- April 2025: Nokia won a strategic 5G RAN deal with T-Mobile US to extend nationwide mmWave coverage.


Research Methodology Framework and Report Scope
Market Definitions and Key Coverage
Our study defines the millimeter-wave technology market as the total annual revenue generated from hardware components, antennas, transceivers, frequency sources, imaging sensors, interface and RF modules, operating in the 24 GHz-300 GHz band across telecom infrastructure, automotive ADAS, security screening, medical imaging, and short-haul backhaul links.
Scope exclusion: services, software stacks, and sub-6 GHz 5G radio equipment are deliberately left out to keep the focus on discrete mmWave hardware value only.
Segmentation Overview
- By Component
- Antennas and Transceivers
- Communication and Networking ICs
- Interface and Control ICs
- Frequency Generation and Filters
- Imaging Sensors
- Other Components
- By Licensing Model
- Fully/Partly Licensed
- Unlicensed
- By Frequency Band
- 24-57 GHz
- 57-95 GHz
- 95-300 GHz
- By Application
- Telecom Infrastructure (RAN and backhaul)
- Mobile and Consumer Devices
- Fixed Wireless Access (FWA)
- Radar and Security Imaging
- Automotive ADAS and V2X
- Industrial Automation and IIoT
- Medical and Life-Sciences Imaging
- Aerospace and Defense Communications
- Other Applications
- By Geography
- North America
- United States
- Canada
- Mexico
- South America
- Brazil
- Argentina
- Rest of South America
- Europe
- United Kingdom
- Germany
- France
- Italy
- Russia
- Rest of Europe
- Asia-Pacific
- China
- Japan
- India
- South Korea
- Rest of Asia-Pacific
- Middle East and Africa
- Middle East
- United Arab Emirates
- Saudi Arabia
- Turkey
- Rest of Middle East
- Africa
- Nigeria
- South Africa
- Rest of Africa
- Middle East
- North America
Detailed Research Methodology and Data Validation
Primary Research
Mordor analysts interviewed network operators in Asia, component fabricators in North America, and procurement leads at European automakers. These discussions clarified average selling prices, yield ramps, and realistic installation rates, which in turn fine-tuned the model assumptions drawn from desk work.
Desk Research
We began with structured mining of freely available tier-1 datasets such as the Federal Communications Commission equipment authorization files, International Telecommunication Union spectrum notices, UN Comtrade customs codes for HS 8529 and HS 8525 exports, and regional telecom regulator deployment filings (for example, Ofcom and NCC). Patent analytics from Questel helped us size emerging imaging sensors, while D&B Hoovers fiscal snapshots informed vendor revenue break-outs. Filings, investor decks, and trade association briefs from bodies such as the GSMA and GSA rounded out supply-side fundamentals. The sources cited here are illustrative; many other outlets were interrogated to triangulate figures and fill contextual gaps.
Market-Sizing & Forecasting
We constructed a top-down demand pool that starts with active base-station counts, airport scanner installs, and premium vehicle production. We then applied mmWave penetration ratios and calibrated ASP curves. Supplier roll-ups and channel checks offered bottom-up anchors that we used to cross-verify totals. Key variables like 5G base-station densification, automotive radar attach rates, spectrum auction timelines, component yield improvements, and regional capital-expenditure cycles drive our multivariate regression forecast. Scenario analysis bridges data voids where bottom-up granularity is sparse, ensuring realistic bounds around our 2025-2031 outlook.
Data Validation & Update Cycle
Outputs pass a three-layer review: automated variance flags, senior-analyst peer checks, and a final sign-off round. Values are compared with satellite indicators like GaN wafer shipments and E-band link orders; anomalies trigger re-contacts. Reports refresh yearly, and any material event, large spectrum auction or safety recall, prompts a swift interim update before client delivery.
Why Mordor's Millimeter Wave Technology Baseline Is Consistently Reliable
Published estimates often diverge because firms mix products, start from different base years, or assume uniform price erosion before cross-checking with the supply chain.
Key gap drivers include mismatched component scopes, bundled sensor markets, varied refresh cadences, and currency conversions frozen at announcement date rather than average-year rates. Mordor's disciplined filter keeps only 24-300 GHz hardware, aligns currencies to IMF yearly averages, and blends conservative ASP glide paths with real-world channel feedback, giving decision-makers a steadier baseline.
Benchmark comparison
| Market Size | Anonymized source | Primary gap driver |
|---|---|---|
| USD 4.52 billion (2025) | Mordor Intelligence | - |
| USD 3.03 billion (2024) | Global Consultancy A | Narrower hardware scope; excludes imaging modules and uses straight-line ASP decline |
| USD 5.18 billion (2024) | Industry Portal B | Bundles sensors and modules; aggressive AR/VR device multipliers inflate totals |
In short, the disciplined scope choices, blended top-down/bottom-up model, and live expert validation allow Mordor Intelligence to deliver a balanced, transparent baseline that clients can trace back to clear variables and replicate with confidence.


Key Questions Answered in the Report
What is the current size of the millimeter wave technology market and how fast is it growing?
The market stands at USD 5.61 billion in 2026 and is projected to reach USD 20.5 billion by 2032, reflecting a 24.11% CAGR.
Which region leads the millimeter wave technology market?
Asia Pacific holds 41.60% revenue share in 2025 and is expanding at a 27.20% CAGR through 2031, outpacing every other region.
What application segment is projected to grow fastest?
Automotive ADAS and V2X posts the highest 26.20% CAGR to 2031 due to demand for high-resolution imaging radar.
Which frequency band offers the greatest near-term revenue, and which is slated for the fastest growth?
The 57-95 GHz band captures 45.65% of 2025 revenue, while the 95-300 GHz range is forecast to expand at a 25.90% CAGR.
Why are unlicensed bands gaining traction in this market?
New 95 GHz-plus allocations and simplified rules for industrial sensing lower entry barriers, driving a 25.60% CAGR for unlicensed deployments.
What primary challenge could limit adoption above 100 GHz?
RF front-end thermal management remains the chief technical restraint, exerting a negative 3.4% impact on the forecast CAGR.
Page last updated on:


