Market Overview
| Study Period | 2021 - 2031 |
|---|---|
| Forecast Data Period | 2026 - 2031 |
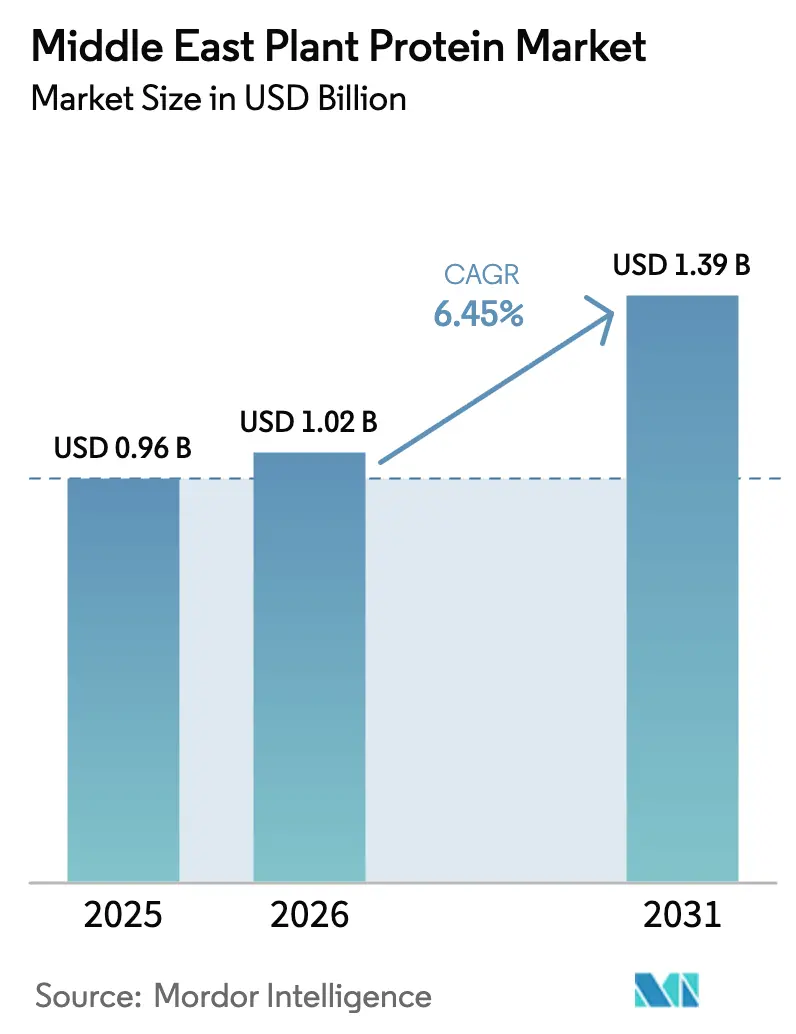
| Base Year Market Size (2025) | USD 0.96 Billion |
| Market Size (2026) | USD 1.02 Billion |
| Market Size (2031) | USD 1.39 Billion |
| Growth Rate (2026 - 2031) | 6.45% CAGR |
| Market Concentration | Medium |
Major Players*Disclaimer: Major Players sorted in no particular order Image © Mordor Intelligence. Reuse requires attribution under CC BY 4.0. |
|
Middle East Plant Protein Market Analysis by Mordor Intelligence
The Middle East plant protein market size was USD 0.96 billion in 2025, is projected to be USD 1.02 billion in 2026, and is forecasted to be USD 1.39 billion by 2031, growing at a CAGR of 6.45% from 2026 to 2031. Government food-security mandates, rising consumer health awareness, and fresh capital flowing into local processing plants underpin this expansion. Saudi Arabia’s National Food Security Strategy and the UAE’s National Food Security Strategy 2051 formalize alternative-protein procurement, while Iran’s new biorefineries supply concentrates that displace imports[1]Source: Ministry of Climate Change and Environment, "National Food Security Strategy", moccae.gov.ae. Structural dependence on food imports that exceed a major share in several Gulf states makes plant proteins a strategic hedge, and multinationals are pairing with regional innovators to close taste and texture gaps[2]Source: Organization for Economic Co-operation and Development, "Food import", oecd.org.
Key Report Takeaways
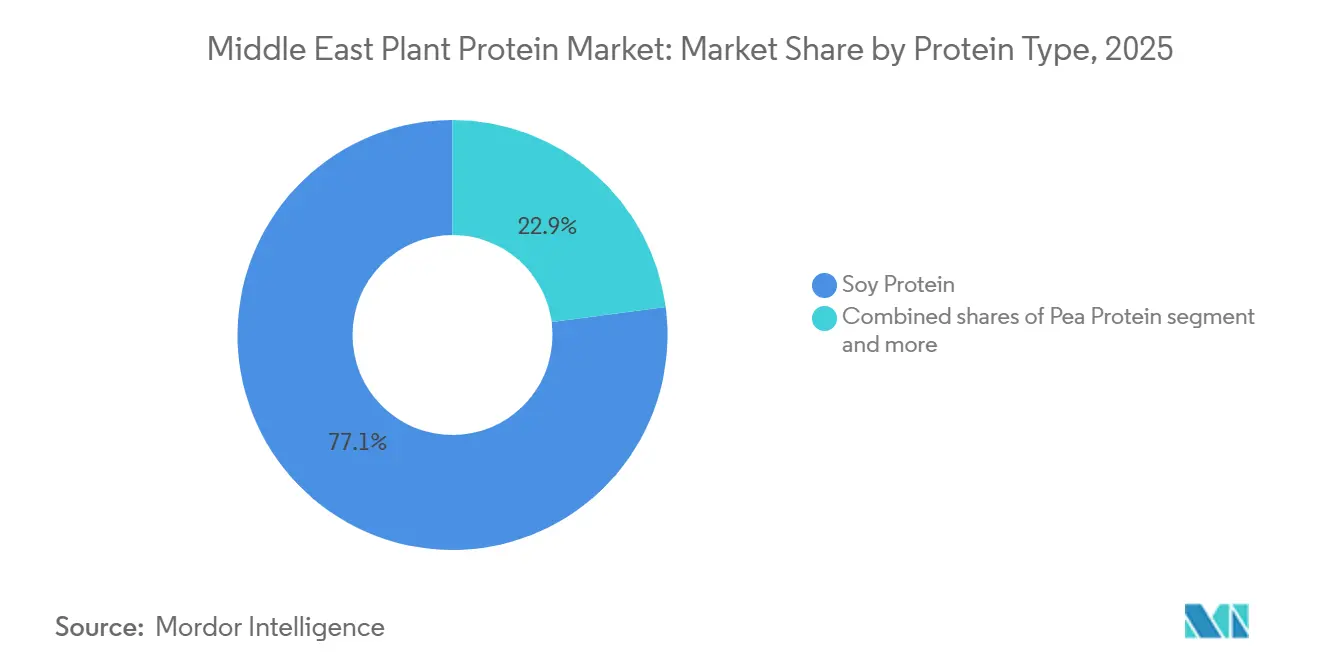
- By protein type, soy led with a 77.03% share of the plant protein market in 2025; pea protein is set to grow at a 7.32% CAGR from 2026 to 2031.
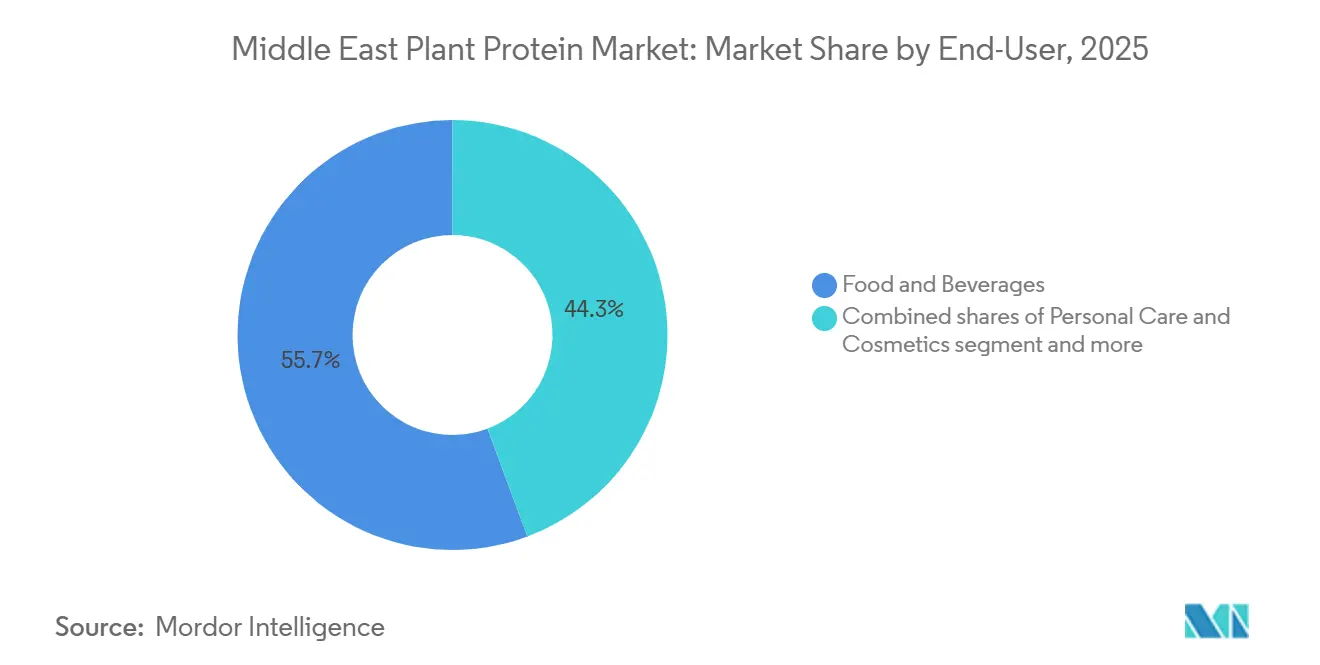
- By end user, food and beverages accounted for 55.67% of the plant protein market size in 2025; personal care and cosmetics are the fastest-growing end-user segment at 7.45% CAGR through 2031.
- By geography, Saudi Arabia captured 58.04% of the plant protein market share in 2025; Iran is projected to advance at an 8.03% CAGR to 2031.
Note: Market size and forecast figures in this report are generated using Mordor Intelligence’s proprietary estimation framework, updated with the latest available data and insights as of January 2026.
Middle East Plant Protein Market Trends and Insights
Drivers Impact Analysis*
| Driver | (~) % Impact on CAGR Forecast | Geographic Relevance | Impact Timeline |
|---|---|---|---|
| Consumers embrace health consciousness | +1.2% | Saudi Arabia, UAE, urban Iran | Short term (≤ 2 years) |
| Surge in popularity of fitness and sports nutrition | +1.3% | Saudi Arabia, UAE, Kuwait | Medium term (2-4 years) |
| Expansion of the food and beverage industry with plant-based product innovation | +1.5% | Global, strongest in Saudi Arabia, UAE | Medium term (2-4 years) |
| Advancements in protein extraction technologies | +0.8% | Global adoption lag in the Middle East | Long term (≥ 4 years) |
| Rising interest in clean-label, halal-certified, sustainable options | +1.4% | Saudi Arabia, UAE, Iran | Short term (≤ 2 years) |
| Government initiatives boosting local food production | +1.1% | Saudi Arabia, UAE, Iran | Medium term (2-4 years) |
| Source: Mordor Intelligence | |||
Consumers Embrace Health Consciousness
Middle Eastern shoppers are shifting purchase decisions toward cholesterol-free, lower-fat proteins amid wider wellness campaigns. According to studies, Saudi Arabia and the UAE prioritize healthy diets, with the majority of them taking dietary supplements, and some portion focusing on consuming protein shakes every week. These preferences are reinforced by the UAE’s National Nutrition Strategy 2030, which directs public-sector caterers to offer lower-saturated-fat meals[3]Source: Ministry of Health and Prevention, "National Nutrition Strategy 2030", mohap.gov.ae. Ingredient houses now supply hydrolyzed or fermented variants that improve digestibility and mouthfeel, helping the plant protein market secure repeat purchases despite lingering taste skepticism.
Surge in Popularity of Fitness and Sports Nutrition
Fitness center memberships in Saudi Arabia grew at a 16.8% compound rate from 2020 to 2023, while the UAE posted 5.8% growth, driven by the Dubai Fitness Challenge and Vision 2030’s Quality-of-Life Program, according to the SAUDISPORTS.SA. Female participation is expanding on a year-on-year basis as women-only gyms and outdoor facilities open. These consumers favor halal-certified pea and rice isolates that rival whey for amino-acid completeness, pushing sports-nutrition brands such as Optimum Nutrition to double-digit volume gains in 2024. This demographic shift is fueling demand for plant-based sports nutrition products that carry halal certification, a non-negotiable for observant Muslim consumers.
Expansion of Food and Beverage Industry with Plant-Based Product Innovation
Food and beverage manufacturers across the Middle East launched over 50 plant-based SKUs in 2024 and 2025, spanning dairy alternatives, meat analogs, and fortified bakery products, as retailers allocate shelf space to capture flexitarian demand. Almarai, the Gulf's largest dairy producer, introduced plant-based milk alternatives in 2024, signaling a hedging strategy as younger consumers reduce dairy consumption for environmental and digestive reasons. Iffco's Nurishh plant-based cheese and Viva brand extensions in the UAE reflect similar positioning, leveraging existing cold-chain infrastructure and distributor relationships to minimize go-to-market friction. The UAE's novel-food regulatory framework, formalized under Cabinet Decree 10/2014 and updated in 2022, provides a clear pathway for ingredient approvals, reducing time-to-market for imported protein isolates and concentrates.
Rising Interest in Clean-Label, Halal-Certified, and Sustainable Protein Options
Halal certification infrastructure in the Middle East has matured rapidly, with the UAE registering 7,585 halal-certified products in 2022, 6,581 in food and 1,004 in cosmetics and personal care, under standards UAE.S 2055-1 and UAE.S 2055-4. This regulatory clarity reduces compliance risk for multinational ingredient suppliers and enables local co-packers to scale production without navigating fragmented certification regimes. Saudi Arabia's Halal Mark Track initiative, launched in 2024, integrates ESG criteria into halal certification, rewarding suppliers that demonstrate water-use efficiency and carbon-footprint transparency. This policy evolution favors plant proteins over conventional animal proteins, particularly in institutional procurement where sustainability mandates are increasingly binding.
Restraints Impact Analysis*
| Restraint | (~) % Impact on CAGR Forecast | Geographic Relevance | Impact Timeline |
|---|---|---|---|
| Higher cost of plant protein products compared to conventional animal proteins | -1.8% | Saudi Arabia, UAE, Iran | Short term (≤ 2 years) |
| Dependence on imported raw plant protein materials and supply-chain complexity | -1.2% | Saudi Arabia, UAE | Medium term (2-4 years) |
| Limited domestic processing infrastructure for isolates and concentrates | -1.5% | Saudi Arabia, UAE, Iran | Long term (≥ 4 years) |
| Cultural preferences and limited awareness outside urban centers | -1.0% | Iran, rural Saudi Arabia | Medium term (2-4 years) |
| Source: Mordor Intelligence | |||
Higher Cost of Plant Protein Products Compared to Conventional Animal Proteins
Plant-protein retail pricing in the Middle East remains above conventional animal-protein equivalents, a premium that narrows adoption to affluent urban households and constrains mass-market penetration. This cost gap stems from import duties on finished goods, limited economies of scale in regional production, and the absence of subsidies that benefit domestic poultry and dairy sectors in Saudi Arabia and the UAE. Soybean meal, the dominant protein source in poultry feed, traded at approximately USD 450 per tonne in 2024, while pea protein isolates commanded USD 2,500-3,500 per tonne, creating a structural barrier for feed formulators seeking to diversify protein sources. Price volatility in soybean imports, driven by Brazilian harvest cycles and freight-rate fluctuations, compounds this challenge, as Middle Eastern buyers lack the crushing capacity to arbitrage bean-to-meal spreads. Until regional extraction facilities achieve sufficient throughput to compete with South American and North American suppliers, plant-protein adoption will remain concentrated in premium segments.
Limited Domestic Processing Infrastructure for Isolates and Concentrates
The Middle East's reliance on imported protein isolates and concentrates exposes the value chain to freight disruptions and currency risk, while forgoing the margin capture available through domestic extraction and texturization. The GCC imported USD 1.8 billion of plant-based protein ingredients in 2021, predominantly from Ireland, the United States, and the Netherlands, with minimal local value-added processing beyond blending and packaging. Iran's Kermanshah biorefinery, operational since 2024, represents a rare exception, leveraging domestic oilseed production to produce protein concentrates for food and feed applications. The UAE and Saudi Arabia have announced ambitions to build crushing and fractionation capacity, yet capital-expenditure commitments remain modest relative to the scale required to displace imports.
*Our forecasts treat driver/restraint impacts as directional, not additive. The impact forecasts reflect baseline growth, mix effects, and variable interactions.
Segment Analysis
By Protein Type: Pea Protein Gains as Soy Dominance Persists
Soy protein held a 77.03% share in 2025, reflecting decades of supply-chain optimization, entrenched use in animal feed, and cost competitiveness relative to alternative sources. The Middle East imported 8.5 million tonnes of soybeans in 2023, primarily from Brazil, the United States, and Argentina, with the majority crushed for meal used in poultry and aquaculture rations, according to the USDA Foreign Agricultural Service. Ingredion's VITESSENCE Pea 200 D, launched in October 2024, delivers improved solubility and neutral flavor, addressing historical barriers to pea-protein adoption in beverages and nutrition bars. Roquette expanded its NUTRALYS portfolio in February 2024 with textured, hydrolysed, and high-gel variants, enabling formulators to achieve meat-like textures in plant-based burgers and sausages.
Pea protein is forecast to grow at 7.32% annually from 2026 to 2031, driven by clean-label positioning, allergen-free status, and functional improvements that enable use in dairy alternatives and meat analogs. Wheat protein, derived from gluten, finds application in bakery and meat-analog products, leveraging the Middle East's substantial wheat imports. Rice protein appeals to formulators targeting allergen-sensitive consumers, though its amino-acid profile requires blending with complementary sources to achieve complete nutrition. Other plant proteins, including chickpea and fava bean, are gaining traction as Tate & Lyle's acquisition of Nutriati and Roquette's May 2024 launch of NUTRALYS Fava S900M, a 90% protein isolate, signal ingredient diversification to mitigate supply-chain concentration risk.


By End User: Personal Care Emerges Alongside Food Dominance
Personal care and cosmetics applications are expanding at 7.45% annually through 2031, outpacing the 6.45% overall market growth, as formulators incorporate plant-derived peptides, amino acids, and proteins for skin-barrier repair, hair strengthening, and anti-aging formulations. AlUla Peregrina, a Saudi biotech venture launched in April 2025, extracts bioactive compounds from Moringa Peregrina for cosmetics, aligning with Vision 2030's emphasis on indigenous natural resources. The UAE's halal cosmetics framework, codified under UAE.S 2055-4, mandates ingredient traceability and prohibits animal-derived inputs not meeting halal slaughter standards, creating a structural advantage for plant proteins, according to the UAE Ministry of Industry and Advanced Technology.
Food and beverages captured 55.67% of end-user demand in 2025, spanning dairy alternatives such as Almarai's plant-based milk and Iffco's Nurishh cheese, meat analogs from Switch Foods and Americana, and fortified bakery products incorporating pea and soy protein for texture and nutrition. Supplements, including baby food, infant formula, elderly nutrition, and sports performance products, leverage plant proteins to address lactose intolerance and allergen concerns, with Nestlé's USD 72 million Jeddah facility producing CERELAC and infant formulas incorporating plant-based ingredients. Animal feed remains a significant end-user segment, with soybean meal and wheat gluten serving as cost-effective protein sources in poultry and aquaculture rations, though price volatility and import dependency drive interest in locally sourced alternatives such as fava bean and chickpea meal.
Geography Analysis
Saudi Arabia commanded a 58.04% share in 2025, underpinned by Vision 2030 initiatives that prioritize food security, halal integrity, and domestic value-chain development. The Ministry of Environment, Water, and Agriculture has partnered with plant-based food companies, including Ayla's Choice and Al-Rasheed Greenhouses, to pilot controlled-environment agriculture and alternative-protein production. The kingdom's Halal Mark Track initiative, launched in 2024, integrates ESG criteria into halal certification, rewarding suppliers that demonstrate water-use efficiency and carbon-footprint transparency, a policy evolution that favors plant proteins over conventional animal proteins, according to the Saudi Food and Drug Authority.
Iran is forecast to grow at 8.03% annually through 2031, the fastest rate in the region, as domestic biorefinery investments and plasma-technology processing plants reduce reliance on imports constrained by sanctions. Iran's population of 88 million and rising urbanization create latent demand for convenient, shelf-stable protein products, though purchasing-power constraints and limited retail infrastructure outside Tehran and major cities temper near-term growth. The UAE accounted for a smaller share in 2024 but benefits from the densest concentration of innovation infrastructure, including Abu Dhabi Investment Office partnerships with EVERY Company and Vivici for precision-fermentation protein production, announced in October 2025, and the Food Tech Valley initiative that provides co-location and regulatory fast-tracking for agrifood startups.
The rest of the Middle East, encompassing Kuwait, Oman, Qatar, Bahrain, and smaller markets, exhibits heterogeneous adoption patterns. Kuwait's high per-capita income and expatriate population drive demand for premium plant-based products, while Oman and Qatar prioritize food-security investments that include alternative-protein pilot projects. Kerry Group's December 2025 opening of a Customer Co-Creation Centre in Expo City Dubai, offering rapid prototyping and sensory adaptation for Middle Eastern palates, illustrates the multinational commitment to regional customization.

Competitive Landscape
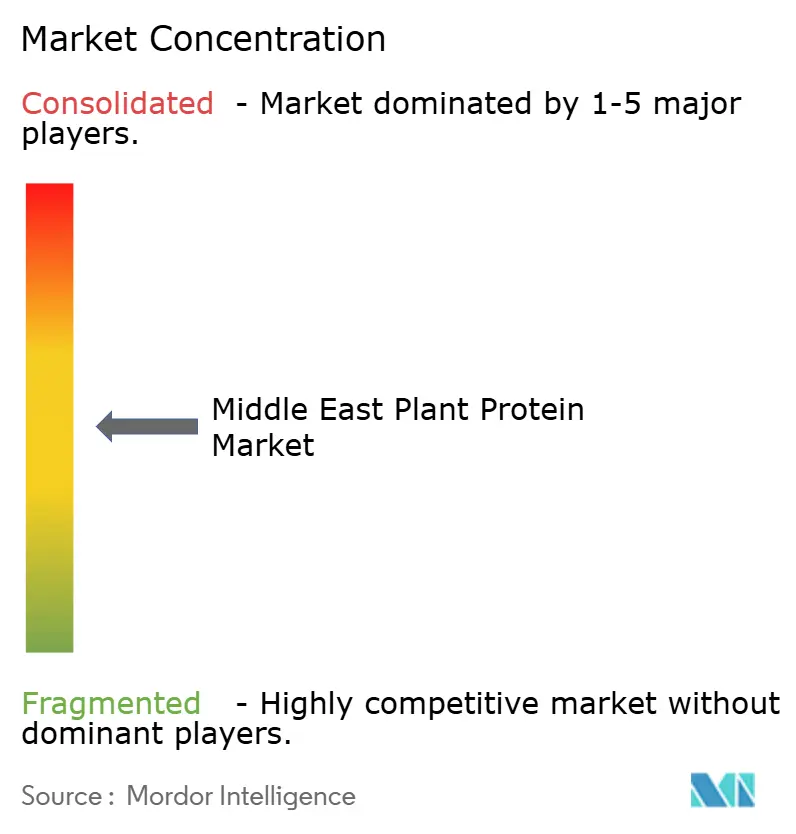
The Middle East plant protein market exhibits moderate fragmentation, reflecting competition between multinational ingredient suppliers, Cargill, ADM, DuPont, Kerry, Ingredion, Roquette, Glanbia, Tate & Lyle, Wilmar, and regional disruptors such as Pure Harvest Smart Farms, Switch Foods, and Yalla Nutrition. Multinationals leverage global R&D networks, halal-certified production facilities, and established distributor relationships to capture institutional demand from food manufacturers and feed formulators, while regional players exploit agility, local sourcing, and direct-to-consumer channels to build brand loyalty among health-conscious urban consumers.
Kerry Group's December 2025 launch of a Customer Co-Creation Centre in Dubai exemplifies the co-manufacturing strategy, enabling rapid prototyping of plant-protein applications tailored to Middle Eastern taste preferences and regulatory requirements. Pure Harvest Smart Farms' USD 100 million Series B round in December 2024 and expansion to Riyadh in 2025 signal investor confidence in controlled-environment agriculture as a pathway to local protein production, though the company's current focus on fresh produce limits near-term plant-protein revenue. White-space opportunities center on infant nutrition, elderly medical nutrition, and halal-certified cosmetics, segments where plant proteins can command premiums and where regulatory clarity reduces go-to-market friction.
Impossible Foods' 2021 patent US11051532B2, which describes alkaline-pH protein purification yielding higher yields and 2-10× stronger gels, illustrates the technical frontier that could unlock cost parity with animal proteins if adapted to Middle Eastern oilseed and pulse varieties. Emerging disruptors face capital-intensity barriers in extraction and texturization, yet partnerships with government-backed food-security initiatives, such as the UAE's Food Tech Valley and Saudi Arabia's Vision 2030 programs, provide subsidized infrastructure access and regulatory fast-tracking. The UAE's halal certification framework, which registered 7,585 products in 2022 under standards UAE.S 2055-1 and UAE.S 2055-4, reduces compliance risk and enables rapid scaling for suppliers that achieve certification.
Middle East Plant Protein Industry Leaders
-
Cargill, Incorporated
-
CHS Inc.
-
International Flavors & Fragrances, Inc.
-
Kerry Group PLC
-
Wilmar International Ltd
- *Disclaimer: Major Players sorted in no particular order

Recent Industry Developments
- January 2026: The UAE government is actively investing in building infrastructure, regulatory frameworks, and partnerships to become an alternative protein production hub, including plant-based proteins in the broader protein ecosystem. These policy moves likely boost demand for functional plant protein ingredients (soy, pea, etc.) and help attract ingredient suppliers, though this article focuses on policy and market creation rather than a specific ingredient launch.
- June 2025: ACI Group announced an expanded plant-based protein ingredient line that includes pea protein, soy protein, and wheat protein formats, plus a multi-protein concentrate blend. This range includes isolated pea protein (~83%), texturized pea protein flakes, isolated soy protein, soy protein nuggets, and wheat protein formats designed for meat alternatives, baked goods, protein bars, beverages, etc., marking a concrete ingredient supplier development relevant to Middle East and global food manufacturers.


Middle East Plant Protein Market Report Scope
The plant protein market comprises protein-rich ingredients and finished goods derived from plant sources like soy, peas, wheat, and nuts. The Middle East Plant Protein Market is Segmented by Protein Type (Hemp Protein, Pea Protein, Potato Protein, Rice Protein, Soy Protein, Wheat Protein, and More), End User (Animal Feed, Food and Beverages, Personal Care and Cosmetics, and Supplements), and Geography (Iran, Saudi Arabia, United Arab Emirates, Rest of Middle East). The Market Forecasts are Provided in Terms of Value (USD).
Protein Type
| Hemp Protein |
| Pea Protein |
| Potato Protein |
| Rice Protein |
| Soy Protein |
| Wheat Protein |
| Other Plant Protein |
End User
| Animal Feed | |
| Food and Beverages | Bakery |
| Beverages | |
| Breakfast Cereals | |
| Condiments/Sauces | |
| Confectionery | |
| Dairy and Dairy Alternative Products | |
| Meat/Poultry/Seafood and Meat‑Alternative Products | |
| RTE/RTC Food Products | |
| Snacks | |
| Personal Care and Cosmetics | |
| Supplements | Baby Food and Infant Formula |
| Elderly / Medical Nutrition | |
| Sport / Performance Nutrition |
Geography
| Saudi Arabia |
| Iran |
| United Arab Emirates |
| Rest of the Middle East |
| Protein Type | Hemp Protein | |
| Pea Protein | ||
| Potato Protein | ||
| Rice Protein | ||
| Soy Protein | ||
| Wheat Protein | ||
| Other Plant Protein | ||
| End User | Animal Feed | |
| Food and Beverages | Bakery | |
| Beverages | ||
| Breakfast Cereals | ||
| Condiments/Sauces | ||
| Confectionery | ||
| Dairy and Dairy Alternative Products | ||
| Meat/Poultry/Seafood and Meat‑Alternative Products | ||
| RTE/RTC Food Products | ||
| Snacks | ||
| Personal Care and Cosmetics | ||
| Supplements | Baby Food and Infant Formula | |
| Elderly / Medical Nutrition | ||
| Sport / Performance Nutrition | ||
| Geography | Saudi Arabia | |
| Iran | ||
| United Arab Emirates | ||
| Rest of the Middle East | ||


Market Definition
- End User - The Protein Ingredients Market operates on a B2B basis. Food, Beverages, Supplements, Animal Feed, and Personal Care & Cosmetic manufacturers are considered to be end-consumers in the market studied. The scope excludes manufacturers buying liquid/dry whey to be used for application as a binding agent or thickener or other non-protein applications.
- Penetration Rate - Penetration Rate is defined as the percentage of Protein-Fortified End User Market Volume in the Overall End User Market Volume.
- Average Protein Content - Average protein content is the average protein content present per 100 g of product manufactured by all end-user companies considered under the scope of this report.
- End User Market Volume - End-user market volume is the consolidated volume of all types and forms of end-user products in the country or region.
| Keyword | Definition |
|---|---|
| Alpha-lactalbumin (α-Lactalbumin) | It is a protein that regulates the production of lactose in the milk of almost all mammalian species. |
| Amino acid | It is an organic compound that contains both amino and carboxylic acid functional groups, which are required for the synthesis of body protein and other important nitrogen-containing compounds, such as creatine, peptide hormones, and some neurotransmitters. |
| Blanching | It is the process of briefly heating vegetables with steam or boiling water. |
| BRC | British Retail Consortium |
| Bread improver | It is a flour-based blend of several components with specific functional properties designed to modify dough characteristics and give quality attributes to bread. |
| BSF | Black Soldier Fly |
| Caseinate | It is a substance produced by adding an alkali to acid casein, a derivative of casein. |
| Celiac disease | Celiac disease is an immune reaction to eating gluten, a protein found in wheat, barley, and rye. |
| Colostrum | It is a milky fluid that’s released by mammals that have recently given birth before breast milk production begins. |
| Concentrate | It is the least processed form of protein and has a protein content ranging from 40-90% by weight. |
| Dry protein basis | It refers to the percentage of "pure protein" present in a supplement after the water in it is completely removed through heat. |
| Dry whey | It is the product resulting from drying fresh whey which has been pasteurized and to which nothing has been added as a preservative. |
| Egg protein | It is a mixture of individual proteins, including ovalbumin, ovomucoid, ovoglobulin, conalbumin, vitellin, and vitellenin. |
| Emulsifier | It is a food additive that facilitates the blending of foods that are immiscible with one another, such as oil and water. |
| Enrichment | It is the process of addition of micronutrients that are lost during the processing of the product. |
| ERS | Economic Research Service of the USDA |
| Extrusion | It is the process of forcing soft mixed ingredients through an opening in a perforated plate or die designed to produce the required shape. The extruded food is then cut to a specific size by blades. |
| Fava | Also known as Faba, it is another word for yellow split beans. |
| FDA | Food and Drug Administration |
| Flaking | It is a process in which typically a cereal grain (like corn, wheat, or rice) is broken down into grits, cooked with flavors and syrups, and then pressed into flakes between cooled rollers. |
| Foaming agent | It is a food ingredient that makes it possible to form or maintain a uniform dispersion of a gaseous phase in a liquid or solid food. |
| Foodservice | It refers to the part of the food industry which includes businesses, institutions, and companies which prepare meals outside the home. It includes restaurants, school and hospital cafeterias, catering operations, and many other formats. |
| Fortification | It is the deliberate addition of micronutrients that are not found in them naturally or which are lost during processing, to improve a food product's nutritional value. |
| FSANZ | Food Standards Australia New Zealand |
| FSIS | Food Safety and Inspection Service |
| FSSAI | Food Safety and Standards Authority of India |
| Gelling agent | It is an ingredient that functions as a stabilizer and thickener to provide thickening without stiffness through the formation of gel. |
| GHG | Greenhouse Gas |
| Gluten | It is a family of proteins found in grains, including wheat, rye, spelt, and barley. |
| Hemp | It is a botanical class of Cannabis sativa cultivars grown specifically for industrial or medicinal use. |
| Hydrolysate | It is a form of protein manufactured by exposing the protein to enzymes that can partially break the bonds between the protein's amino acids and break down large, complicated proteins into smaller pieces. Its processing makes it easier and quicker to digest. |
| Hypoallergenic | It refers to a substance that causes fewer allergic reactions. |
| Isolate | It is the purest and most processed form of protein which has undergone separation to obtain a pure protein fraction. It typically contains ≥ 90% of protein by weight. |
| Keratin | It is a protein that helps form hair, nails, and the outer layer of skin. |
| Lactalbumin | It is the albumin contained in milk and obtained from whey. |
| Lactoferrin | It is an iron‑binding glycoprotein that is present in the milk of most mammals. |
| Lupin | It is the yellow legume seeds of the genus Lupinus. |
| Millenial | Also known as Generation Y or Gen Y, it refers to the people born from 1981 to 1996. |
| Monogastric | It refers to an animal with a single-compartmented stomach. Examples of monogastric include humans, poultry, pigs, horses, rabbits, dogs, and cats. Most monogastric are generally unable to digest much cellulose food materials such as grasses. |
| MPC | Milk protein concentrate |
| MPI | Milk protein isolate |
| MSPI | Methylated soy protein isolate |
| Mycoprotein | Mycoprotein is a form of single-cell protein, also known as fungal protein, derived from fungi for human consumption. |
| Nutricosmetics | It is a category of products and ingredients that act as nutritional supplements to care for skin, nails, and hair natural beauty. |
| Osteoporosis | It is a medical condition in which the bones become brittle and fragile from loss of tissue, typically as a result of hormonal changes, or deficiency of calcium or vitamin D. |
| PDCAAS | Protein digestibility-corrected amino acid score (PDCAAS) is a method of evaluating the quality of a protein based on both the amino acid requirements of humans and their ability to digest it. |
| Per-capita consumption of animal protein | It is the average amount of animal protein (such as milk, whey, gelatin, collagen, and egg proteins) that is readily available for consumption by each person in an actual population. |
| Per-capita consumption of plant protein | It is the average amount of plant protein (such as soy, wheat, pea, oat, and hemp proteins) that is readily available for consumption by each person in an actual population. |
| Quorn | It is a microbial protein manufactured using mycoprotein as an ingredient, in which the fungus culture is dried and mixed with egg albumen or potato protein, which acts as a binder, and then is adjusted in texture and pressed into various forms. |
| Ready-to-Cook (RTC) | It refers to food products that include all of the ingredients, where some preparation or cooking is required through a process that is given on the package. |
| Ready-to-Eat (RTE) | It refers to a food product prepared or cooked in advance, with no further cooking or preparation required before being eaten. |
| RTD | Ready-to-Drink |
| RTS | Ready-to-Serve |
| Saturated fat | It is a type of fat in which the fatty acid chains have all single bonds. It is generally considered unhealthy. |
| Sausage | It is a meat product made of finely chopped and seasoned meat, which may be fresh, smoked, or pickled and which is then usually stuffed into a casing. |
| Seitan | It is a plant-based meat substitute made out of wheat gluten. |
| Softgel | It is a gelatin-based capsule with a liquid fill. |
| SPC | Soy protein concentrate |
| SPI | Soy protein isolate |
| Spirulina | It is a biomass of cyanobacteria that can be consumed by humans and animals. |
| Stabilizer | It is an ingredient added to food products to help maintain or enhance their original texture, and physical and chemical characteristics. |
| Supplementation | It is the consumption or provision of concentrated sources of nutrients or other substances that are intended to supplement nutrients in the diet and is intended to correct nutritional deficiencies. |
| Texturant | It is a specific type of food ingredient that is used to control and alter the mouthfeel and texture of food and beverage products. |
| Thickener | It is an ingredient that is used to increase the viscosity of a liquid or dough and make it thicker, without substantially changing its other properties. |
| Trans fat | Also called trans-unsaturated fatty acids or trans fatty acids, it is a type of unsaturated fat that naturally occurs in small amounts in meat. |
| TSP | Textured soy protein |
| TVP | Textured vegetable protein |
| WPC | Whey protein concentrate |
| WPI | Whey protein isolate |


Research Methodology
Mordor Intelligence follows a four-step methodology in all our reports.
- Step-1: Identify Key Variables: The quantifiable key variables (industry and extraneous) pertaining to the specific product segment and country are selected from a group of relevant variables & factors based on desk research & literature review; along with primary expert inputs. These variables are further confirmed through regression modeling (wherever required).
- Step-2: Build a Market Model: In order to build a robust forecasting methodology, the variables and factors identified in Step-1 are tested against available historical market numbers. Through an iterative process, the variables required for market forecast are set and the model is built on the basis of these variables.
- Step-3: Validate and Finalize: In this important step, all market numbers, variables and analyst calls are validated through an extensive network of primary research experts from the market studied. The respondents are selected across levels and functions to generate a holistic picture of the market studied.
- Step-4: Research Outputs: Syndicated Reports, Custom Consulting Assignments, Databases & Subscription Platforms


