Market Overview
| Study Period | 2021 - 2031 |
|---|---|
| Forecast Data Period | 2026 - 2031 |
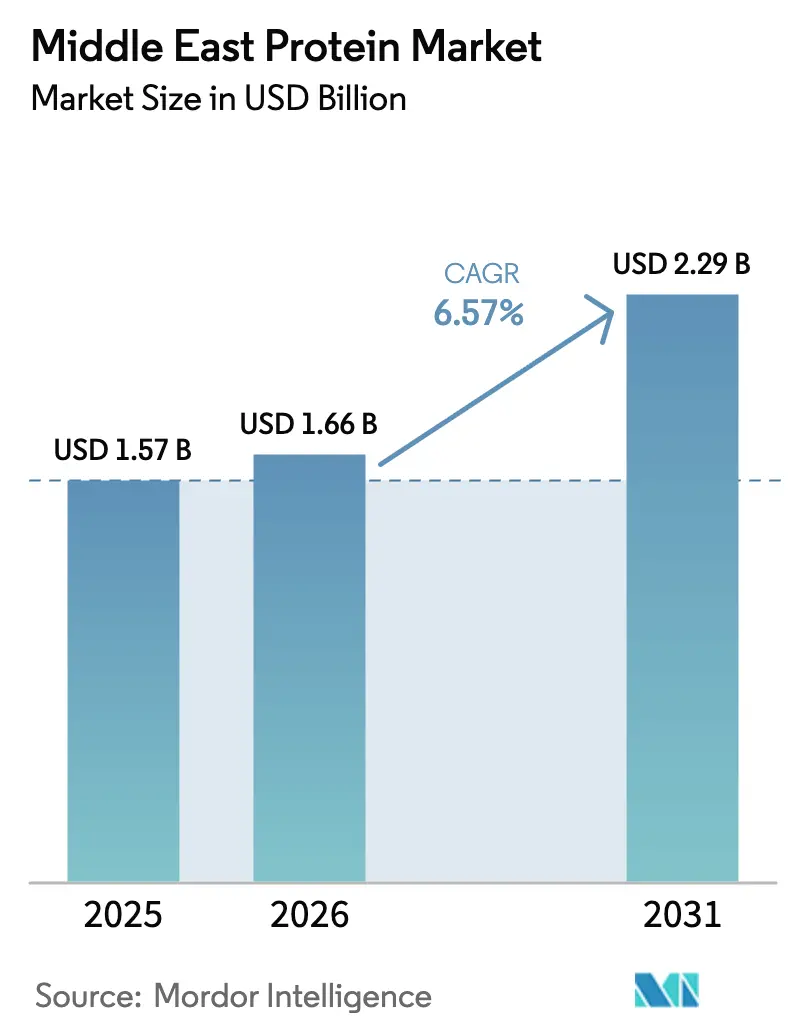
| Base Year Market Size (2025) | USD 1.57 Billion |
| Market Size (2026) | USD 1.66 Billion |
| Market Size (2031) | USD 2.29 Billion |
| Growth Rate (2026 - 2031) | 6.57% CAGR |
| Market Concentration | Medium |
Major Players
*Disclaimer: Major Players sorted in no particular order Image © Mordor Intelligence. Reuse requires attribution under CC BY 4.0. |
|
Middle East Protein Market Analysis by Mordor Intelligence
The Middle East protein market size is expected to increase from USD 1.57 billion in 2025 to USD 1.66 billion in 2026 and reach USD 2.29 billion by 2031, growing at a CAGR of 6.57% over 2026-2031. This growth trajectory reflects the region's accelerating shift toward functional nutrition, driven by sovereign food-security mandates and rising consumer affluence. Saudi Arabia's Vision 2030 agriculture investments, which allocated USD 10.67 billion to food security initiatives in 2024, are channelling capital into domestic protein production infrastructure that reduces import dependency [1]Source: Saudi Ministry of Environment, Water and Agriculture, "Saudi Arabia's Vision 2030", mewa.gov.sa. The UAE's National Food Security Strategy 2051 similarly prioritizes local protein manufacturing, with the government targeting 50% self-sufficiency in strategic food categories by 2030 [2]Source: Ministry of Climate Change and Environment, "Services", moccae.gov.ae. Competitive intensity is escalating as local players leverage halal certification and Arabic labeling to differentiate against multinational brands, while cold-chain infrastructure gaps in secondary cities create distribution bottlenecks that favor vertically integrated suppliers.
Key Report Takeaways
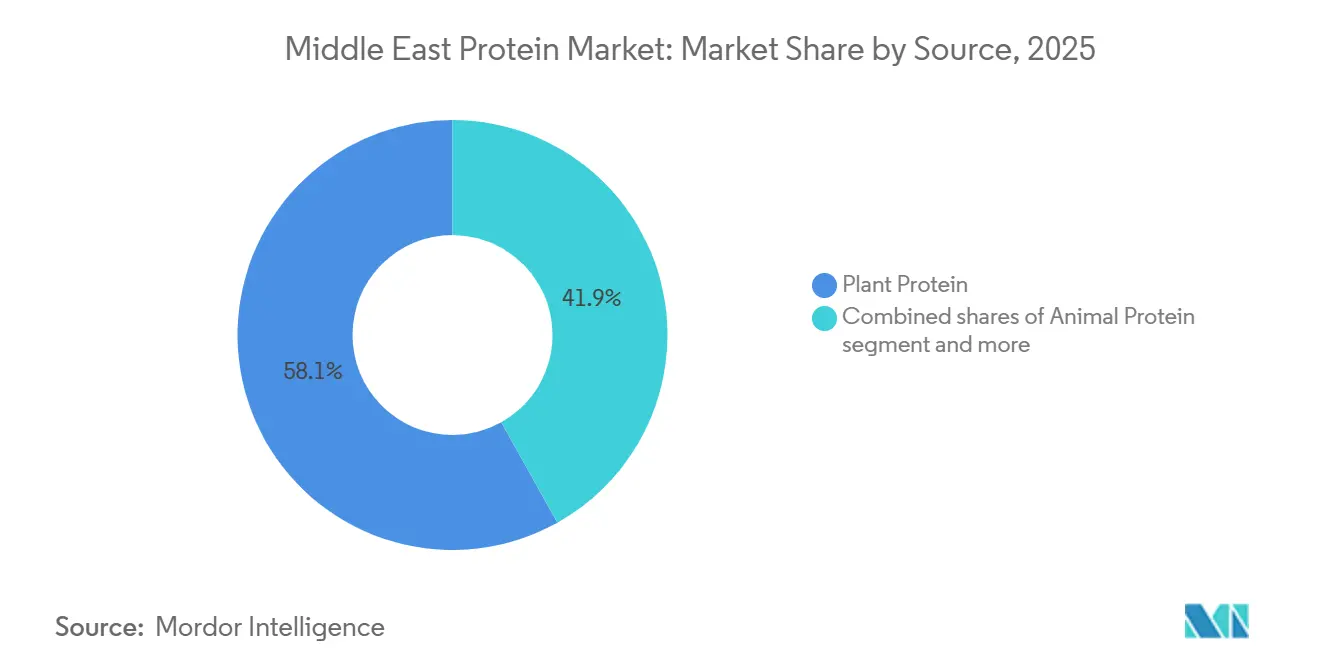
- By source, plant proteins captured 58.11% of 2025 revenue, whereas animal proteins are forecast to post the fastest 7.28% CAGR through 2031 as consumers balance cost and amino-acid completeness.
- By form, isolates commanded 41.03% share in 2025, yet hydrolysates are expected to register the quickest 7.66% CAGR to 2031 on the back of infant formula and clinical-nutrition demand.
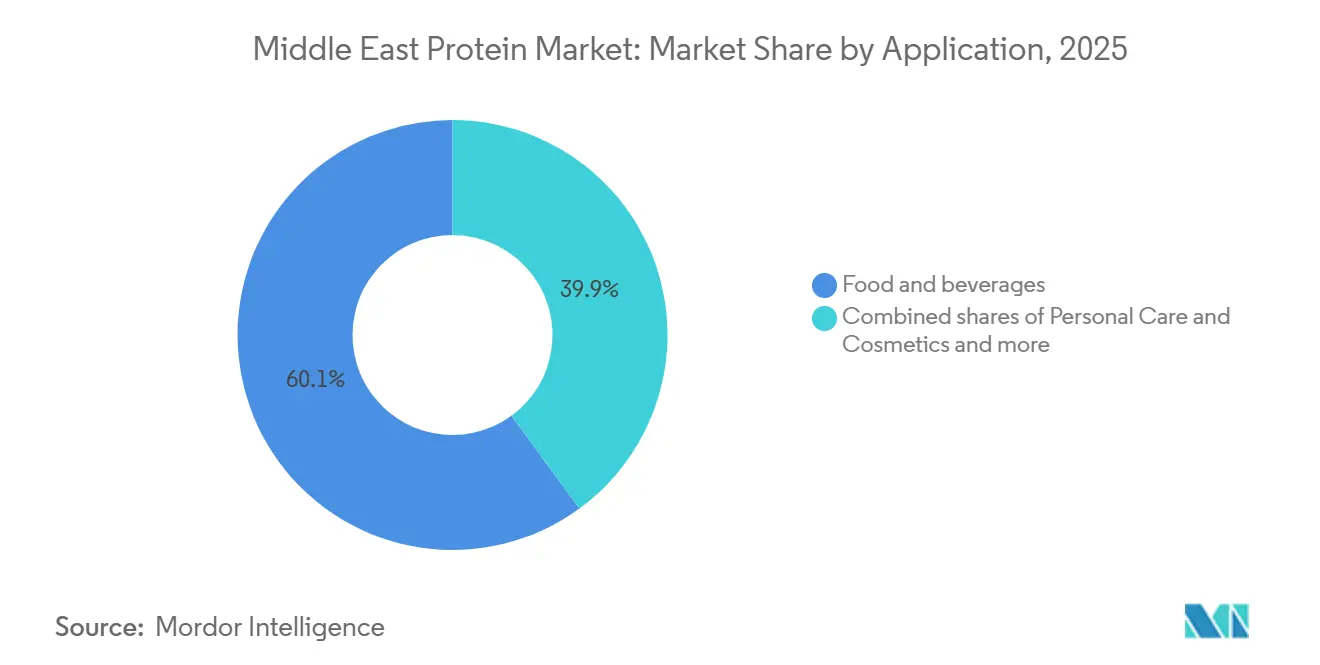
- By application, food and beverages absorbed 60.03% of 2025, while personal care and cosmetics are projected to expand at an 8.45% CAGR through 2031 on rising halal-certified collagen uptake.
- By geography, Saudi Arabia held 38.03% of regional consumption in 2025; the UAE is set to grow the fastest at a 7.61% CAGR thanks to free-zone clusters that draw multinational suppliers.
Note: Market size and forecast figures in this report are generated using Mordor Intelligence’s proprietary estimation framework, updated with the latest available data and insights as of January 2026.
Middle East Protein Market Trends and Insights
Drivers Impact Analysis*
| Driver | (~) % Impact on CAGR Forecast | Geographic Relevance | Impact Timeline |
|---|---|---|---|
| Consumers embrace health consciousness | +1.2% | Saudi Arabia, UAE (United Arab Emirates), with spillover to Qatar and Bahrain | Medium term (2-4 years) |
| Surge in popularity of fitness and sports nutrition | +1.0% | UAE core, expanding to Saudi Arabia's urban centers | Short term (≤ 2 years) |
| Food and beverage industry expands its horizons | +1.3% | GCC-wide, strongest in Saudi Arabia and the UAE | Long term (≥ 4 years) |
| Advancements in protein extraction technologies | +0.8% | Global, with adoption concentrated in the UAE free zones | Medium term (2-4 years) |
| Rising demand for clean-label, natural protein ingredients | +1.1% | Saudi Arabia, UAE, Kuwait | Medium term (2-4 years) |
| Protein-rich foods see boost in retail presence | +0.9% | Saudi Arabia, UAE, Oman | Short term (≤ 2 years) |
| Source: Mordor Intelligence | |||
Consumers Embrace Health Consciousness
Chronic disease prevalence is reshaping protein consumption patterns across the Middle East, with diabetes affecting 18.7% of Saudi adults and 15.4% of UAE residents as of 2024, according to the International Diabetes Federation. This health crisis is driving demand for low-glycemic, high-protein meal replacements that stabilize blood sugar, creating a niche for pea protein isolates and whey hydrolysates in clinical nutrition channels. Ramadan fasting traditions amplify this trend, as consumers seek protein-dense suhoor and iftar products that sustain energy across daylight hours. The convergence of religious dietary patterns with modern nutrition science is unlocking demand for halal-certified protein bars and ready-to-drink shakes that combine convenience with faith-aligned sourcing.
Surge in Popularity of Fitness and Sports Nutrition
Gym memberships in the UAE climbed 23% year-on-year in 2024, reaching 1.2 million active subscriptions, while Saudi Arabia's sports participation rate rose to 34% under Vision 2030 fitness initiatives[3]Source: UAE Ministry of Youth, "Gym Memberships", moy.gov.ae. This fitness boom is translating into sports nutrition sales, with whey protein isolates and branched-chain amino acid blends capturing shelf space in hypermarkets and specialty retailers. Younger consumers aged 18-34, who represent a significant share of the GCC population, are driving trial of pre-workout formulas and post-exercise recovery drinks that feature hydrolyzed protein for faster absorption. Government-sponsored marathons and CrossFit competitions in Riyadh and Dubai are normalizing supplement use beyond bodybuilding subcultures, expanding the addressable market for protein powders into mainstream wellness routines. The region's low per-capita protein supplement penetration signals substantial headroom for category expansion as retail distribution matures.
Food and Beverage Industry Expands Its Horizons
The GCC food and beverage sector attracted USD 4.2 billion in foreign direct investment during 2024, with protein fortification emerging as a key innovation vector across bakery, dairy, and beverage categories, according to the UNCTAD World Investment Report 2024. Dairy processors are reformulating traditional laban and yogurt with added whey protein to appeal to fitness-conscious consumers, while beverage manufacturers are launching protein-enriched date shakes that blend regional flavors with functional nutrition. Cargill's 2024 expansion of its Dubai cocoa processing facility included a dedicated protein blending line for Middle East customers, reflecting multinational confidence in regional F&B growth. The shift from commodity ingredients to value-added protein solutions is compressing margins for basic suppliers while rewarding formulators who can deliver taste-neutral, heat-stable proteins for challenging applications like Arabic coffee creamers.
Advancements in Protein Extraction Technologies
Membrane filtration and enzymatic hydrolysis innovations are enabling higher protein yields from plant and dairy feedstocks, reducing raw material costs and improving sustainability metrics. Cross-flow microfiltration systems, which separate whey proteins without heat denaturation, are being adopted by regional dairy processors to produce native whey isolates with superior foaming properties for sports beverages. DSM-Firmenich's 2025 launch of its precision fermentation platform for animal-free casein proteins signals a technology shift that could disrupt traditional dairy supply chains, though regulatory approval timelines in GCC markets remain uncertain. These extraction advances are particularly relevant for the Middle East, where water scarcity makes dry fractionation methods that eliminate liquid waste streams strategically attractive for local production.
Restraints Impact Analysis*
| Restraint | (~) % Impact on CAGR Forecast | Geographic Relevance | Impact Timeline |
|---|---|---|---|
| Regulatory hurdles in product registration and labelling | -0.6% | GCC-wide, most acute in Saudi Arabia and the UAE | Medium term (2-4 years) |
| Taste and texture concerns in protein products | -0.5% | Saudi Arabia, UAE, Kuwait | Short term (≤ 2 years) |
| Weak regulatory standardization across markets | -0.4% | GCC-wide, with spillover to the broader Middle East | Long term (≥ 4 years) |
| Limited cold storage and transport infrastructure | -0.7% | Rest of Middle East, secondary cities in Saudi Arabia and UAE | Long term (≥ 4 years) |
| Source: Mordor Intelligence | |||
Regulatory Hurdles in Product Registration and Labelling
Divergent regulatory frameworks across GCC states create duplicative compliance burdens that delay product launches and inflate market-entry costs. Saudi Arabia's SFDA requires separate dossiers for each protein ingredient, including toxicology studies and stability data, while the UAE's ESMA accepts EU Novel Food approvals for certain plant proteins, creating a regulatory arbitrage that favors suppliers with European registrations. Halal certification adds another layer of complexity, as different GCC countries recognize different certifying bodies, with Saudi Arabia's SASO accepting only 12 international halal authorities while the UAE recognizes 47. These fragmented requirements disproportionately burden smaller ingredient suppliers who lack the regulatory affairs teams to navigate multi-country submissions, effectively consolidating market share among multinational corporations with dedicated GCC compliance staff.
Taste and Texture Concerns in Protein Products
Plant-based proteins continue to face consumer resistance due to off-flavors and gritty mouthfeel, with a significant portion of Middle East consumers citing taste as the primary barrier to plant protein adoption. Pea protein's earthy notes and soy protein's beany aftertaste clash with regional flavor preferences for mild, creamy dairy profiles, limiting their use in traditional applications like labneh and Arabic coffee creamers. Formulators are deploying masking agents and flavor encapsulation to mitigate these sensory defects, but these solutions add a few percent to ingredient costs, eroding the price advantage that plant proteins hold over dairy alternatives. Texture challenges are particularly acute in meat analogs, where Middle Eastern consumers expect the fibrous bite of lamb kebabs and chicken shawarma, a mouthfeel that current extrusion technologies struggle to replicate with plant proteins.
*Our forecasts treat driver/restraint impacts as directional, not additive. The impact forecasts reflect baseline growth, mix effects, and variable interactions.
Segment Analysis
By Source: Plant Proteins Dominate Despite Animal Segment Velocity
Plant proteins held 58.11% of the Middle East protein market in 2025, driven by cost advantages and flexitarian dietary trends. Soy protein remains the workhorse of plant-based fortification, anchored by established supply chains and neutral flavor profiles that suit bakery and beverage applications, though consumer concerns about GMO soybeans are shifting formulators toward non-GMO pea and rice proteins. Pea protein isolates are gaining traction in sports nutrition, with their branched-chain amino acid content rivaling whey protein, while potato protein is emerging in clean-label applications where allergen-free claims command premium pricing. Hemp protein, though niche, is attracting interest from luxury food brands targeting wellness-conscious consumers in Dubai and Riyadh, with its omega-3 content providing a differentiation angle beyond basic protein fortification.
Animal proteins are forecast to grow at 7.28% CAGR through 2031, outpacing the plant segment's expansion. Animal proteins are accelerating due to superior amino acid profiles and consumer familiarity, with whey protein isolates capturing share in premium sports nutrition and infant formula segments. Collagen peptides are witnessing explosive growth in personal care applications, where halal-certified bovine collagen from New Zealand and Australia is being incorporated into anti-aging serums and hair-care products marketed to affluent GCC consumers. Casein and caseinates are finding renewed demand in clinical nutrition, where their slow-release properties support muscle preservation during overnight fasting, a benefit particularly relevant during Ramadan. Egg protein, historically overshadowed by dairy proteins, is experiencing a renaissance in bakery applications where its emulsification properties improve texture in high-protein breads and cakes.


By Form: Isolates Lead While Hydrolysates Surge in Clinical Applications
Hydrolysates are projected to expand at 7.66% CAGR through 2031, the fastest among protein forms, as formulators prioritize rapid absorption for sports recovery and infant nutrition, yet isolates maintained 41.03% market share in 2025 due to their versatility across food, beverage, and supplement applications. Infant formula manufacturers are incorporating hydrolyzed proteins to reduce allergenic potential, with partially hydrolyzed whey proteins showing lower immunoreactivity than intact proteins in clinical trials. The challenge for hydrolysates is bitterness, as enzymatic cleavage exposes hydrophobic amino acids that create unpleasant taste profiles, requiring masking agents that add formulation complexity.
Isolates dominate due to their high protein concentration, typically 85-90% by weight, which minimizes dosage requirements and simplifies formulation in space-constrained applications like protein bars and ready-to-drink shakes. Pea protein isolates are displacing soy in plant-based meat analogs, where their neutral flavor and superior water-holding capacity improve juiciness and texture. Whey protein isolates remain the gold standard in sports nutrition, with their complete amino acid profile and rapid digestion kinetics supporting muscle protein synthesis more effectively than plant alternatives. Concentrates, which contain 70-80% protein along with residual fats and carbohydrates, are favored in cost-sensitive applications like animal feed and bakery fortification, where the additional macronutrients contribute to palatability and do not interfere with product functionality.
By Application: Food Dominates While Personal Care Accelerates
Personal care and cosmetics applications are surging at 8.45% CAGR through 2031, the fastest-growing segment, as beauty brands incorporate collagen peptides and keratin hydrolysates into anti-aging formulations, yet food and beverages absorbed 60.03% of regional protein value in 2025, anchored by fortification mandates and sports nutrition demand. Dairy and dairy alternative products are the largest food subsegment, with traditional laban and yogurt being reformulated with added whey protein to meet "high protein" claims, while plant-based milk brands are fortifying almond and oat beverages with pea protein isolates to match the 8 grams per serving found in cow's milk.
Beverages are witnessing innovation in ready-to-drink protein shakes that blend traditional flavors like dates and saffron with whey isolates, targeting consumers who seek functional nutrition without abandoning cultural taste preferences. Bakery applications are expanding as bread fortification mandates in Saudi Arabia drive the adoption of wheat protein isolates and vital wheat gluten that boost protein content without compromising crumb structure. Infant nutrition remains a premium segment, with specialized formulas incorporating hydrolyzed proteins and amino acid blends that support digestive health in newborns, though regulatory scrutiny from SFDA and GSO creates lengthy approval timelines that favor established multinational brands. Dietary supplements and sports nutrition products are proliferating in modern trade channels, with whey protein powders and branched-chain amino acid capsules capturing shelf space in hypermarkets and specialty retailers.
Geography Analysis
Saudi Arabia commanded 38.03% of the Middle East protein market in 2025. The Kingdom's bread fortification mandates, which require 30 grams of protein per 100 grams in subsidized loaves, are driving bulk purchases of wheat protein isolates and soy concentrates by government-contracted mills. The Kingdom's large youth population is fueling the trial of protein supplements and functional beverages, though taste preferences for sweet, creamy profiles require formulation adjustments that differ from Western markets.
The UAE is expanding at 7.61% CAGR through 2031, the fastest among Middle East geographies, propelled by Dubai's status as a regional distribution hub and Abu Dhabi's investments in food manufacturing clusters. Free-zone facilities in Jebel Ali and Khalifa Industrial Zone are attracting multinational ingredient suppliers who leverage tariff exemptions and streamlined customs to serve GCC markets, with Cargill and ADM both operating blending and repackaging facilities in Dubai as of 2024. The Emirates Authority for Standardization and Metrology (ESMA) introduced streamlined approval pathways in 2024 for protein ingredients with existing EU Novel Food registrations, reducing time-to-market from 18 months to 6 months and encouraging innovation.
The rest of the Middle East markets, including Qatar, Oman, Bahrain, and Kuwait, are witnessing early adoption of microbial proteins and niche plant proteins, though infrastructure constraints limit distribution beyond capital cities. Bahrain and Kuwait are net importers of protein ingredients, with limited local manufacturing beyond small-scale dairy processing, though their proximity to Saudi Arabia and the UAE provides access to regional supply chains. Cold-chain infrastructure in secondary cities across the rest of the Middle East markets remains underdeveloped, with temperature-controlled storage capacity in Saudi Arabia and the UAE, creating distribution bottlenecks that favor shelf-stable protein formats like concentrates and isolates over refrigerated hydrolysates

Competitive Landscape
The Middle East protein market registers moderate fragmentation, as global majors like Cargill, Incorporated, and Kerry Group PLC compete alongside regional dairy processors such as Almarai and Baladna that leverage vertical integration and halal certification to defend local share. Multinational suppliers are pursuing partnership strategies with GCC distributors to navigate regulatory complexity, with DSM-Firmenich establishing a Dubai application center in 2024 that provides formulation support for Middle Eastern food manufacturers seeking to incorporate specialty proteins into traditional products.
Local players are exploiting cultural and linguistic advantages, with Arabic-language technical support and halal-certified supply chains creating switching costs that insulate them from multinational competition in price-sensitive segments like bakery fortification and animal feed. White-space opportunities are emerging in microbial proteins and insect proteins, where regulatory approval pathways remain undefined in most GCC markets, creating first-mover advantages for companies willing to invest in dossier preparation and government engagement.
Technology adoption is accelerating as suppliers deploy membrane filtration and enzymatic hydrolysis to produce higher-purity isolates with improved functional properties, though capital intensity favors larger players with balance sheets to fund equipment upgrades. Smaller specialty suppliers are carving niches in organic and non-GMO segments, where premium pricing offsets lower volumes and justifies the compliance costs associated with multiple certifications. A 2024 patent filing by Kerry Group for a heat-stable pea protein isolate designed for Arabic coffee creamers illustrates how incumbents are tailoring innovation to regional taste preferences, a strategic pivot that could entrench market positions if regulatory approvals materialize.
Middle East Protein Industry Leaders
-
Cargill, Incorporated
-
Kerry Group PLC
-
DSM-Firmenich
-
BASF SE
-
Archer Daniels Midland Company (ADM)
- *Disclaimer: Major Players sorted in no particular order

Recent Industry Developments
- August 2024: Global dairy co-operative Fonterra and natural ingredient manufacturer Superbrewed Food have teamed up to boost sustainable food production. The partnership combines Superbrewed’s biomass protein platform with Fonterra’s dairy processing, ingredients, and application expertise to develop additional nutrient-rich, functional biomass protein.
- February 2024: Cargill has signed a commercial agreement that enables it to use and market ENOUGH's proprietary ABUNDA Protein and is also investing in the firm's series C Funding.


Middle East Protein Market Report Scope
The protein market refers to the regional industry that produces, distributes, and sells protein-rich products for human and animal consumption. It includes animal-based proteins (such as meat, dairy, eggs, and fish) and plant-based proteins (such as soy, pea, rice, and wheat), as well as protein isolates, concentrates, and supplements used in food, beverages, and nutritional products. The Middle East Protein Market is Segmented by Source (Animal, Microbial, Plant), Form (Concentrates, Isolates, and Hydrolysates), End User (Animal Feed, Food and Beverages, Personal Care and Cosmetics, and More), and Geography (Saudi Arabia, United Arab Emirates, and More). The Market Forecasts are Provided in Terms of Value (USD) and Volume (Tons).
Source
| Animal | Casein and Caseinates |
| Collagen | |
| Egg Protein | |
| Gelatin | |
| Insect Protein | |
| Milk Protein | |
| Whey Protein | |
| Other Animal Proteins | |
| Microbial | Algae Protein |
| Mycoprotein | |
| Plant | Hemp Protein |
| Pea Protein | |
| Potato Protein | |
| Rice Protein | |
| Soy Protein | |
| Wheat Protein | |
| Other Plant Proteins |
Form
| Concentrates |
| Isolates |
| Hydrolysates |
Application
| Food and Beverages | Bakery |
| Beverages | |
| Breakfast Cereals | |
| Condiments/Sauces | |
| Confectionery | |
| Dairy and Dairy Alternative Products | |
| Meat/Poultry/Seafood and Meat Alternative Products | |
| RTE/RTC Food Products | |
| Snacks | |
| Infant Nutrition | |
| Other Food and Beverage Applications | |
| Personal Care and Cosmetics | |
| Animal Feed | |
| Dietary Supplements and Sports Nutrition |
Geography
| Saudi Arabia |
| United Arab Emirates |
| Rest of Middle East |
| Source | Animal | Casein and Caseinates |
| Collagen | ||
| Egg Protein | ||
| Gelatin | ||
| Insect Protein | ||
| Milk Protein | ||
| Whey Protein | ||
| Other Animal Proteins | ||
| Microbial | Algae Protein | |
| Mycoprotein | ||
| Plant | Hemp Protein | |
| Pea Protein | ||
| Potato Protein | ||
| Rice Protein | ||
| Soy Protein | ||
| Wheat Protein | ||
| Other Plant Proteins | ||
| Form | Concentrates | |
| Isolates | ||
| Hydrolysates | ||
| Application | Food and Beverages | Bakery |
| Beverages | ||
| Breakfast Cereals | ||
| Condiments/Sauces | ||
| Confectionery | ||
| Dairy and Dairy Alternative Products | ||
| Meat/Poultry/Seafood and Meat Alternative Products | ||
| RTE/RTC Food Products | ||
| Snacks | ||
| Infant Nutrition | ||
| Other Food and Beverage Applications | ||
| Personal Care and Cosmetics | ||
| Animal Feed | ||
| Dietary Supplements and Sports Nutrition | ||
| Geography | Saudi Arabia | |
| United Arab Emirates | ||
| Rest of Middle East | ||


Market Definition
- End User - The Protein Ingredients Market operates on a B2B basis. Food, Beverages, Supplements, Animal Feed, and Personal Care & Cosmetic manufacturers are considered to be end-consumers in the market studied. The scope excludes manufacturers buying liquid/dry whey to be used for application as a binding agent or thickener or other non-protein applications.
- Penetration Rate - Penetration Rate is defined as the percentage of Protein-Fortified End User Market Volume in the Overall End User Market Volume.
- Average Protein Content - Average protein content is the average protein content present per 100 g of product manufactured by all end-user companies considered under the scope of this report.
- End User Market Volume - End-user market volume is the consolidated volume of all types and forms of end-user products in the country or region.
| Keyword | Definition |
|---|---|
| Alpha-lactalbumin (α-Lactalbumin) | It is a protein that regulates the production of lactose in the milk of almost all mammalian species. |
| Amino acid | It is an organic compound that contains both amino and carboxylic acid functional groups, which are required for the synthesis of body protein and other important nitrogen-containing compounds, such as creatine, peptide hormones, and some neurotransmitters. |
| Blanching | It is the process of briefly heating vegetables with steam or boiling water. |
| BRC | British Retail Consortium |
| Bread improver | It is a flour-based blend of several components with specific functional properties designed to modify dough characteristics and give quality attributes to bread. |
| BSF | Black Soldier Fly |
| Caseinate | It is a substance produced by adding an alkali to acid casein, a derivative of casein. |
| Celiac disease | Celiac disease is an immune reaction to eating gluten, a protein found in wheat, barley, and rye. |
| Colostrum | It is a milky fluid that’s released by mammals that have recently given birth before breast milk production begins. |
| Concentrate | It is the least processed form of protein and has a protein content ranging from 40-90% by weight. |
| Dry protein basis | It refers to the percentage of "pure protein" present in a supplement after the water in it is completely removed through heat. |
| Dry whey | It is the product resulting from drying fresh whey which has been pasteurized and to which nothing has been added as a preservative. |
| Egg protein | It is a mixture of individual proteins, including ovalbumin, ovomucoid, ovoglobulin, conalbumin, vitellin, and vitellenin. |
| Emulsifier | It is a food additive that facilitates the blending of foods that are immiscible with one another, such as oil and water. |
| Enrichment | It is the process of addition of micronutrients that are lost during the processing of the product. |
| ERS | Economic Research Service of the USDA |
| Extrusion | It is the process of forcing soft mixed ingredients through an opening in a perforated plate or die designed to produce the required shape. The extruded food is then cut to a specific size by blades. |
| Fava | Also known as Faba, it is another word for yellow split beans. |
| FDA | Food and Drug Administration |
| Flaking | It is a process in which typically a cereal grain (like corn, wheat, or rice) is broken down into grits, cooked with flavors and syrups, and then pressed into flakes between cooled rollers. |
| Foaming agent | It is a food ingredient that makes it possible to form or maintain a uniform dispersion of a gaseous phase in a liquid or solid food. |
| Foodservice | It refers to the part of the food industry which includes businesses, institutions, and companies which prepare meals outside the home. It includes restaurants, school and hospital cafeterias, catering operations, and many other formats. |
| Fortification | It is the deliberate addition of micronutrients that are not found in them naturally or which are lost during processing, to improve a food product's nutritional value. |
| FSANZ | Food Standards Australia New Zealand |
| FSIS | Food Safety and Inspection Service |
| FSSAI | Food Safety and Standards Authority of India |
| Gelling agent | It is an ingredient that functions as a stabilizer and thickener to provide thickening without stiffness through the formation of gel. |
| GHG | Greenhouse Gas |
| Gluten | It is a family of proteins found in grains, including wheat, rye, spelt, and barley. |
| Hemp | It is a botanical class of Cannabis sativa cultivars grown specifically for industrial or medicinal use. |
| Hydrolysate | It is a form of protein manufactured by exposing the protein to enzymes that can partially break the bonds between the protein's amino acids and break down large, complicated proteins into smaller pieces. Its processing makes it easier and quicker to digest. |
| Hypoallergenic | It refers to a substance that causes fewer allergic reactions. |
| Isolate | It is the purest and most processed form of protein which has undergone separation to obtain a pure protein fraction. It typically contains ≥ 90% of protein by weight. |
| Keratin | It is a protein that helps form hair, nails, and the outer layer of skin. |
| Lactalbumin | It is the albumin contained in milk and obtained from whey. |
| Lactoferrin | It is an iron‑binding glycoprotein that is present in the milk of most mammals. |
| Lupin | It is the yellow legume seeds of the genus Lupinus. |
| Millenial | Also known as Generation Y or Gen Y, it refers to the people born from 1981 to 1996. |
| Monogastric | It refers to an animal with a single-compartmented stomach. Examples of monogastric include humans, poultry, pigs, horses, rabbits, dogs, and cats. Most monogastric are generally unable to digest much cellulose food materials such as grasses. |
| MPC | Milk protein concentrate |
| MPI | Milk protein isolate |
| MSPI | Methylated soy protein isolate |
| Mycoprotein | Mycoprotein is a form of single-cell protein, also known as fungal protein, derived from fungi for human consumption. |
| Nutricosmetics | It is a category of products and ingredients that act as nutritional supplements to care for skin, nails, and hair natural beauty. |
| Osteoporosis | It is a medical condition in which the bones become brittle and fragile from loss of tissue, typically as a result of hormonal changes, or deficiency of calcium or vitamin D. |
| PDCAAS | Protein digestibility-corrected amino acid score (PDCAAS) is a method of evaluating the quality of a protein based on both the amino acid requirements of humans and their ability to digest it. |
| Per-capita consumption of animal protein | It is the average amount of animal protein (such as milk, whey, gelatin, collagen, and egg proteins) that is readily available for consumption by each person in an actual population. |
| Per-capita consumption of plant protein | It is the average amount of plant protein (such as soy, wheat, pea, oat, and hemp proteins) that is readily available for consumption by each person in an actual population. |
| Quorn | It is a microbial protein manufactured using mycoprotein as an ingredient, in which the fungus culture is dried and mixed with egg albumen or potato protein, which acts as a binder, and then is adjusted in texture and pressed into various forms. |
| Ready-to-Cook (RTC) | It refers to food products that include all of the ingredients, where some preparation or cooking is required through a process that is given on the package. |
| Ready-to-Eat (RTE) | It refers to a food product prepared or cooked in advance, with no further cooking or preparation required before being eaten. |
| RTD | Ready-to-Drink |
| RTS | Ready-to-Serve |
| Saturated fat | It is a type of fat in which the fatty acid chains have all single bonds. It is generally considered unhealthy. |
| Sausage | It is a meat product made of finely chopped and seasoned meat, which may be fresh, smoked, or pickled and which is then usually stuffed into a casing. |
| Seitan | It is a plant-based meat substitute made out of wheat gluten. |
| Softgel | It is a gelatin-based capsule with a liquid fill. |
| SPC | Soy protein concentrate |
| SPI | Soy protein isolate |
| Spirulina | It is a biomass of cyanobacteria that can be consumed by humans and animals. |
| Stabilizer | It is an ingredient added to food products to help maintain or enhance their original texture, and physical and chemical characteristics. |
| Supplementation | It is the consumption or provision of concentrated sources of nutrients or other substances that are intended to supplement nutrients in the diet and is intended to correct nutritional deficiencies. |
| Texturant | It is a specific type of food ingredient that is used to control and alter the mouthfeel and texture of food and beverage products. |
| Thickener | It is an ingredient that is used to increase the viscosity of a liquid or dough and make it thicker, without substantially changing its other properties. |
| Trans fat | Also called trans-unsaturated fatty acids or trans fatty acids, it is a type of unsaturated fat that naturally occurs in small amounts in meat. |
| TSP | Textured soy protein |
| TVP | Textured vegetable protein |
| WPC | Whey protein concentrate |
| WPI | Whey protein isolate |


Research Methodology
Mordor Intelligence follows a four-step methodology in all our reports.
- Step-1: Identify Key Variables: The quantifiable key variables (industry and extraneous) pertaining to the specific product segment and country are selected from a group of relevant variables & factors based on desk research & literature review; along with primary expert inputs. These variables are further confirmed through regression modeling (wherever required).
- Step-2: Build a Market Model: In order to build a robust forecasting methodology, the variables and factors identified in Step-1 are tested against available historical market numbers. Through an iterative process, the variables required for market forecast are set and the model is built on the basis of these variables.
- Step-3: Validate and Finalize: In this important step, all market numbers, variables and analyst calls are validated through an extensive network of primary research experts from the market studied. The respondents are selected across levels and functions to generate a holistic picture of the market studied.
- Step-4: Research Outputs: Syndicated Reports, Custom Consulting Assignments, Databases & Subscription Platforms


