Saudi Arabia Engineering Plastics Market Size and Share
Market Overview
| Study Period | 2020 - 2031 |
|---|---|
| Forecast Data Period | 2026 - 2031 |
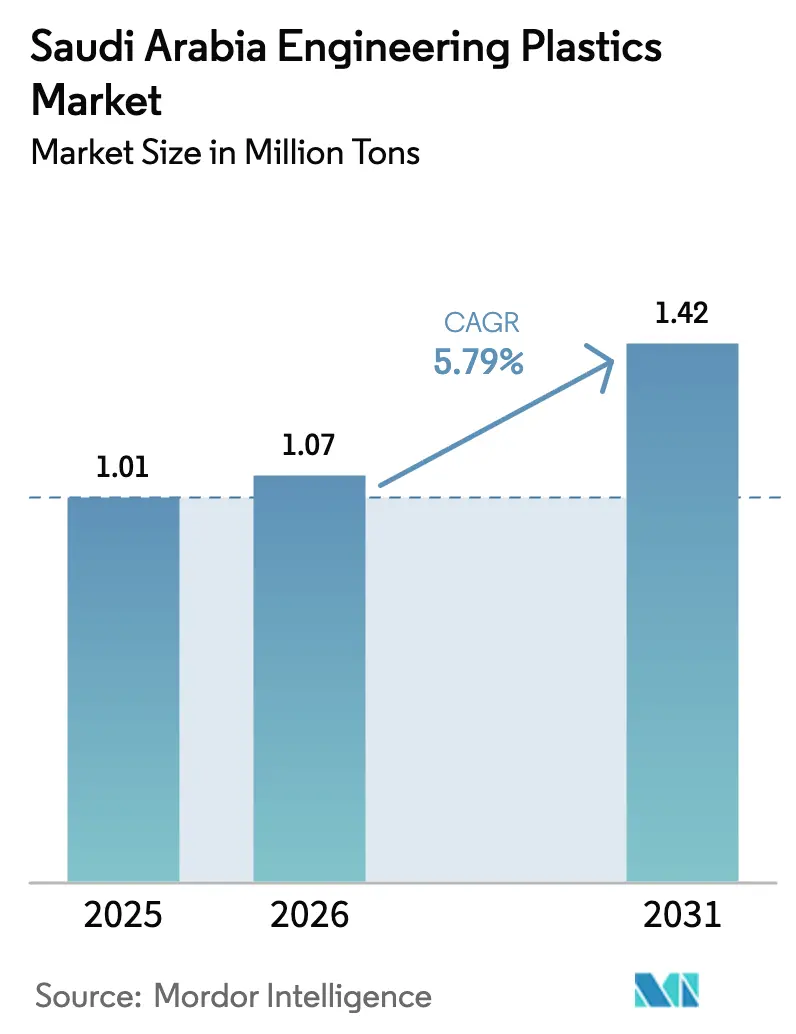
| Base Year Market Size (2025) | 1.01 Million tons |
| Market Volume (2026) | 1.07 Million tons |
| Market Volume (2031) | 1.42 Million tons |
| Growth Rate (2026 - 2031) | 5.79% CAGR |
| Market Concentration | High |
Major Players *Disclaimer: Major Players sorted in no particular order Image © Mordor Intelligence. Reuse requires attribution under CC BY 4.0. | |
Saudi Arabia Engineering Plastics Market Analysis by Mordor Intelligence
The Saudi Arabia Engineering Plastics Market size was valued at 1.01 million tons in 2025 and estimated to grow from 1.07 million tons in 2026 to reach 1.42 million tons by 2031, at a CAGR of 5.79% during the forecast period (2026-2031). This upward trajectory reflects the Kingdom’s deliberate shift from bulk petrochemicals toward higher-value polymer conversion in line with Vision 2030. Abundant hydrocarbon feedstock supplies, particularly ethane and propane, keep production costs below regional averages, strengthening the price competitiveness of domestic resins even when crude benchmarks fluctuate. Localization mandates in the automotive, consumer electronics, and food packaging industries have tightened the demand for specialty grades that commodity polymers cannot satisfy, while fast-tracked megaprojects such as NEOM and Qiddiya continue to place large spot orders for flame-retardant, impact-modified, and weather-resistant formulations. Producers are accelerating capacity investments in compounding, color masterbatch, and additive manufacturing to capture these emerging value pools and diversify away from oversupplied commodity segments. Stakeholders remain cautious, however, as feedstock price volatility and gaps in recycling infrastructure could trim margins if unaddressed.
Key Report Takeaways
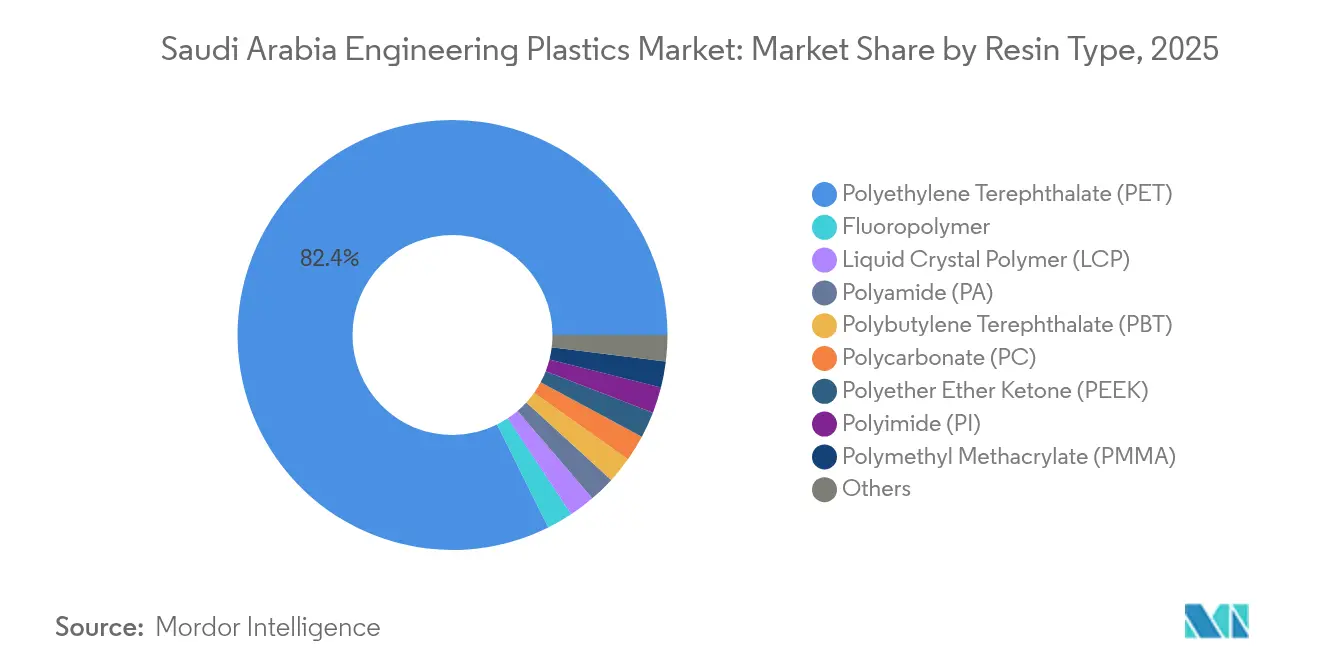
- By resin type, polyethylene terephthalate held 82.35% of the Saudi Arabia engineering plastics market share in 2025. Styrene copolymers are forecast to expand at a 7.75% CAGR through 2031.
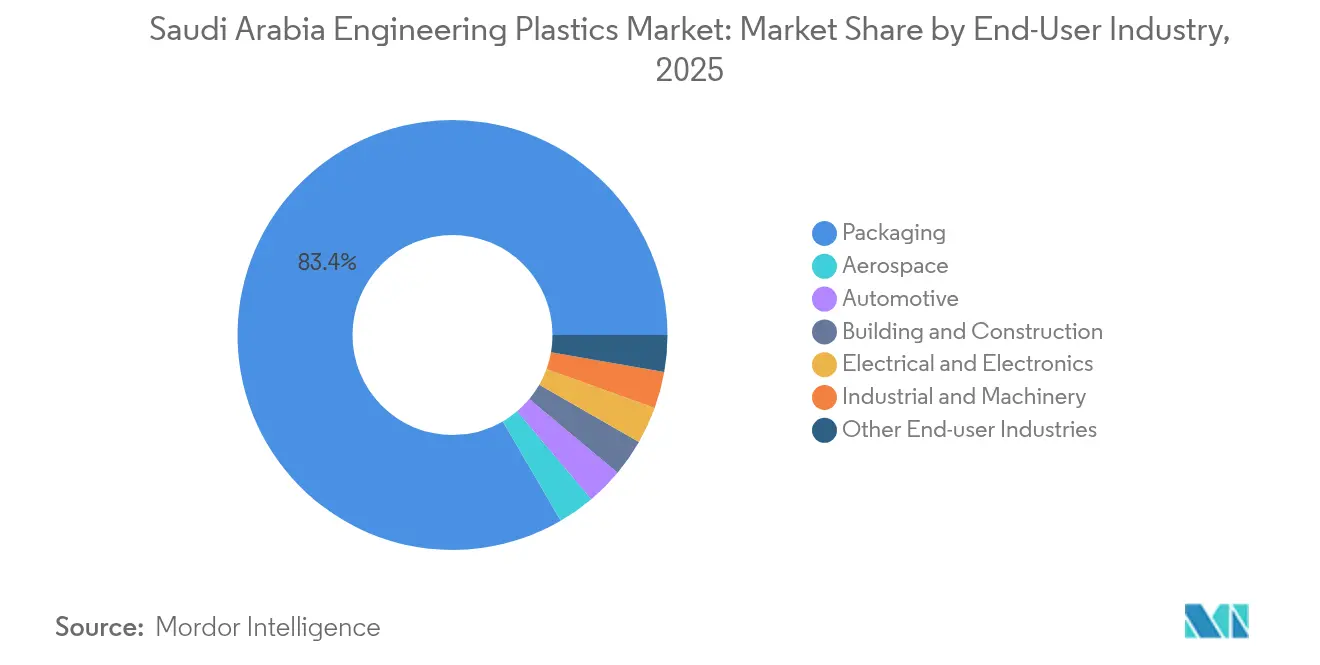
- By end-user industry, the packaging segment accounted for 83.40% of the Saudi Arabia engineering plastics market size in 2025. Electrical and electronics applications are projected to advance at an 8.45% CAGR between 2026 and 2031.
Note: Market size and forecast figures in this report are generated using Mordor Intelligence’s proprietary estimation framework, updated with the latest available data and insights as of 2026.
Saudi Arabia Engineering Plastics Market Trends and Insights
Drivers Impact Analysis*
| Drivers | (~) % Impact on CAGR Forecast | Geographic Relevance | Impact Timeline |
|---|---|---|---|
| EV and NEV component localization | +1.2% | Eastern Province, Riyadh, NEOM | Medium term (2-4 years) |
| Vision 2030 downstream incentives | +0.8% | National, Jubail, Yanbu, Ras Al-Khair | Long term (≥ 4 years) |
| Expansion of domestic packaging converters | +0.6% | Riyadh, Jeddah, Dammam | Short term (≤ 2 years) |
| Lightweight materials adoption in oil and gas equipment | +0.4% | Eastern Province | Medium term (2-4 years) |
| Smart-city megaproject demand | +0.7% | NEOM, Red Sea, Qiddiya | Long term (≥ 4 years) |
| Source: Mordor Intelligence | |||


EV and NEV Component Localization
Electric-mobility localization is reshaping the Saudi Arabia engineering plastics market by requiring battery housings, electrical connectors, and thermal-management parts that meet elevated flammability and temperature thresholds. Aramco’s venture with BYD sets a precedent for domestic sourcing commitments that obligate Tier 1 suppliers to purchase local resins. Automotive regulations mandate 50% local content by 2030, channeling demand toward polyamides, polycarbonates, and high-heat blends that comply with UNECE R-100 and UL-94 V-0 standards. The King Salman Automotive Cluster in Jeddah has already attracted compounding lines for glass-fiber-reinforced ABS and PC-PBT alloys tailored for EV battery enclosure rigidity. The localization drive also enhances supply-chain resilience by reducing customs lead times for critical parts, allowing OEMs to ramp up production with shorter takt times.
Vision 2030 Downstream Conversion Incentives
Standard Incentives Program allocations totaling SAR 10 billion (USD 2.67 billion) subsidize land, utilities, and financing for converters that consume domestically produced intermediates[1]Government of Saudi Arabia, “Standard Incentives Program Details,” gov.sa. In parallel, SABIC’s Nusaned initiative has generated SAR 8.8 billion (USD 2.35 billion) in GDP contributions by co-investing in SME compounders, showcasing how public-private coordination is steering capital toward specialty conversion assets. Local Content and Government Procurement Authority rules award up to 30% bid preference for goods with certified Saudi origin, effectively guaranteeing offtake for engineering plastics used in defense, health-care, and water-management contracts. Regulatory backing is reinforced by rigorous SASO performance standards that create technical entry barriers against low-quality imports, preserving domestic value capture. Foreign majors such as Alujain-Motherson and LyondellBasell have entered joint ventures, encouraged by fiscal credits and priority feedstock agreements that shorten payback periods.
Rapid Expansion of Domestic Packaging Converters
Saudi Arabia’s fast-growing consumer-goods market has triggered capacity booms among PET preform makers and multilayer film extruders. Hotpack’s SAR 1 billion PET bottle complex in Riyadh alone lifts domestic bottle-grade resin off-take by an estimated 120,000 tons per year. Converters are also pivoting toward rPET and PCR content, spurred by retailer pledges to raise recycled content in beverage containers to 25% by 2028. SABIC-Napco collaborations supply mono-material barrier films that improve recyclability, further entrenched by municipal directives that restrict multilayer structures with incompatible polymers. Growth in e-commerce adds momentum, as last-mile delivery relies on tough, lightweight mailers made from high-impact copolyesters. PlasChem Park in Jubail has attracted several mid-scale PET sheet lines, suggesting the packaging boom will continue to anchor baseline demand lines for bottle-grade and amorphous PET chips.
Transition to Lightweight Materials in Oil-and-Gas Equipment
Saudi Aramco’s cost-per-barrel reduction program targets up to 25% weight savings in drilling tools, spurring substitution of stainless steel with high-modulus PEEK and carbon-fiber-filled PA-12. Precision Polymer Engineering localized elastomer manufacturing in Al Khobar, enabling rapid supply of high-temperature seals that endure sour-gas exposure. Polyether ether ketone bushings have halved maintenance downtime on subsea pumps, illustrating tangible OPEX benefits. Engineering plastics also lower CO₂ emissions by decreasing transport weight for modular skid units shipped to offshore rigs. Supplier development initiatives funnel these benefits back into local SMEs that machine tight-tolerance parts, simultaneously cultivating downstream job creation.
Restraints Impact Analysis*
| Restraints | (~) % Impact on CAGR Forecast | Geographic Relevance | Impact Timeline |
|---|---|---|---|
| Feedstock price volatility | -1.8% | Jubail, Yanbu | Short term (≤ 2 years) |
| Inadequate mechanical-recycling capacity | -0.9% | Secondary cities | Medium term (2-4 years) |
| Skill-set gaps in precision processing | -0.6% | Emerging industrial hubs | Long term (≥ 4 years) |
| Source: Mordor Intelligence | |||
Feedstock Price Volatility Linked to Crude Swings
Engineering-grade resin margins are tethered to naphtha and ethane price indexes, which spike when OPEC+ production cuts tighten global supply. Each 1% rise in non-renewable energy costs lowers Saudi manufacturing output by 0.602% according to 2025 sustainability studies[2]MDPI Sustainability, “Energy Dynamics and Manufacturing Output,” mdpi.com. Domestic producers cannot always pass price hikes downstream because local packaging and appliance converters sign quarterly price caps. Volatile Brent benchmarks inject forecasting uncertainty into procurement cycles, forcing processors to hedge inventory, thereby inflating working-capital requirements. If crude averages above USD 90 per barrel for extended periods, resin makers risk negative spreads, especially in thin-margin PET bottle chips. Long-term offtake agreements indexed to gas rather than crude could mitigate the threat, yet few such contracts exist today.
Limited Local Mechanical-Recycling Infrastructure
Circular-economy ambitions hinge on dependable recycled feedstock streams, but the Kingdom lacks advanced sorting and washing plants for engineering polymers. The Saudi Green Initiative sets directional goals, yet it omits specific tonnage targets for engineering plastics recovery. Consequently, food-grade rPET pellet imports remain necessary, raising feedstock costs for domestic converters chasing export customers that demand 30% recycled content. Inadequate segregation at source leads to visual contamination and color variability, impeding high-value repurposing. Capital outlays for FDA-compliant recycling lines exceed SAR 150 million per 30,000-ton module, discouraging private players without guaranteed bale supply. Unless policy introduces extended producer responsibility fees that finance collection, virgin resin dependence will persist.
*Our forecasts treat driver/restraint impacts as directional, not additive. The impact forecasts reflect baseline growth, mix effects, and variable interactions.
Segment Analysis
By Resin Type: PET Dominance Masks Specialty Growth
Polyethylene terephthalate commanded 82.35% Saudi Arabia engineering plastics market share in 2025, anchored by soft-drink and bottled-water demand that requires high-clarity bottle chips. Despite PET’s volume weight, styrene copolymers register the fastest 7.75% CAGR through 2031 as automakers increase interior trim localization. Polyamides, polycarbonate, and fluoropolymers, although niche, capture profitable slivers in electric-drivetrain, LED optics, and chemical-processing equipment respectively. PET’s overwhelming scale obscures the rising revenue share of high-margin specialty resins that can sell at unit prices five to eight times higher than bottle chips.
Investment priorities illustrate this shift. SABIC has financed twin-screw extruders capable of compounding flame-retardant PC-ABS blends for e-mobility and 5G enclosures. LyondellBasell’s stake in NATPET introduces global polypropylene-compound recipes into the domestic mix, while Arch-Daelim Petrochemical’s upcoming plant in Jubail will supply copolyester grades for meat-tray sealing films. These expansions signify a deliberate pivot toward resin value differentiation. Yet PET will remain the base-load consumer because beverage brands lock in multi-year contracts that guarantee steady offtake, ensuring converter utilization rates stay north of 85% even during business-cycle lulls.


By End-User Industry: Electronics Surge Challenges Packaging Dominance
Packaging absorbed 83.40% of the Saudi Arabia engineering plastics market size in 2025, primarily for bottle, film, and thermoform applications. Nevertheless, electrical and electronics applications are projected to log the most rapid 8.45% CAGR through 2031, driven by NEOM’s smart-city deployment plans and domestic assembly incentives for televisions, smartphones, and high-efficiency lighting. Printed-circuit substrates, LED lens covers, and 5G antenna housings rely on low-dielectric, heat-resistant polymers such as liquid-crystal polymers and PC blends, drawing interest from specialty compounders.
Automotive components remain a significant consumer as the Kingdom aims for an annual vehicle output of 300,000 by 2030, with EV platforms accelerating resin substitution over stamped steel. Building and construction follows, with polycarbonate glazing and weatherable PMMA sheets replacing glass and aluminum in energy-efficient façades. Machine-tool and oil-and-gas end markets adopt engineering plastics more selectively, but they pay premium margins for PEEK and PPS used in high-pressure sealing. Across all sectors, localization policies tilt procurement toward Saudi suppliers, creating demand corridors that reshuffle the historical dominance of beverage packaging and grant electronics a stronger voice in product-development roadmaps.
Geography Analysis
Eastern Province remains the core production node for the Saudi Arabia engineering plastics market. Jubail Industrial City features vertically integrated complexes where ethane cracking, monomer synthesis, and polymerization are located within contiguous plots, thereby reducing freight and storage costs. SABIC, Petro Rabigh, and several JV partners run mega-scale reactors that feed pellets to captive compounders, ensuring a stable supply even under tight global shipping capacity. Yanbu’s refinery-linked assets also add redundancy, positioning the province as the country’s resin export gateway through King Fahd Industrial Port.
Riyadh functions as the principal conversion hub, housing SABIC’s Plastic Applications Development Center and a critical mass of blow-molders, injection-molders, and film extruders. The region’s consumer-goods base generates continuous demand for caps, closures, and rigid packaging. Presence of automotive assembly lines elevates the need for glass-filled nylon intake manifolds and PC-ABS dash components, which compounding plants in Sudair Industrial City increasingly supply. Logistics networks connect Riyadh to both Eastern and Western provinces, allowing balanced distribution of finished granulate.
The Western corridor, led by Jeddah and extending north to NEOM, is emerging as a consumption hotspot. King Salman Automotive Cluster attracts Tier 1 component makers that source local polyamides for under-hood parts. Meanwhile the Red Sea Project and high-rise urban redevelopment in Jeddah rely on polycarbonate roofing sheets and acrylic noise barriers, using palletized resin shipped through Jeddah Islamic Port. NEOM’s nascent industrial zones are drafting procurement frameworks that stipulate minimum Saudi content, ensuring sustained western demand inflows once construction peaks. Collectively, these geographic dynamics depict a two-pole system: production-heavy east, conversion- and application-heavy center and west.
Competitive Landscape
The Saudi Arabian engineering plastics market is characterized by concentrated competition, with SABIC controlling both upstream feedstocks and downstream compounding assets that span most major resin families. Local content rules and SASO standards further shield domestic incumbents against low-cost Asian imports by requiring on-site audits and documentation of traceability. International players adapt by co-locating technology centers that tweak global grades to Saudi climatic conditions, thereby shortening qualification timelines. Competitive positioning, therefore, hinges on three levers: access to advantaged feedstocks, breadth of specialty portfolios, and the ability to collaborate with state programs to meet Localization 50 targets. Over the next five years, market leadership is expected to shift toward firms that blend cost-competitive upstream integration with downstream specialty agility.
Saudi Arabia Engineering Plastics Industry Leaders
SABIC
Sipchem Company
Petro Rabigh
Alfa S.A.B. de C.V.
PCC
- *Disclaimer: Major Players sorted in no particular order

Recent Industry Developments
- July 2025: SABIC launched LNP Thermotuf WF0087N, the first flame-retardant PBT compound for nano molding technology, offering 60% stronger metal-plastic bonding and IP68 compliance.
- December 2024: SABIC introduced LNP ELCRES CXL polycarbonate copolymer resins, engineered for chemical resistance in mobility, electronics, industrial, and infrastructure applications. The portfolio includes flame-retardant, transparent, and glass-reinforced grades, featuring low-temperature ductility, UV resistance, and colorability.


Saudi Arabia Engineering Plastics Market Report Scope
Aerospace, Automotive, Building and Construction, Electrical and Electronics, Industrial and Machinery, Packaging are covered as segments by End User Industry. Fluoropolymer, Liquid Crystal Polymer (LCP), Polyamide (PA), Polybutylene Terephthalate (PBT), Polycarbonate (PC), Polyether Ether Ketone (PEEK), Polyethylene Terephthalate (PET), Polyimide (PI), Polymethyl Methacrylate (PMMA), Polyoxymethylene (POM), Styrene Copolymers (ABS and SAN) are covered as segments by Resin Type.| Fluoropolymer | Ethylenetetrafluoroethylene (ETFE) |
| Fluorinated Ethylene-propylene (FEP) | |
| Polytetrafluoroethylene (PTFE) | |
| Polyvinylfluoride (PVF) | |
| Polyvinylidene Fluoride (PVDF) | |
| Other Sub Resin Types | |
| Liquid Crystal Polymer (LCP) | |
| Polyamide (PA) | Aramid |
| Polyamide (PA) 6 | |
| Polyamide (PA) 66 | |
| Polyphthalamide | |
| Polybutylene Terephthalate (PBT) | |
| Polycarbonate (PC) | |
| Polyether Ether Ketone (PEEK) | |
| Polyethylene Terephthalate (PET) | |
| Polyimide (PI) | |
| Polymethyl Methacrylate (PMMA) | |
| Polyoxymethylene (POM) | |
| Styrene Copolymers (ABS, SAN) |
| Aerospace |
| Automotive |
| Building and Construction |
| Electrical and Electronics |
| Industrial and Machinery |
| Packaging |
| Other End-user Industries |
| By Resin Type | Fluoropolymer | Ethylenetetrafluoroethylene (ETFE) |
| Fluorinated Ethylene-propylene (FEP) | ||
| Polytetrafluoroethylene (PTFE) | ||
| Polyvinylfluoride (PVF) | ||
| Polyvinylidene Fluoride (PVDF) | ||
| Other Sub Resin Types | ||
| Liquid Crystal Polymer (LCP) | ||
| Polyamide (PA) | Aramid | |
| Polyamide (PA) 6 | ||
| Polyamide (PA) 66 | ||
| Polyphthalamide | ||
| Polybutylene Terephthalate (PBT) | ||
| Polycarbonate (PC) | ||
| Polyether Ether Ketone (PEEK) | ||
| Polyethylene Terephthalate (PET) | ||
| Polyimide (PI) | ||
| Polymethyl Methacrylate (PMMA) | ||
| Polyoxymethylene (POM) | ||
| Styrene Copolymers (ABS, SAN) | ||
| By End-User Industry | Aerospace | |
| Automotive | ||
| Building and Construction | ||
| Electrical and Electronics | ||
| Industrial and Machinery | ||
| Packaging | ||
| Other End-user Industries | ||


Market Definition
- End-user Industry - Packaging, Electrical & Electronics, Automotive, Building & Construction, and Others are the end-user industries considered under the engineering plastics market.
- Resin - Under the scope of the study, consumption of virgin resins like Fluoropolymer, Polycarbonate, Polyethylene Terephthalate, Polybutylene Terephthalate, Polyoxymethylene, Polymethyl Methacrylate, Styrene Copolymers, Liquid Crystal Polymer, Polyether Ether Ketone, Polyimide, and Polyamide in the primary forms are considered. Recycling has been provided separately under its individual chapter.
| Keyword | Definition |
|---|---|
| Acetal | This is a rigid material that has a slippery surface. It can easily withstand wear and tear in abusive work environments. This polymer is used for building applications such as gears, bearings, valve components, etc. |
| Acrylic | This synthetic resin is a derivative of acrylic acid. It forms a smooth surface and is mainly used for various indoor applications. The material can also be used for outdoor applications with a special formulation. |
| Cast film | A cast film is made by depositing a layer of plastic onto a surface then solidifying and removing the film from that surface. The plastic layer can be in molten form, in a solution, or in dispersion. |
| Colorants & Pigments | Colorants & Pigments are additives used to change the color of the plastic. They can be a powder or a resin/color premix. |
| Composite material | A composite material is a material that is produced from two or more constituent materials. These constituent materials have dissimilar chemical or physical properties and are merged to create a material with properties unlike the individual elements. |
| Degree of Polymerization (DP) | The number of monomeric units in a macromolecule, polymer, or oligomer molecule is referred to as the degree of polymerization or DP. Plastics with useful physical properties often have DPs in the thousands. |
| Dispersion | To create a suspension or solution of material in another substance, fine, agglomerated solid particles of one substance are dispersed in a liquid or another substance to form a dispersion. |
| Fiberglass | Fiberglass-reinforced plastic is a material made up of glass fibers embedded in a resin matrix. These materials have high tensile and impact strength. Handrails and platforms are two examples of lightweight structural applications that use standard fiberglass. |
| Fiber-reinforced polymer (FRP) | Fiber-reinforced polymer is a composite material made of a polymer matrix reinforced with fibers. The fibers are usually glass, carbon, aramid, or basalt. |
| Flake | This is a dry, peeled-off piece, usually with an uneven surface, and is the base of cellulosic plastics. |
| Fluoropolymers | This is a fluorocarbon-based polymer with multiple carbon-fluorine bonds. It is characterized by high resistance to solvents, acids, and bases. These materials are tough yet easy to machine. Some of the popular fluoropolymers are PTFE, ETFE, PVDF, PVF, etc. |
| Kevlar | Kevlar is the commonly referred name for aramid fiber, which was initially a Dupont brand for aramid fiber. Any group of lightweight, heat-resistant, solid, synthetic, aromatic polyamide materials that are fashioned into fibers, filaments, or sheets is called aramid fiber. They are classified into Para-aramid and Meta-aramid. |
| Laminate | A structure or surface composed of sequential layers of material bonded under pressure and heat to build up to the desired shape and width. |
| Nylon | They are synthetic fiber-forming polyamides formed into yarns and monofilaments. These fibers possess excellent tensile strength, durability, and elasticity. They have high melting points and can resist chemicals and various liquids. |
| PET preform | A preform is an intermediate product that is subsequently blown into a polyethylene terephthalate (PET) bottle or a container. |
| Plastic compounding | Compounding consists of preparing plastic formulations by mixing and/or blending polymers and additives in a molten state to achieve the desired characteristics. These blends are automatically dosed with fixed setpoints usually through feeders/hoppers. |
| Plastic pellets | Plastic pellets, also known as pre-production pellets or nurdles, are the building blocks for nearly every product made of plastic. |
| Polymerization | It is a chemical reaction of several monomer molecules to form polymer chains that form stable covalent bonds. |
| Styrene Copolymers | A copolymer is a polymer derived from more than one species of monomer, and a styrene copolymer is a chain of polymers consisting of styrene and acrylate. |
| Thermoplastics | Thermoplastics are defined as polymers that become soft material when it is heated and becomes hard when it is cooled. Thermoplastics have wide-ranging properties and can be remolded and recycled without affecting their physical properties. |
| Virgin Plastic | It is a basic form of plastic that has never been used, processed, or developed. It may be considered more valuable than recycled or already used materials. |


Research Methodology
Mordor Intelligence follows a four-step methodology in all our reports.
- Step-1: Identify Key Variables: The quantifiable key variables (industry and extraneous) pertaining to the specific product segment and country are selected from a group of relevant variables & factors based on desk research & literature review; along with primary expert inputs. These variables are further confirmed through regression modeling (wherever required).
- Step-2: Build a Market Model: In order to build a robust forecasting methodology, the variables and factors identified in Step-1 are tested against available historical market numbers. Through an iterative process, the variables required for market forecast are set and the model is built on the basis of these variables.
- Step-3: Validate and Finalize: In this important step, all market numbers, variables and analyst calls are validated through an extensive network of primary research experts from the market studied. The respondents are selected across levels and functions to generate a holistic picture of the market studied.
- Step-4: Research Outputs: Syndicated Reports, Custom Consulting Assignments, Databases & Subscription Platforms


