MicroRNA Biomarkers Market Size and Share
Market Overview
| Study Period | 2025 - 2031 |
|---|---|
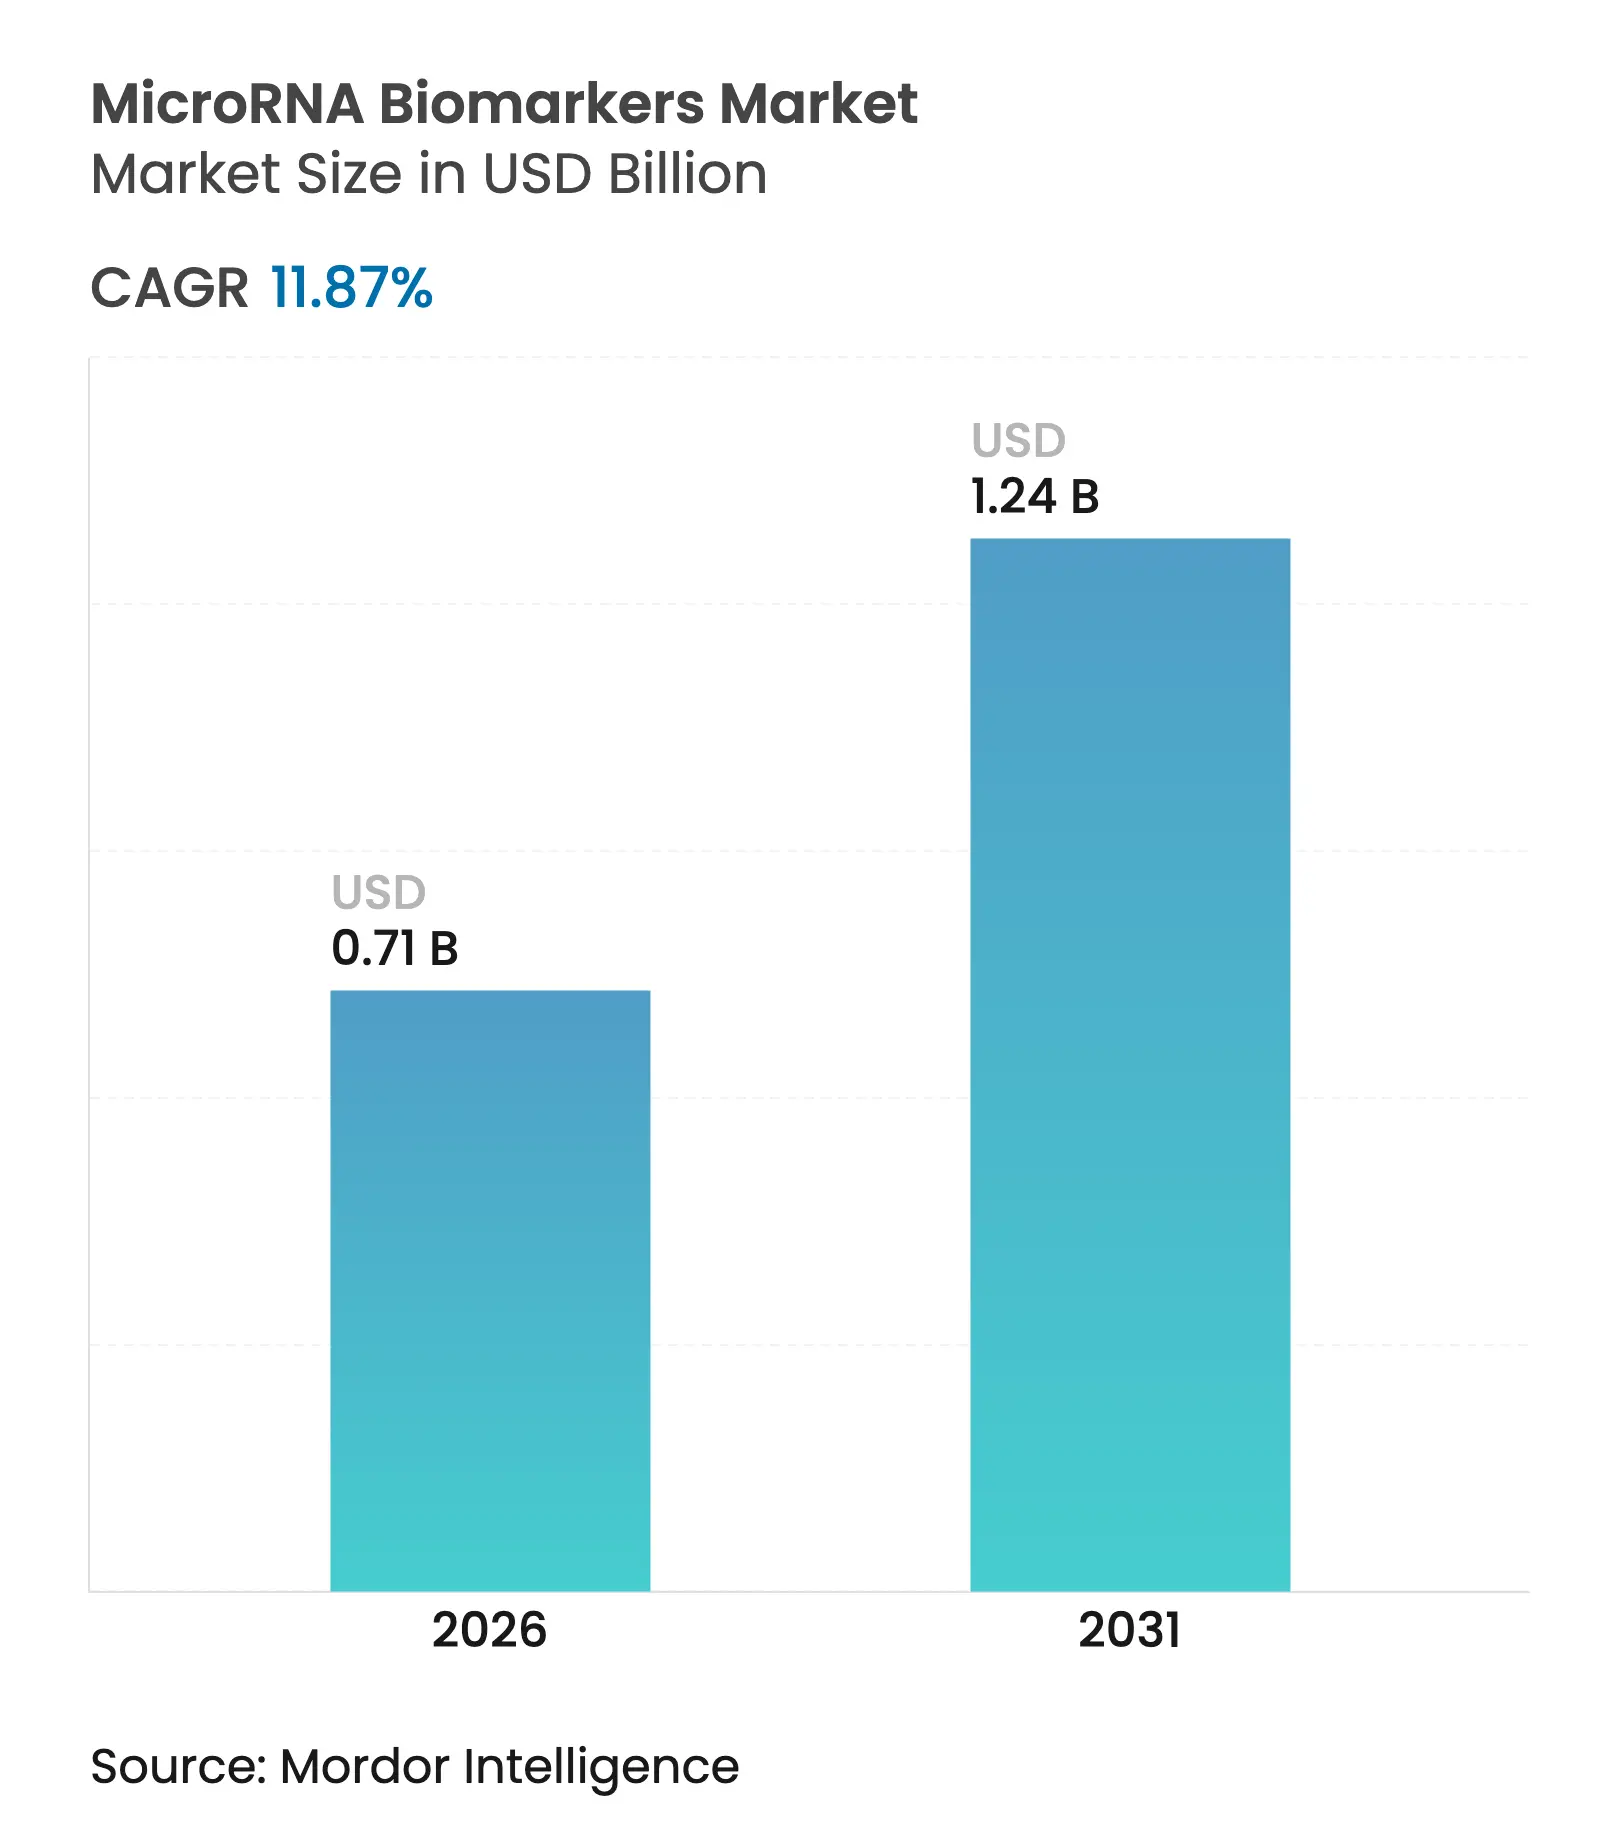
| Market Size (2026) | USD 0.71 Billion |
| Market Size (2031) | USD 1.24 Billion |
| Growth Rate (2026 - 2031) | 11.87 % CAGR |
| Fastest Growing Market | Asia Pacific |
| Largest Market | North America |
| Market Concentration | Medium |
Major Players *Disclaimer: Major Players sorted in no particular order. Image © Mordor Intelligence. Reuse requires attribution under CC BY 4.0. |
MicroRNA Biomarkers Market Analysis by Mordor Intelligence
The MicroRNA biomarkers market size is expected to grow from USD 0.63 billion in 2025 to USD 0.71 billion in 2026 and is forecast to reach USD 1.24 billion by 2031 at 11.87% CAGR over 2026-2031. Current growth reflects the transition from research adoption toward clinical‐grade diagnostics, supported by recent regulatory endorsements, platform automation, and broader precision medicine initiatives. Demand rises as liquid biopsy workflows gain traction beyond oncology, artificial intelligence reduces biomarker discovery cycles, and point-of-care requirements reshape laboratory purchasing priorities. These forces reinforce sustained investment in both core sequencing technologies and peripheral software analytics, creating a landscape in which workflow integration and reimbursement readiness outweigh incremental analytical gains. Strategic consolidation, such as acquisitions that blend spatial transcriptomics with miRNA detection, further accelerates platform convergence and shortens time-to-market for new assays.
Key Report Takeaways
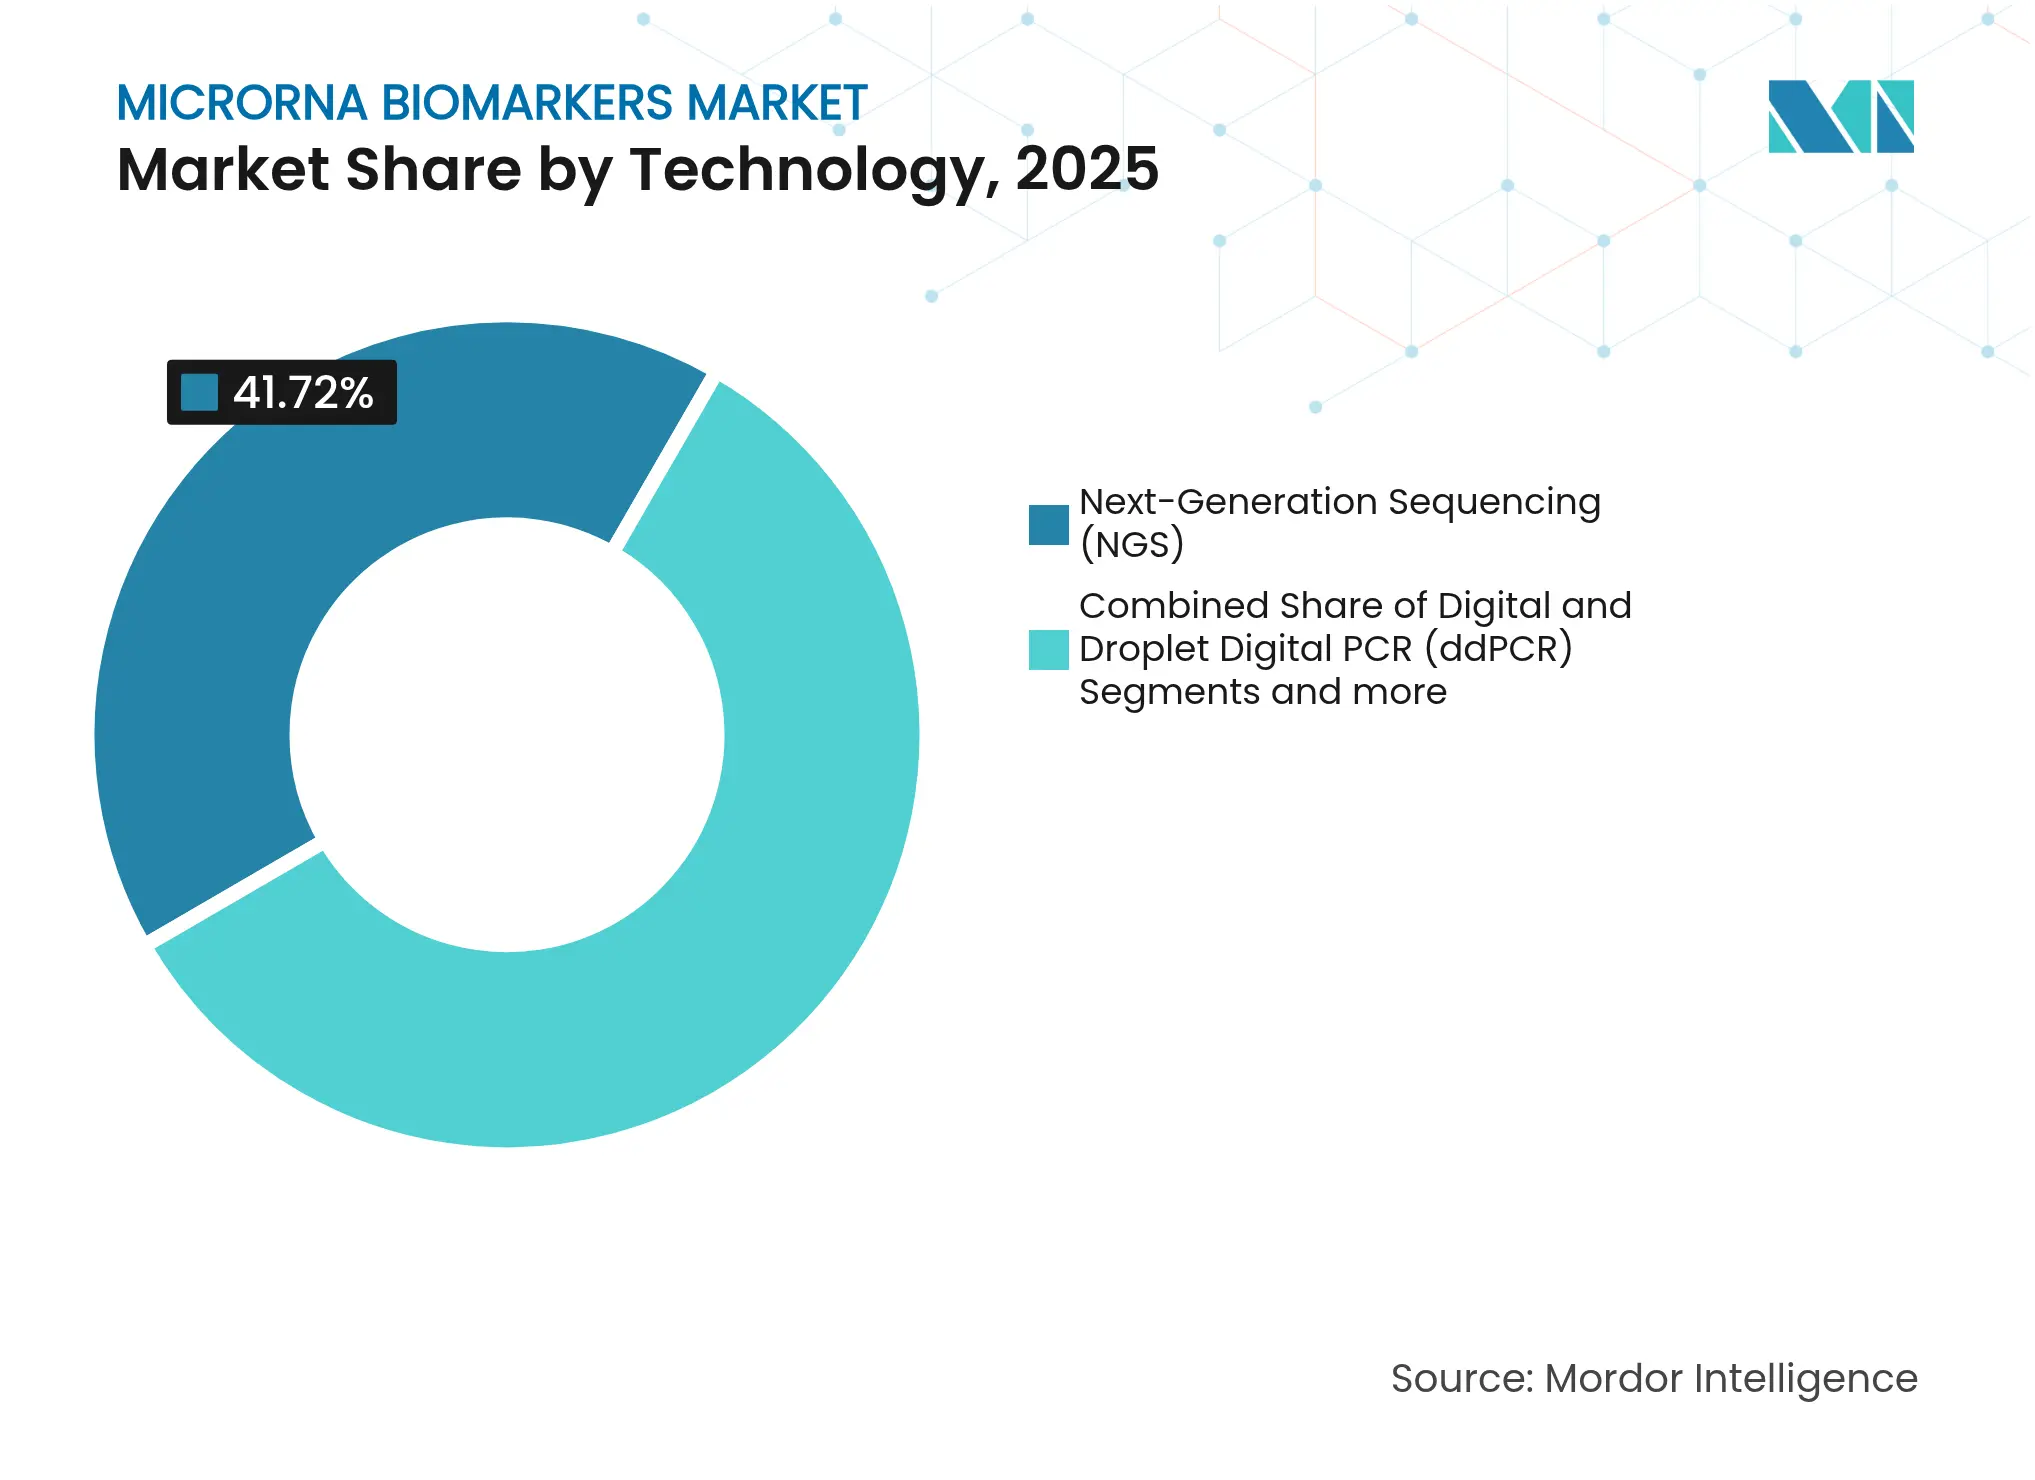
- By technology, Next-Generation Sequencing led with 41.72% MicroRNA biomarkers market share in 2025, while Digital & Droplet Digital PCR is forecast to advance at a 12.51% CAGR through 2031.
- By product and service, Kits & Reagents dominated with 47.65% revenue share in 2025; Software & Bioinformatics Tools are set to expand at a 12.34% CAGR to 2031.
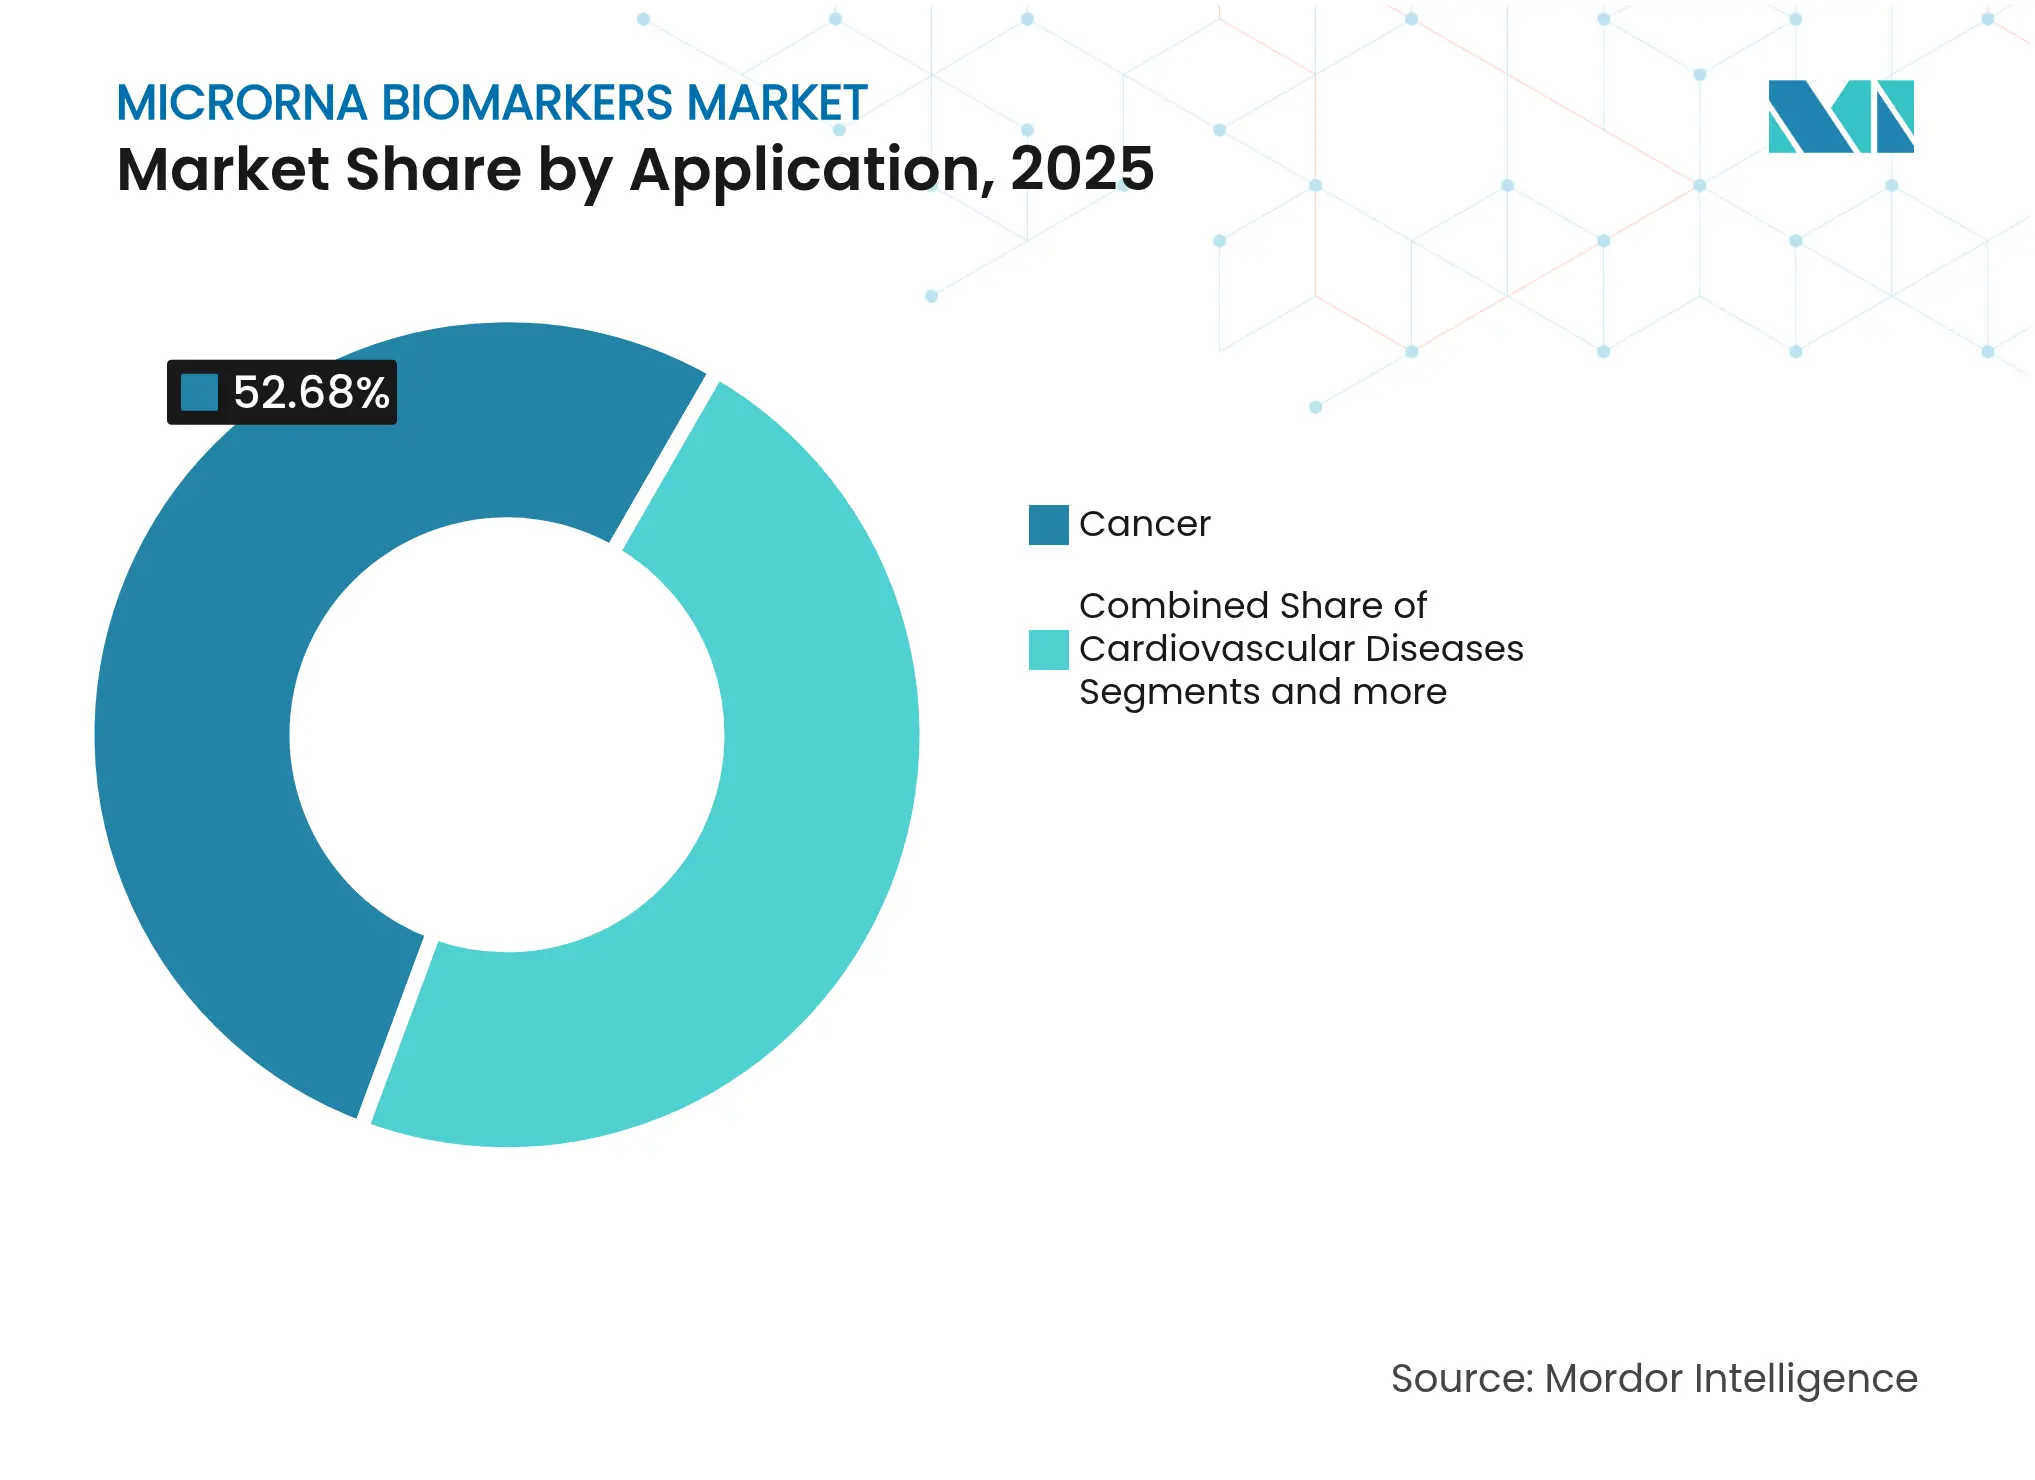
- By application, cancer accounted for 52.68% of the MicroRNA biomarkers market size in 2025, whereas infectious diseases are poised for the fastest 12.21% CAGR through 2031.
- By end-user, Pharmaceutical & Biotechnology Companies held 46.98% share in 2025; Hospitals & Clinics exhibit the highest 12.18% CAGR to 2031.
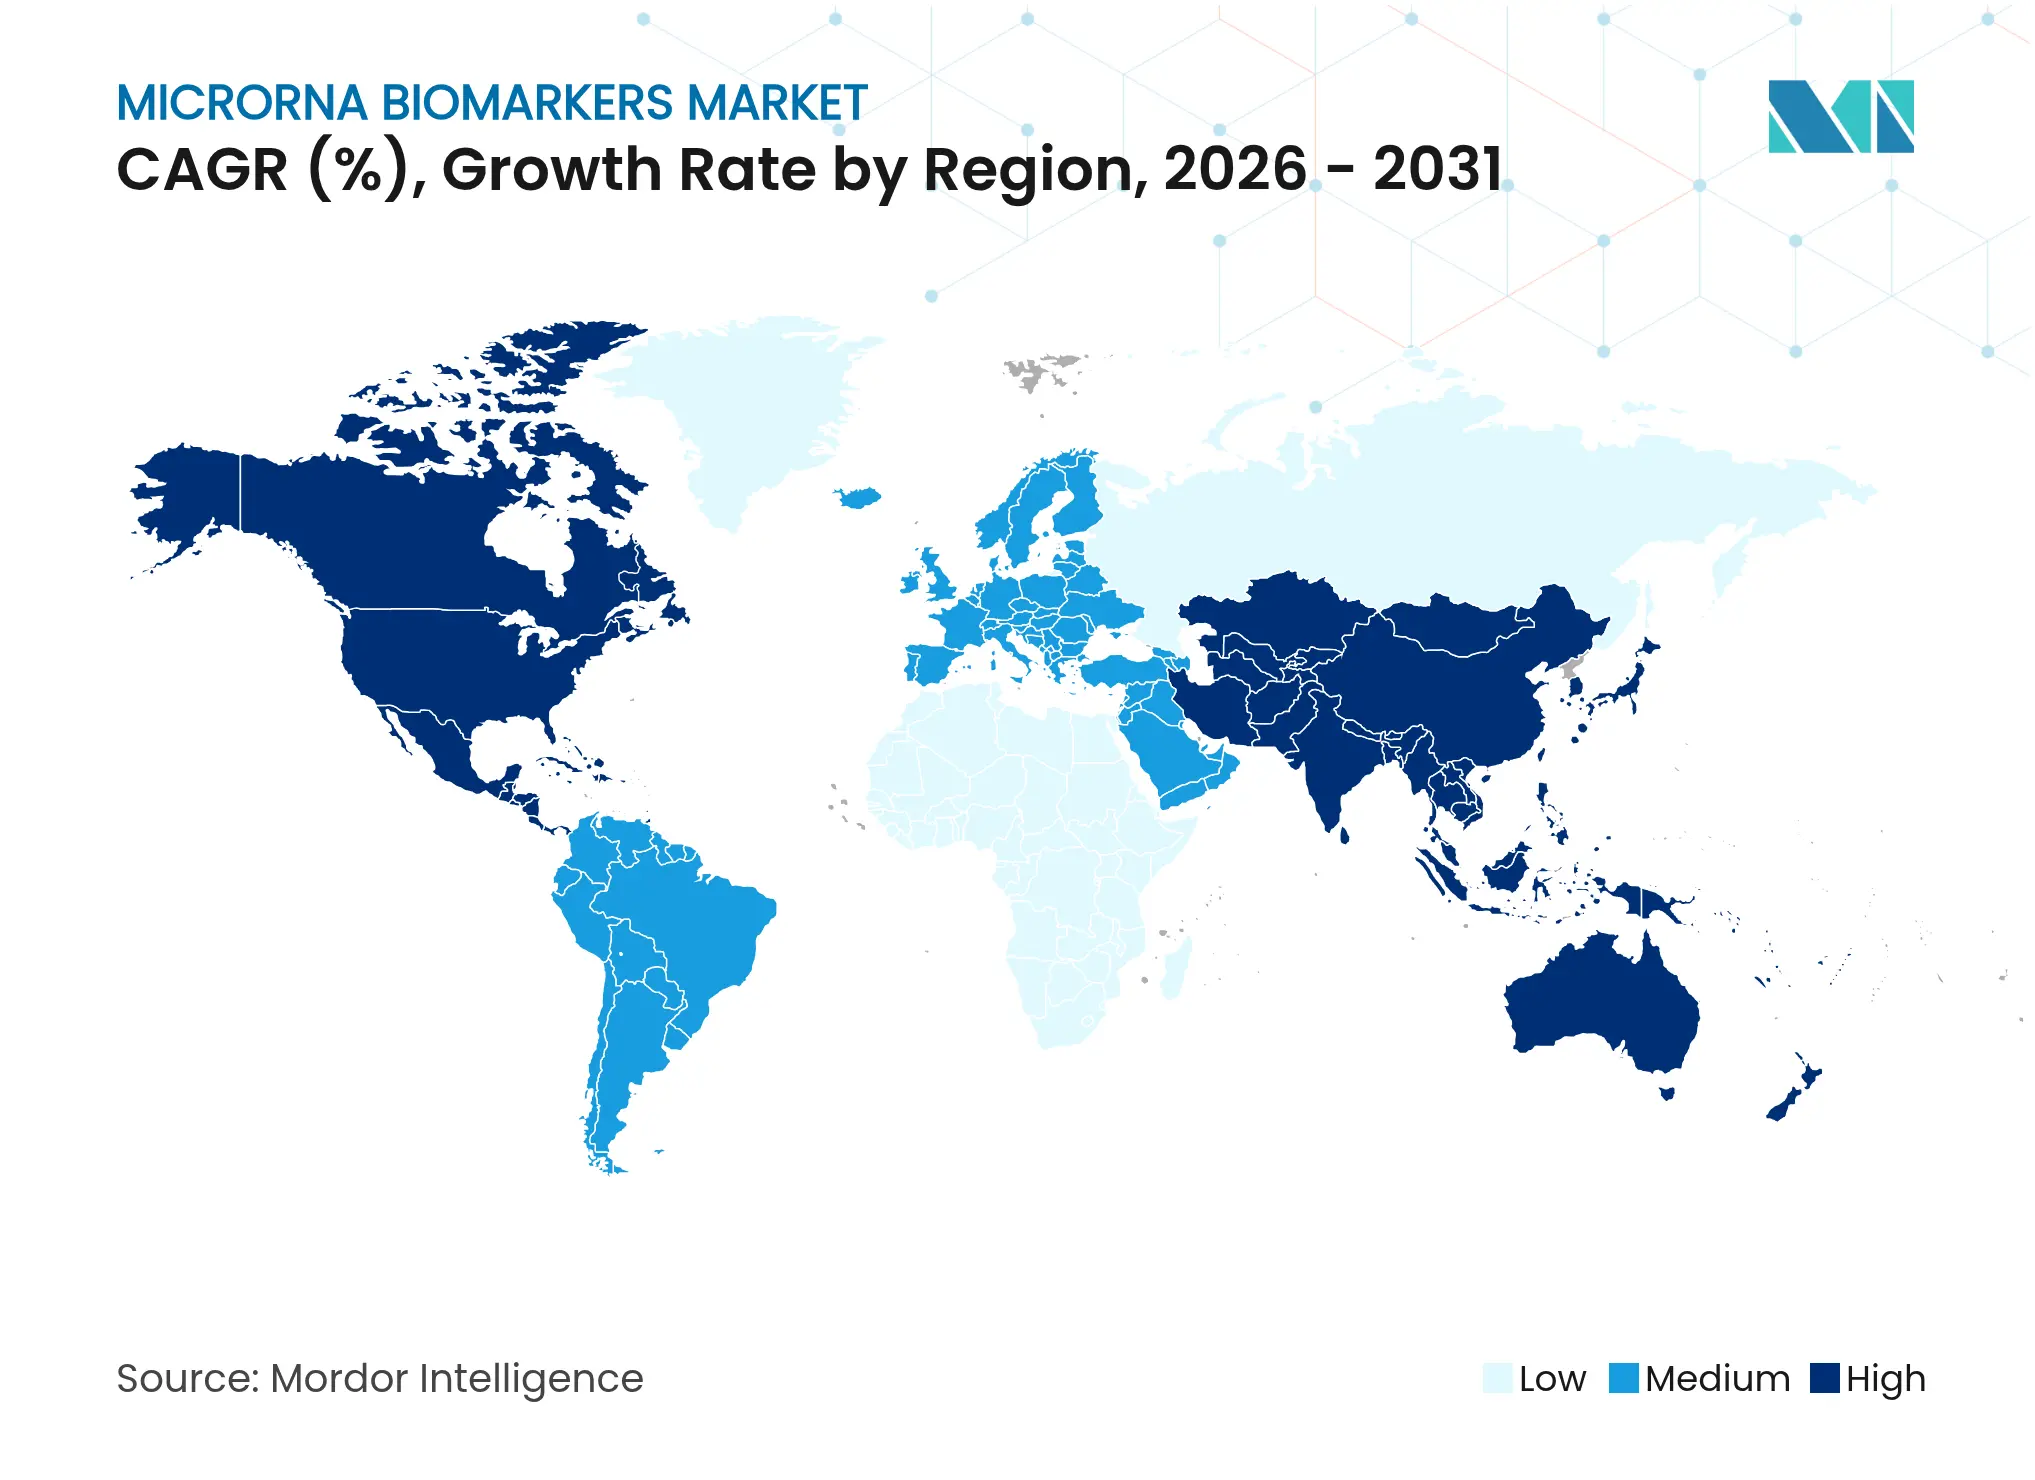
- By geography, North America commanded 40.76% revenue in 2025, while Asia-Pacific is projected to grow at a 12.59% CAGR to 2031.
Note: Market size and forecast figures in this report are generated using Mordor Intelligence's proprietary estimation framework, updated with the latest available data and insights as of 2026.
Global MicroRNA Biomarkers Market Trends and Insights
Drivers Impact Analysis
| Driver | (~) % Impact on CAGR Forecast | Geographic Relevance | Impact Timeline | |||
|---|---|---|---|---|---|---|
Rising prevalence of cancer & chronic diseases
Rising prevalence of cancer & chronic diseases
| +3.2% | Global, with concentration in North America & Europe | Long term (≥ 4 years) | (~) % Impact on CAGR Forecast:+3.2% |
Geographic Relevance
:
Global, with concentration in North America & Europe
|
Impact Timeline
:
Long term (≥ 4 years)
|
Advances in NGS, ddPCR & qRT-PCR platforms
Advances in NGS, ddPCR & qRT-PCR platforms
| +2.8% | Global, led by North America & Asia-Pacific | Medium term (2-4 years) | |||
Growing demand for minimally-invasive liquid biopsies
Growing demand for minimally-invasive liquid biopsies
| +2.5% | Global, early adoption in developed markets | Medium term (2-4 years) | |||
Expansion of precision/companion diagnostics programs
Expansion of precision/companion diagnostics programs
| +1.9% | North America & Europe, expanding to Asia-Pacific | Long term (≥ 4 years) | |||
AI/ML-enabled discovery of novel miRNA signatures
AI/ML-enabled discovery of novel miRNA signatures
| +1.6% | North America & Europe, expanding to Asia-Pacific | Long term (≥ 4 years) | |||
Expanding clinical applications
Expanding clinical applications
| +0.8% | North America & Europe, expanding to Asia-Pacific | Medium term (2-4 years) | |||
| Source: Mordor Intelligence | ||||||
Rising Prevalence of Cancer & Chronic Diseases
Cancer incidence continues to climb, sustaining demand for early-detection solutions. A National Cancer Institute study released in October 2024 demonstrated 97% accuracy for early-stage pancreatic cancer using a microRNA liquid biopsy, highlighting the biomarker’s clinical viability for hard-to-detect tumors [1]National Cancer Institute, "Blood Test Accurately Detects Early-Stage Pancreatic Cancer," cancer.gov. The same inherent stability that favors oncology testing also supports chronic disease monitoring: 2025 research reported miR-4454 delivering 88.9% diagnostic accuracy for type 2 diabetes, showing expansion potential into metabolic disorders. This dual relevance links aging populations with precision medicine and keeps the MicroRNA biomarkers market on a sustained upward path [2]Song Yang, "Circulating miR-4454 as a potential biomarker for the diagnosis of T2DM and the prediction value of comorbidity and complications in T2DM," BMC Endocrine Disorders, bmcendocrdisord.biomedcentral.com.
Advances in NGS, ddPCR & qRT-PCR Platforms
Automated, clinically validated platforms are lowering the technical barriers that once limited miRNA adoption. Thermo Fisher Scientific demonstrated a 24-hour turnaround for genomic results in the myeloMATCH trial in July 2024, integrating NGS into real-time patient management [3]Thermo Fisher Scientific Inc.. "Thermo Fisher Scientific to Help Advance Myeloid Cancer Clinical Research and Treatment Utilizing Next Generation Sequencing Technology," thermofisher.com. Simultaneously, studies show ddPCR minimizes variability when quantifying low-abundance targets, clarifying regulatory pathways. Oxford Nanopore’s real-time sequencing now offers portable analysis, though widespread clinical validation is still under way. These innovations emphasize ease-of-use and compliance, which, more than raw sensitivity, influence purchasing decisions in the MicroRNA biomarkers market.
Growing Demand for Minimally-Invasive Liquid Biopsies
Regulatory validation of blood-based screening elevates confidence in liquid biopsy models. FDA approval of Guardant Health’s Shield colorectal cancer test in July 2024 set reimbursement precedent for population-level screening. miRNA encapsulated in extracellular vesicles retains integrity across diverse body fluids, producing 85.4% sensitivity for bladder cancer when combined with standard markers in recent multicenter research. Patient preference for non-invasive testing, coupled with health-system cost containment, ensures steady demand growth for the MicroRNA biomarkers market.
AI / ML-Enabled Discovery of Novel miRNA Signatures
Artificial intelligence is compressing the biomarker discovery cycle. ESGCmiRD achieved 98.6% accuracy in early-stage gastric cancer detection by analyzing a five-miRNA panel, demonstrating machine learning’s power to spot patterns beyond human capability. PandaOmics further integrates multi-omics data and robotic validation, shortening traditional 5-7 year timelines. Such progress quickly feeds new assays into development pipelines, expanding the MicroRNA biomarkers market without proportional increases in R&D spending.
Restraints Impact Analysis
| Restraint | (~) % Impact on CAGR Forecast | Geographic Relevance | Impact Timeline | |||
|---|---|---|---|---|---|---|
High cost of comprehensive miRNA profiling workflows
High cost of comprehensive miRNA profiling workflows
| -2.1% | Global, particularly impacting emerging markets | Medium term (2-4 years) | (~) % Impact on CAGR Forecast:
-2.1%
|
Geographic Relevance
:
Global, particularly impacting emerging markets
|
Impact Timeline
:
Medium term (2-4 years)
|
Lack of global assay & data-reporting standards
Lack of global assay & data-reporting standards
| -1.8% | Global, with regional variations in regulatory requirements | Long term (≥ 4 years) | |||
Slow sample-to-answer times for POC settings
Slow sample-to-answer times for POC settings
| -1.2% | Global, affecting point-of-care adoption | Short term (≤ 2 years) | |||
Data-sovereignty concerns in cloud-based sequencing labs
Data-sovereignty concerns in cloud-based sequencing labs
| -0.9% | Europe & Asia-Pacific, with strict data protection regulations | Medium term (2-4 years) | |||
| Source: Mordor Intelligence | ||||||
High Cost of Comprehensive miRNA Profiling Workflows
Library preparation, sequencing, and bioinformatics often exceed USD 500 per sample, deterring routine use in resource-constrained settings. Microfluidic platforms such as ExoArc report 90% sensitivity for non-small cell lung cancer while lowering reagent usage, yet still await extensive validation. Portable nanopore-based devices demonstrate 97% sensitivity and specificity for cancer detection, suggesting cost reductions through miniaturization. Until scale and automation mature, premium healthcare systems will remain primary adopters within the MicroRNA biomarkers market.
Lack of Global Assay & Data-Reporting Standards
Variability across extraction methods and quantification platforms undermines cross-study comparability. Researchers documented divergent miRNA levels when identical specimens were processed on different systems, underscoring the need for consensus protocols. Emerging ISO frameworks address nucleic acid testing generally, but miRNA-specific guidelines lag. Initiatives such as privacy-preserving federated learning allow multi-institutional model training without raw data sharing, mitigating compliance hurdles in regions with strict protection laws. Progress on harmonized standards will dictate the pace of broad clinical adoption in the MicroRNA biomarkers market.
Segment Analysis
By Technology: Digital PCR Gains Clinical Traction
Next-Generation Sequencing retained 41.72% share of the MicroRNA biomarkers market size in 2025 due to comprehensive profiling capabilities that researchers trust for discovery. Digital & Droplet Digital PCR, however, is accelerating at a 12.51% CAGR because laboratories value its absolute quantification and user-friendly workflows. The MicroRNA biomarkers market responds to demands for time-efficient, reproducible assays rather than incremental improvements in sensitivity. QIAGEN expanded its QIAcuity portfolio with 100 validated assays in September 2024, signaling clear movement toward plug-and-play clinical testing. Microarray adoption is fading as its dynamic range lags behind sequencing and PCR, while real-time nanopore devices remain promising but early-stage. As regulators prioritize standardization, digital PCR’s calibration-free methodology strengthens its position.
Research laboratories will still depend on NGS for discovery projects, ensuring stable revenue for sequencing platforms. Yet the commercial spotlight now shines on digital PCR where hospital laboratories see quick integration into existing quality control frameworks. Companies bridging both technologies secure longevity in the MicroRNA biomarkers market, balancing discovery breadth with clinical throughput.
Note: Segment shares of all individual segments available upon report purchase
By Product & Service: Software Acceleration Drives Value
Kits & Reagents represented 47.65% of revenue in 2025, reflecting recurring consumable demand across diagnostic workflows. Software & Bioinformatics Tools, though smaller, are growing most rapidly at a 12.34% CAGR as automated data analysis becomes indispensable. Laboratories increasingly license cloud-based pipelines that output regulatory-ready reports, allowing them to process larger volumes without hiring bioinformaticians. QIAGEN’s Digital Insights division, which integrates natural-language processing for literature curation, exemplifies the pivot toward software-centric revenue.
Instruments continue to sell steadily as labs upgrade to automated liquid handlers and cartridge-based sequencers that shorten hands-on time. Service providers benefit from outsourcing trends among hospitals that lack molecular infrastructure. Over time, intellectual property embedded in algorithms is expected to contribute a larger share of profitability than consumables, altering competitive dynamics within the MicroRNA biomarkers market.
By Application: Infectious Diseases Emerge Beyond Oncology
Cancer maintained 52.68% of the MicroRNA biomarkers market size in 2025, supported by deep clinical evidence and established reimbursement pathways. Infectious diseases now post a 12.21% CAGR, reflecting pandemic preparedness funding and broader interest in immune monitoring. A 2025 study confirmed miR-200c-3p and two additional signatures as reliable markers for long COVID, validating miRNA utility outside oncology. Cardiovascular and neurological applications are progressing steadily, and autoimmune indications are beginning to show promise for treatment response prediction.
The expanding disease scope promises more balanced revenue streams, reducing the microRNA biomarkers market’s past dependency on oncology research budgets. Companies that tailor panels to multiple specialties will capture durable demand.
Note: Segment shares of all individual segments available upon report purchase
By End-User: Clinical Adoption Accelerates
Pharmaceutical & Biotechnology Companies held 46.98% share in 2025, leveraging miRNA assays for target validation and companion diagnostic development. Hospitals & Clinics now top the growth chart at a 12.18% CAGR, reflecting regulatory approvals such as the August 2024 clearance of ColoSense for colorectal cancer screening. Academic institutes remain essential for discovery, while contract research organizations gain from outsourcing of complex analyses.
Dual-track strategies are becoming essential: suppliers must serve research needs with high-plex discovery tools while offering turnkey kits that meet clinical accreditation standards. Hospitals also seek point-of-care formats that fit into existing sample-to-answer workflows, indicating where future product roadmaps should focus.
Geography Analysis
North America generated 40.76% of the MicroRNA biomarkers market size in 2025, benefiting from mature reimbursement structures and a dense network of high-complexity laboratories. Clinical adoption accelerated after FDA approvals signaled regulatory confidence, and public funding continued to funnel into precision diagnostics. Domestic companies leverage established logistics to roll out new assays rapidly, keeping the region firmly in leadership.
Asia-Pacific recorded the strongest momentum with a 12.59% CAGR forecast to 2031. Government-backed precision medicine programs and local pharmaceutical investment of USD 2.1 billion into small nucleic acid therapeutics in 2024 highlight regional appetite for RNA diagnostics. Infrastructure investments, such as national cloud genomics platforms, lower adoption barriers for mid-tier hospitals. Local partnerships are therefore vital for multinational firms seeking share in the MicroRNA biomarkers market.
Europe sustained moderate growth through harmonized regulatory pathways and pan-EU research consortia. Stricter data-sovereignty rules prompt higher on-premise or regional-cloud deployments, influencing vendor roadmaps. Latin America and Middle East & Africa remain emerging but strategically important. Early adopters in Brazil and the United Arab Emirates are piloting liquid biopsy programs, proving commercial potential once import duties and cold-chain challenges are managed. Together these geographies require differentiated pricing strategies and adaptable support models to capture diversified demand for the MicroRNA biomarkers market.

Competitive Landscape
Market Concentration
The MicroRNA biomarkers market shows moderate concentration. Global life-science conglomerates—Thermo Fisher Scientific, QIAGEN, and Illumina—hold scale advantages through integrated portfolios spanning extraction kits to interpretation software. Their regulatory track records make them preferred partners for hospitals scaling new assays. Specialized entrants, however, gain traction by focusing on niche clinical questions and deploying novel chemistries that enhance performance on specific sample types.
M&A activity accelerated in 2024. Bruker’s acquisition of NanoString Technologies broadened its spatial transcriptomics footprint, an area increasingly linked to miRNA expression profiling. Strategic alliances also revolve around AI: QIAGEN licensed deep-learning models to enhance variant interpretation within its genomic workbench. Competitive focus is shifting from instrument throughput to seamless end-to-end workflows, including compliance management and remote service capabilities.
Companies are additionally investing in cloud security to satisfy European GDPR and Asia-Pacific data localization requirements, which remain restraints on cross-border assay deployment. Suppliers that validate both lab hardware and cloud environments under unified quality systems are likely to gain durable differentiation in the MicroRNA biomarkers market.
MicroRNA Biomarkers Industry Leaders

*Disclaimer: Major Players sorted in no particular order
Recent Industry Developments
- May 2025: Beth Israel Deaconess Medical Center reported high-throughput miRNA screening using Mirxes qPCR panels covering 372 miRNAs per sample.
- April 2025: MiraDx validated the PROSTOX Ultra test, the first diagnostic for predicting long-term radiation toxicity in prostate cancer using microRNA SNPs.
- January 2025: Geneoscopy closed a USD 105 million Series C round led by Bio-Rad Laboratories to commercialize the ColoSense stool-derived RNA assay.
- August 2024: FDA approved ColoSense, an RNA-based colorectal cancer screening test analyzing eight RNA biomarkers and hemoglobin in stool samples.
Table of Contents for MicroRNA Biomarkers Industry Report
1. Introduction
- 1.1Study Assumptions & Market Definition
- 1.2Scope of the Study
2. Research Methodology
3. Executive Summary
4. Market Landscape
- 4.1Market Overview
- 4.2Market Drivers
- 4.2.1Rising prevalence of cancer & chronic diseases
- 4.2.2Advances in NGS, ddPCR & qRT-PCR platforms
- 4.2.3Growing demand for minimally-invasive liquid biopsies
- 4.2.4Expansion of precision/companion diagnostics programs
- 4.2.5AI/ML-enabled discovery of novel miRNA signatures
- 4.2.6Expanding clinical applications
- 4.3Market Restraints
- 4.3.1High cost of comprehensive miRNA profiling workflows
- 4.3.2Lack of global assay & data-reporting standards
- 4.3.3Slow sample-to-answer times for POC settings
- 4.3.4Data-sovereignty concerns in cloud-based sequencing labs
- 4.4Regulatory Landscape
- 4.5Technological Outlook
- 4.6Porters Five Forces Analysis
- 4.6.1Threat of New Entrants
- 4.6.2Bargaining Power of Buyers
- 4.6.3Bargaining Power of Suppliers
- 4.6.4Threat of Substitutes
- 4.6.5Intensity of Rivalry
5. Market Size & Growth Forecasts (Value, USD)
- 5.1By Technology
- 5.1.1Next-Generation Sequencing (NGS)
- 5.1.2Digital & Droplet Digital PCR (ddPCR)
- 5.1.3Microarray
- 5.1.4Others
- 5.2By Product and Service
- 5.2.1Kits and Reagents
- 5.2.2Instruments and Platforms
- 5.2.3Software and Bioinformatics Tools
- 5.2.4Services
- 5.3By Application
- 5.3.1Cancer
- 5.3.2Cardiovascular Diseases
- 5.3.3Neurological Disorders
- 5.3.4Autoimmune Disorders
- 5.3.5Infectious Diseases
- 5.3.6Others
- 5.4By End User
- 5.4.1Pharmaceutical and Biotechnology Companies
- 5.4.2Academic and Research Institutes
- 5.4.3Hospitals and Clinics
- 5.4.4Others
- 5.5By Geography
- 5.5.1North America
- 5.5.1.1United States
- 5.5.1.2Canada
- 5.5.1.3Mexico
- 5.5.2Europe
- 5.5.2.1Germany
- 5.5.2.2United Kingdom
- 5.5.2.3France
- 5.5.2.4Italy
- 5.5.2.5Spain
- 5.5.2.6Rest of Europe
- 5.5.3Asia-Pacific
- 5.5.3.1China
- 5.5.3.2Japan
- 5.5.3.3India
- 5.5.3.4Australia
- 5.5.3.5South Korea
- 5.5.3.6Rest of Asia-Pacific
- 5.5.4Middle East and Africa
- 5.5.4.1GCC
- 5.5.4.2South Africa
- 5.5.4.3Rest of Middle East and Africa
- 5.5.5South America
- 5.5.5.1Brazil
- 5.5.5.2Argentina
- 5.5.5.3Rest of South America
6. Competitive Landscape
- 6.1Market Concentration
- 6.2Market Share Analysis
- 6.3Company Profiles (includes Global level Overview, Market level overview, Core Segments, Financials as available, Strategic Information, Market Rank/Share, Products & Services, Recent Developments)
- 6.3.1Thermo Fisher Scientific
- 6.3.2QIAGEN
- 6.3.3Illumina
- 6.3.4Agilent Technologies
- 6.3.5Bio-Rad Laboratories
- 6.3.6Merck KGaA
- 6.3.7NanoString Technologies
- 6.3.8PerkinElmer
- 6.3.9GeneCopoeia
- 6.3.10Norgen Biotek
- 6.3.11Zymo Research
- 6.3.12Asuragen (Exact Sciences)
- 6.3.13Oxford Nanopore Technologies
- 6.3.14Parse Biosciences
- 6.3.15Lexogen
- 6.3.16Quantabio
- 6.3.17MiRXES
- 6.3.18Bioline (Meridian Bioscience)
- 6.3.19Takara Bio
7. Market Opportunities & Future Outlook
- 7.1White-space & Unmet-Need Assessment
Research Methodology Framework and Report Scope
Market Definitions and Key Coverage
Our study defines the microRNA (miRNA) biomarkers market as global revenue generated from clinic-ready or research-grade miRNA signature panels together with the kits, reagents, bioinformatic software, and laboratory services used to detect, quantify, and interpret circulating or tissue miRNAs that flag disease onset, progression, or therapy response.
Scope exclusion: Therapeutic miRNA drugs, generic genomics consumables that are not tied to biomarker workflows, and broad multi-omics panels are kept outside this estimate.
Segmentation Overview
- By Technology
- Next-Generation Sequencing (NGS)
- Digital & Droplet Digital PCR (ddPCR)
- Microarray
- Others
- Next-Generation Sequencing (NGS)
- By Product and Service
- Kits and Reagents
- Instruments and Platforms
- Software and Bioinformatics Tools
- Services
- Kits and Reagents
- By Application
- Cancer
- Cardiovascular Diseases
- Neurological Disorders
- Autoimmune Disorders
- Infectious Diseases
- Others
- Cancer
- By End User
- Pharmaceutical and Biotechnology Companies
- Academic and Research Institutes
- Hospitals and Clinics
- Others
- Pharmaceutical and Biotechnology Companies
- By Geography
- North America
- United States
- Canada
- Mexico
- United States
- Europe
- Germany
- United Kingdom
- France
- Italy
- Spain
- Rest of Europe
- Germany
- Asia-Pacific
- China
- Japan
- India
- Australia
- South Korea
- Rest of Asia-Pacific
- China
- Middle East and Africa
- GCC
- South Africa
- Rest of Middle East and Africa
- GCC
- South America
- Brazil
- Argentina
- Rest of South America
- Brazil
- North America
Detailed Research Methodology and Data Validation
Primary Research
Mordor analysts interviewed molecular pathologists, kit product leads, and diagnostics distributors in North America, Europe, and Asia-Pacific. Their insight on bench-level kit pull-through, reimbursement friction, and roll-out timing allowed us to temper desk findings and recalibrate penetration curves.
Desk Research
We began by mapping open evidence from the National Cancer Institute, PubMed trials, EMBL sequence banks, FDA 510(k) clearances, and WHO disease files to frame volumes, regulatory status, and geography splits. Trade flows extracted from UN Comtrade, tender notices on Tenders Info, and regional fee schedules anchored kit prices and test counts. Annual reports accessed through D&B Hoovers and news pulled via Dow Jones Factiva revealed supplier revenue splits and installed-base cues. A second pass reconciled country gaps with Questel patent trends and mortality statistics, ensuring no region distorted the baseline. These illustrations are indicative only; many further records strengthened cross-checks.
Market-Sizing & Forecasting
A blended top-down and bottom-up model was built. Eligible patient pools for cancer, cardiovascular, neurodegenerative, and infectious indications were multiplied by test uptake and average selling price; supplier roll-ups plus sampled ASP multiplied by volume checks served as guardrails. Key variables tracked include fresh regulatory approvals, NGS or digital PCR installed-base growth, kit price drift, venture funding, and liquid biopsy penetration. Forecasts to 2030 use multivariate regression with scenario analysis that shows sensitivity to reimbursement shifts.
Data Validation & Update Cycle
Outputs face variance scans against import logs and prevalence studies before senior review. Figures refresh each year, with mid-cycle edits when major pricing or regulatory events surface, so clients always receive the latest viewpoint.
Why Mordor's MicroRNA Biomarkers Baseline Commands Credibility
Benchmark comparison
Published numbers often diverge because firms widen product baskets, freeze exchange rates, or stretch forecast horizons.
By focusing only on clinically actionable workflows and revisiting inputs annually, we deliver a balanced yardstick that decision makers trust. Key gap drivers elsewhere include unexplained bundling of basic research reagents, inclusion of pipeline therapeutics, and growth multipliers that ignore real test volumes.
| Market Size | Anonymized source | Primary gap driver | ||
|---|---|---|---|---|
USD 0.63 B (2025) | Mordor Intelligence | - | Anonymized source:Mordor Intelligence | Primary gap driver:- |
USD 1.76 B (2024) | Global Consultancy A | Bundles research reagents and therapeutics, uses 2019 prices | ||
USD 2.56 B (2024) | Regional Consultancy B | Pools all nucleic-acid biomarkers and applies uniform growth factors |