Micro Inverter Market Size and Share
Market Overview
| Study Period | 2020 - 2031 |
|---|---|
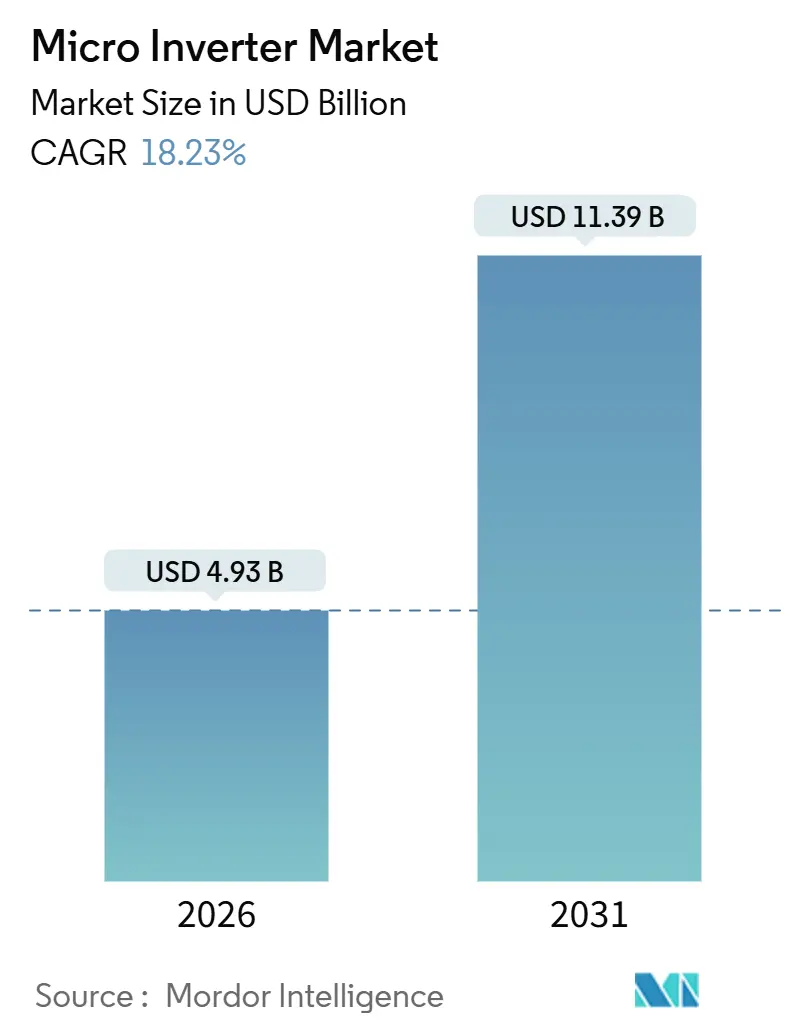
| Market Size (2026) | USD 4.93 Billion |
| Market Size (2031) | USD 11.39 Billion |
| Growth Rate (2026 - 2031) | 18.23% CAGR |
| Fastest Growing Market | Asia-Pacific |
| Largest Market | North America |
| Market Concentration | Medium |
Major Players *Disclaimer: Major Players sorted in no particular order Image © Mordor Intelligence. Reuse requires attribution under CC BY 4.0. | |
Micro Inverter Market Analysis by Mordor Intelligence
The micro inverter market size stood at USD 4.93 billion in 2026 and is projected to reach USD 11.39 billion by 2031, advancing at an 18.23% CAGR over the forecast period. Robust fire-safety codes, the spread of above 600 W bifacial photovoltaic (PV) modules, and growing attachment rates for home battery systems have shifted purchasing decisions toward panel-level electronics, allowing the micro inverter market to capture share from string architectures. Vendors are redesigning power stages around silicon-carbide switches to boost efficiency and meet heat-rise limits, while price-conscious installers increasingly choose factory-integrated “AC modules” that combine microinverters with high-wattage panels. Regionally, North America retained top position in 2025, helped by National Electrical Code (NEC) 690.12 rapid-shutdown enforcement and Inflation Reduction Act tax credits, whereas Europe gained momentum through simplified plug-in solar rules that encourage sub-1 kW balcony kits. Commercial customers are increasingly favoring three-phase units above 1 kW as energy-intensive sites seek balanced loading and advanced grid-support functions, a trend that is pushing suppliers to expand their product catalogs and secure long-term semiconductor allocations.
Key Report Takeaways
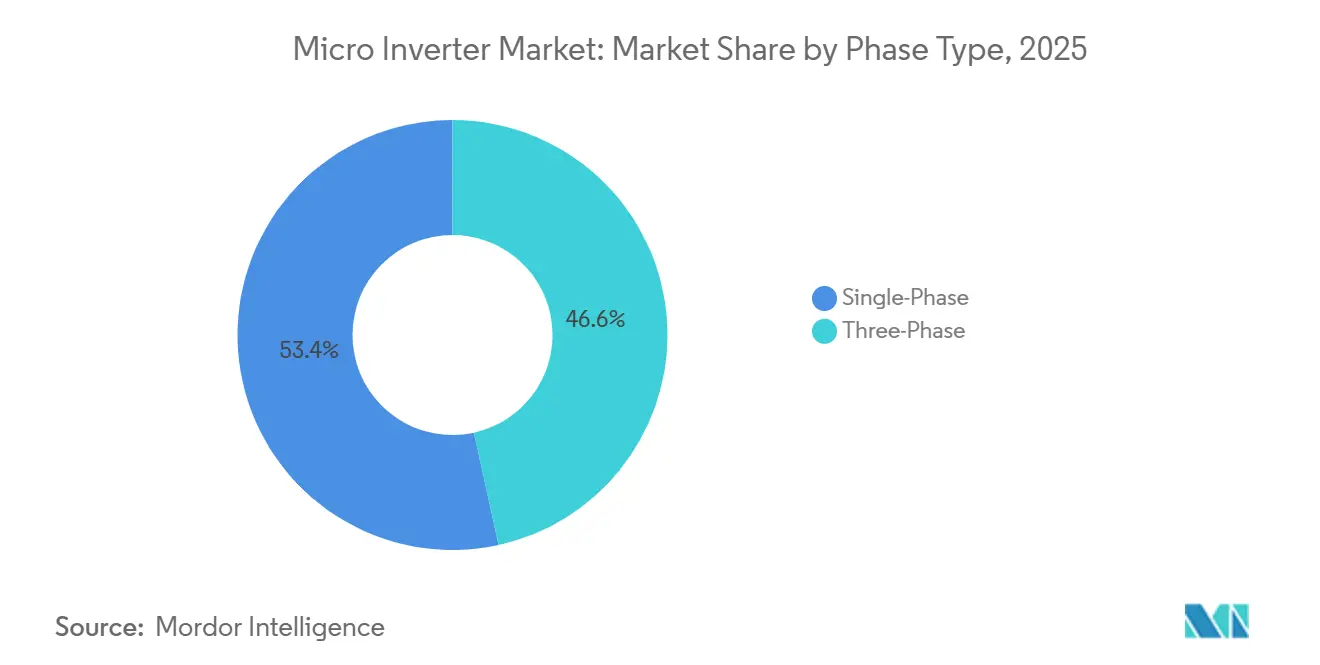
- By phase type, single-phase units led with 53.44% revenue share in 2025, while three-phase models are forecast to clock an 18.77% CAGR to 2031.
- By communication technology, wired solutions held 59.83% of the micro inverter market share in 2025, but wireless protocols are set to expand at an 18.72% CAGR through 2031.
- By component, hardware accounted for 72.37% of the micro inverter market share in 2025, whereas software and services are expected to grow at an 18.61% CAGR during the outlook period.
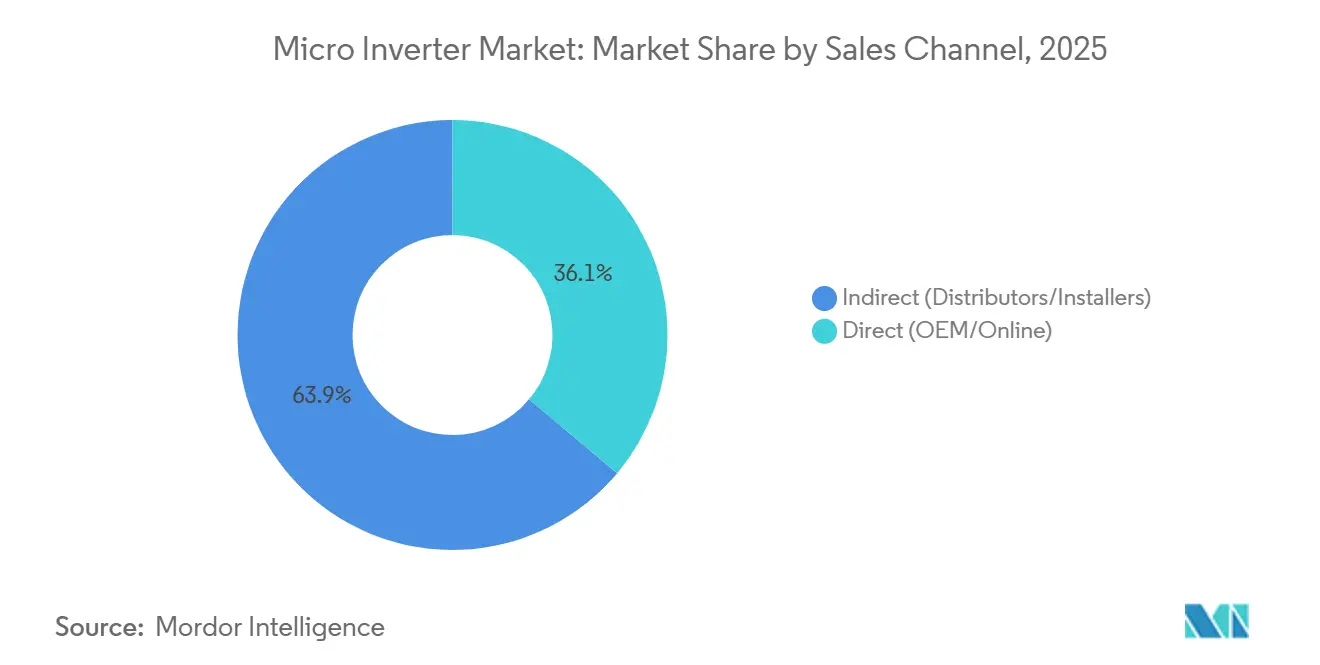
- By sales channel, indirect distributors accounted for 63.89% of transactions in 2025, yet direct routes should post an 18.67% CAGR to 2031.
- By application, residential rooftops accounted for 65.78% of the micro inverter market in 2025, and commercial and industrial sites are poised for an 18.84% CAGR through 2031.
- By geography, North America led with a 36.94% regional share in 2025; Asia-Pacific is expected to record a 19.27% CAGR to 2031.
Note: Market size and forecast figures in this report are generated using Mordor Intelligence’s proprietary estimation framework, updated with the latest available data and insights as of January 2026.
Global Micro Inverter Market Trends and Insights
Drivers Impact Analysis*
| Driver | (~) % Impact on CAGR Forecast | Geographic Relevance | Impact Timeline |
|---|---|---|---|
| NEC 690.12 fire-safety mandates | +3.8% | North America and Europe, early adoption in California, New York, Germany | Short term (≤ 2 years) |
| Above 600 W bifacial modules need per-panel MPPT | +4.2% | Global, concentrated in Asia-Pacific, North America, and Europe | Medium term (2-4 years) |
| Residential storage integration | +3.5% | North America, Europe, Australia, with urban spillover in India and Brazil | Medium term (2-4 years) |
| Balcony solar surge in Germany and Netherlands | +2.1% | Germany, Netherlands, Austria, Switzerland | Short term (≤ 2 years) |
| Utility hosting-capacity grid-support rules | +2.7% | North America, Europe, Australia, pilots in parts of Asia | Long term (≥ 4 years) |
| Plug-in solar standardization DIN VDE V 0126-95 | +1.9% | Europe with outlook for Latin America and Southeast Asia | Short term (≤ 2 years) |
| Source: Mordor Intelligence | |||
NEC 690.12 Fire-Safety Mandates
U.S. jurisdictions that enforce NEC 690.12 require rooftop PV systems to drop conductor voltage to safe levels within 30 seconds of an emergency signal, effectively sidelining legacy string inverters. Microinverters satisfy the rule by default because each panel is isolated at the module level, eliminating extra shutdown boxes and wiring.[1]National Fire Protection Association, “NEC 690.12 Rapid Shutdown Requirements,” nfpa.org European standards such as VDE-AR-N 4105 echo these requirements, pulling Germany and France toward similar architectures. Rapid-shutdown compliance is now a purchase criterion for installers, turning code enforcement into a structural growth lever. Vendors that bundle rule-compliant hardware with digital commissioning tools have carved out a defensible niche, while markets with slower enforcement continue to show lagging penetration.
Proliferation of Above 600 W Bifacial PV Modules
The mainstream shift from 300 W monofacial panels to 600 W and 700 W bifacial modules has introduced pronounced mismatch losses in string-tied arrays. Microinverters mitigate the issue by tracking the maximum power point at each module, recapturing 5-8% of the energy otherwise lost to shade and soiling differentials.[2]National Renewable Energy Laboratory, “Per-Panel Optimization Benefits,” nrel.gov Manufacturers have responded by uprating input current and voltage thresholds; Enphase’s IQ9 handles 640-W modules, enabling installers to pair next-generation panels without derating. As commercial rooftops add skylights and HVAC units, the energy-gain argument intensifies, positioning microinverters as the preferred solution for high-wattage modules through mid-decade.
Integration With Residential Storage Ecosystems
Homeowners in Australia, Germany, and parts of the United States now favor alternating-current-coupled systems that allow batteries to be retrofitted without swapping existing inverters. Microinverters form the backbone of this architecture, seamlessly linking with products such as Enphase IQ Battery and Tesla Powerwall 3.[3]Enphase Energy, “IQ9 Product Specifications,” enphase.com The model lowers installation complexity, cuts truck rolls, and lets households ride out unfavorable net-metering reforms by maximizing self-consumption. Time-of-use tariffs further raise the value of synchronized solar-plus-storage bundles, pushing suppliers toward vertically integrated hardware-software offerings.
Balcony Solar Boom in Germany and the Netherlands
Rule changes in 2024 lifted Germany’s registration-free ceiling for plug-in solar devices to 800 W, removing permit friction for apartment dwellers. Roughly 500,000 balcony kits were shipped in 2025, each integrating 1–2 bifacial panels with a microinverter that feeds a wall outlet. The Netherlands has adopted similar reforms, and Austria and Switzerland are following suit. Sales flow largely through direct-to-consumer web stores, bypassing traditional installer channels and compressing delivery cycles to days rather than weeks. The rise of DIY micro-arrays opens a new consumer tranche but also splinters after-sales responsibilities among retailers, logistics firms, and utility grid operators.
Restraints Impact Analysis*
| Restraint | (~) % Impact on CAGR Forecast | Geographic Relevance | Impact Timeline |
|---|---|---|---|
| Scarcity of Above 1 kW three-phase SKUs | -2.3% | Commercial and industrial sites worldwide, acute in Europe and North America | Medium term (2-4 years) |
| Thermal derating in desert climates | -1.6% | Middle East, North Africa, Southwest United States, Australia | Long term (≥ 4 years) |
| Proprietary communication protocols | -1.4% | Global, affects installers seeking interoperability | Medium term (2-4 years) |
| SiC/GaN chip supply constraints | -2.9% | Global, bottlenecks in Asia-Pacific fabs | Short term (≤ 2 years) |
| Source: Mordor Intelligence | |||
Scarcity of Above 1 kW Three-Phase Units
Commercial rooftops run on 208 V or 480 V three-phase circuits, yet most catalogs still top out at sub-500 W single-phase models. APsystems released a 1.8 kW three-phase micro inverter in 2024, but production was limited, and rivals prioritized higher-margin string products. The shortage forces installers either to oversubscribe circuits or to revert to string architectures, slowing micro-inverter penetration above 100 kW system sizes. Technical hurdles, complex gate drivers, larger filter banks, and higher-voltage silicon inflate bill-of-material costs by roughly 30%, postponing economies of scale until new fabs alleviate component shortages.
SiC/GaN Semiconductor Bottlenecks
Silicon-carbide and gallium-nitride chips elevate switching frequency and efficiency but remain capacity-constrained at Wolfspeed, STMicroelectronics, and Infineon fabs. Lead times stretched to 18 months in 2025, lifting unit costs by USD 15-25 and trimming Enphase’s gross margin by 200 basis points. Vendors either redesign products around legacy silicon IGBTs or sign expensive long-term supply agreements that lock in wafer volume. New 200 mm SiC fabs slated for 2027 promise relief, but smaller competitors may struggle to secure allocations, tilting market dynamics toward incumbents with scale.
*Our forecasts treat driver/restraint impacts as directional, not additive. The impact forecasts reflect baseline growth, mix effects, and variable interactions.
Segment Analysis
By Phase Type: Commercial Demand Fuels Three-Phase Upswing
Single-phase devices continued to capture the bulk of residential demand in 2025, accounting for 53.44% of the micro inverter market share. The segment’s installed base benefits from plug-and-play wiring, straightforward permitting, and mature supply chains across North America and Europe. Yet three-phase units are poised for an 18.77% CAGR through 2031, raising their share of the micro inverter market as big-box retail, warehouse, and light-industrial rooftops chase higher energy densities. Projects above 100 kW laud the architecture for balanced loading across 208 V and 400 V networks, mitigating neutral currents and improving voltage regulation.
Commercial installers also cite grid-support mandates in Australia and California that favor distributed reactive-power injection, a function that three-phase microinverters implement more granularly than centralized designs. Still, product scarcity and a 20-30% price premium temper adoption, leaving some EPC firms to hybridize arrays with string inverters on non-shaded facets while reserving microinverters for complex skylight zones. Suppliers that can scale silicon-carbide power stages and qualify >1 kW SKUs are likely to capture pent-up demand over the next two years.


By Communication Technology: Wireless Cuts Retrofit Labor
Wired data platforms secured a 59.83% share in 2025, favored for their immunity to radio interference and compliance with cyber-hardening guidelines in critical-infrastructure settings. However, wireless links such as Zigbee, Wi-Fi, and sub-GHz mesh are forecast to grow at an 18.72% CAGR through 2031, carving out a rising share of the micro inverter market. Retrofit crews report up to 20% lower installation hours when conduit runs are eliminated, especially on Spanish-tile roofs where retrofits are labor-intensive.
Enphase’s Envoy-S gateway aggregates hundreds of inverters over a 2.4 GHz mesh, bypassing homeowner routers and pushing encrypted data directly to cloud servers. Cellular backhaul is gaining favor in rural Australia and India, where broadband access is erratic. Nonetheless, RF congestion and jamming risks persist near heavy industrial equipment, nudging large commercial projects toward hybrid topologies that combine power-line carrier for core monitoring and wireless for ancillary modules.
By Component: Software and Services Monetize Data Streams
Hardware revenues accounted for 72.37% of 2025 turnover, yet software and services are on track for an 18.61% CAGR, signaling a strategic pivot toward recurring income. Subscription-based platforms such as Enphase Enlighten deliver module-level analytics, automated alerts, and fleet benchmarking, generating USD 47 million in 2025, up 28% year over year. As predictive maintenance algorithms mature, asset managers can pre-empt faults, prolong warranty life, and qualify for virtual power-plant aggregation payments.
Hardware innovation remains important, with silicon-carbide switches, conformal coatings, and grid-forming firmware differentiating premium SKUs, but commoditization pressures margins.
By Sales Channel: Vertical Integration Expands Direct Sales
Indirect distributors handled 63.89% of transactions in 2025, leveraging credit terms, local warehousing, and technical field support. Yet direct web stores and OEM portals are projected to grow at an 18.67% CAGR, as vertical integrators like Enphase package microinverters with storage and EV chargers, capturing end-to-end margins. The balcony solar boom is accelerating direct-to-consumer logistics, with urban renters in Berlin and Amsterdam ordering kits online and self-installing within days.
Distributors still anchor large commercial projects where design assistance, rebate processing, and on-site troubleshooting remain indispensable. Nevertheless, digital procurement platforms such as EnergySage have eroded price opacity, pressing wholesalers to pivot toward value-added logistics and financing services. Winning vendors will blend omnichannel exposure, using e-commerce to serve small orders while nurturing distributor networks for megawatt-scale deployments.
By Application: Commercial Rooftops Close the Gap
Residential rooftops accounted for 65.78% of 2025 deployments, buoyed by tariff structures that reward self-generation and state-level incentive stacks. California’s NEM 3.0 decision, which slashed export credit, spurred homeowners to store rather than sell excess generation, a scenario that favors alternating-current-coupled micro inverter architectures. Commercial and industrial sites, however, are forecast to notch an 18.84% CAGR, narrowing the gap as corporate power purchase agreements and sustainability pledges proliferate.
Microinverters offer facility managers granular module-level monitoring, simplifying maintenance contracts and enabling rooftop leases that bill tenants by energy slice. Although utility-scale PV still relies on string inverters for cost efficiency, microinverters now address niche ground-mount parcels with uneven topography or partial shading. Community solar operators also exploit per-panel data to allocate generation among subscribers, broadening the technology’s addressable base.
Geography Analysis
North America retained a 36.94% micro inverter market share in 2025, propelled by NEC's rapid-shutdown rules and federal tax incentives that shorten payback periods for solar-plus-storage retrofits. California, New York, and Massachusetts led installations, while Canadian provinces such as Ontario explored community solar pilots using panel-level electronics for tenant billing. Enphase commanded roughly 75% of North American revenues, benefiting from brand recognition and a direct-sales model that bundles hardware, monitoring, and batteries.
Asia-Pacific is poised for a 19.27% CAGR through 2031, eclipsing other regions as China, India, and Australia press ahead with distributed-solar policies. China’s dual-carbon pledge and provincial subsidies accelerated urban rooftop programs, letting domestic makers like Hoymiles and Envertech underprice imports and capture local content credits. India targets 40 GW of rooftop solar capacity by 2026, relying on microinverters to mitigate shading in densely packed cities. Australia’s stringent AS/NZS 4777.2 grid code requires voltage-ride-through and reactive-power support, features native to modern micro inverters, sustaining premium adoption rates.
Europe continues steady growth on the back of Germany’s balcony-solar phenomenon, France’s energy-transition roadmap, and the United Kingdom’s smart export guarantee. Germany surpassed 500,000 plug-in kits in 2025, each equipped with embedded microinverters. Southern markets such as Spain and Italy saw slower uptake due to generous feed-in tariffs that still favor cheaper string solutions, yet revised rules targeting self-consumption are expected to narrow the gap. The Middle East and Africa remain nascent, hindered by thermal derating and weaker residential economies, though pilot projects in the United Arab Emirates and South Africa signal emerging interest. South America’s momentum centers on Brazil, where net-metering reforms catalyze rooftop adoption despite currency volatility.


Competitive Landscape
Enphase Energy continued to dominate the microinverter market in 2025, capturing between 70% and 75% of global revenue on the strength of its vertically integrated hardware-software platform and early-mover patent portfolio. APsystems and Hoymiles followed as cost-competitive challengers, each expanding their three-phase product catalogs to court commercial installers that require units above 1 kW for balanced 208 V and 400 V circuits. SolarEdge, historically a string-inverter specialist, accelerated its pivot when it purchased Italian manufacturer AEconversion for EUR 65 million (USD 73 million) in October 2025, instantly adding three-phase microinverters and expanding its European distribution reach. Together, the five largest suppliers accounted for slightly more than 80% of 2025 global revenue, leaving a long tail of niche players focused on regional retrofit or off-grid opportunities. High concentration gives incumbents negotiating leverage with semiconductor foundries, shipping partners, and utilities certifying advanced grid-support functions.
Challengers are differentiating through strategic moves that cut both cost and installation time. APsystems signed a September 2025 partnership with Trina Solar to roll out factory-integrated “AC modules” that pair 600 W bifacial panels with 2 kW three-phase microinverters, trimming labor costs by an estimated 30% for European warehouse projects. Hoymiles launched its HMS-2000 series in November 2025, delivering integrated rapid-shutdown and IEEE 1547-2018 compliance on a 15-year-warrantied platform designed for North American commercial rooftops. Darfon Electronics, meanwhile, secured a USD 80 million supply contract for a 50 MW Japanese corporate portfolio in July 2025, leveraging its ruggedized three-phase units and Tokyo Electric Power Company’s virtual power plant interface. These moves underscore a tactical shift toward higher-power SKUs and bundled services that address installer pain points such as conduit runs, grid-code paperwork, and fleet monitoring.
Competitive dynamics are also shaped by upstream chip supply and ongoing intellectual property disputes. Silicon-carbide shortages inflated bill-of-material costs by USD 15-25 per unit in 2025, prompting Enphase and SolarEdge to sign multi-year wafer agreements with Wolfspeed and STMicroelectronics while smaller firms redesigned boards around legacy silicon switches. Patent litigation between Enphase and SolarEdge over power-optimizer communications remains active at the U.S. Patent and Trademark Office, injecting legal risk for new entrants and channel partners. To offset supply shocks and legal headwinds, vendors are layering subscription-based monitoring, extended warranties, and virtual power plant aggregation into their value propositions, tilting revenue toward higher-margin software and services. Companies that lock in semiconductor supply, attain IEEE 1547-2018 certification, and bundle turnkey solar-plus-storage solutions are best positioned to consolidate share as the market matures.
Micro Inverter Industry Leaders
Enphase Energy Inc.
Altenergy Power Systems
ABB Ltd.
Darfon Electronics Corp.
Siemens AG
- *Disclaimer: Major Players sorted in no particular order

Recent Industry Developments
- December 2025: Enphase Energy announced a USD 150 million expansion of its West Bengal factory, targeting 4 million units annual capacity by late 2026.
- November 2025: Hoymiles launched the HMS-2000 three-phase 2 kW series for commercial rooftops in Europe and North America.
- October 2025: SolarEdge completed the EUR 65 million acquisition of AEconversion, gaining three-phase expertise and European channels.
- September 2025: APsystems and Trina Solar unveiled factory-integrated AC-module lines pairing 600 W bifacial panels with micro inverters.


Research Methodology Framework and Report Scope
Market Definitions and Key Coverage
According to Mordor Intelligence, we treat the micro-inverter market as all revenue that equipment makers earn from purpose-built, panel-level devices that convert the direct current of a single photovoltaic module into grid-synchronous alternating current and ship with embedded or gateway-based monitoring. Reported value reflects first commercial sale to distributors, installers, or end users and is expressed in constant 2024 U.S. dollars.
Scope exclusion: The study leaves out string, central, hybrid, and optimizer-only inverters, as well as revenue from installation labor, extended warranties, or third-party monitoring platforms.
Segmentation Overview
- By Phase Type
- Single-Phase
- Three-Phase
- By Communication Technology
- Wired
- Wireless
- By Component
- Hardware
- Software and Services
- By Sales Channel
- Direct (OEM/Online)
- Indirect (Distributors/Installers)
- By Application
- Residential Rooftop
- Commercial and Industrial Rooftop
- PV Power Plant / Utility-Scale
- By Geography
- North America
- United States
- Canada
- Mexico
- Europe
- Germany
- United Kingdom
- France
- Italy
- Rest of Europe
- Asia-Pacific
- China
- Japan
- India
- South Korea
- Australia
- Rest of Asia-Pacific
- Middle East and Africa
- Middle East
- Saudi Arabia
- United Arab Emirates
- Rest of Middle East
- Africa
- South Africa
- Egypt
- Rest of Africa
- Middle East
- South America
- Brazil
- Argentina
- Rest of South America
- North America
Detailed Research Methodology and Data Validation
Primary Research
We spoke with inverter designers, rooftop installers, electrical inspectors, and component suppliers across North America, Europe, and Asia-Pacific. These conversations verified typical selling prices, regional code adoption speeds, and the share of new rooftop systems opting for module-level power electronics, which helped us fine-tune penetration assumptions.
Desk Research
Our analysts canvassed open-source energy statistics from the International Energy Agency, U.S. Energy Information Administration, and Eurostat; cross-checked shipment records from Harmonized Tariff Schedule codes on Volza; and reviewed peer-reviewed work logged in IEEE Xplore. Company financials and channel commentary were retrieved through D&B Hoovers, while Dow Jones Factiva supplied press and tender updates that confirmed contract volumes. Trade association white papers from SolarPower Europe and the National Renewable Energy Laboratory added policy timelines and technology cost curves.
These sources illustrate rather than exhaust the references consulted; many additional datasets and industry notes fed the evidence base.
Market-Sizing & Forecasting
A top-down model converts national residential PV additions (MW) into addressable micro-inverter volume through penetration ratios that vary by roof pitch, shading index, and safety-code enforcement, which are then priced using blended ASPs gathered from distributor quotes. Select bottom-up checks, supplier revenue roll-ups, and sampled installer invoices align totals. Key variables include cumulative installed PV capacity, average panel wattage, NEC 690.12 adoption timelines, quarterly ASP erosion, and sales-channel mix. Multivariate regression applies these drivers to project demand through 2030, while scenario analysis tests policy and price shocks. Gaps in bottom-up data are bridged with region-weighted averages agreed upon during primary interviews.
Data Validation & Update Cycle
Outputs pass variance checks against independent shipment trackers before an analyst peer review signs off. Models refresh every twelve months, with interim revisions triggered by material events such as tariff shifts or major code updates, ensuring buyers always receive the latest snapshot.
Why Our Micro Inverter Baseline Commands Reliability
Published numbers often diverge because firms use different product baskets, pricing ladders, and forecast cadences. Our disciplined scope, annual refresh, and dual-lens validation keep the baseline steady, yet responsive.
Key gap drivers arise when others blend hybrid or optimizer units with micro-inverters, inflate values by import duties, or restrict coverage to mature regions only; differences our model avoids.
Benchmark comparison
| Market Size | Anonymized source | Primary gap driver |
|---|---|---|
| USD 4.17 bn | Mordor Intelligence | - |
| USD 5.78 bn | Global Consultancy A | Includes hybrid & optimizer products |
| USD 6.04 bn | Industry Analytics Firm B | Uses supplier ASP plus landed-cost uplift |
| USD 4.11 bn | Independent Research Org C | Excludes Asia-Pacific & LatAm demand |
The comparison shows that while figures vary, Mordor's carefully bounded definition and regularly vetted variables give decision-makers a dependable midpoint they can trace back to transparent, repeatable steps.


Key Questions Answered in the Report
How large is the micro inverter market in 2026?
The micro inverter market size reached USD 4.93 billion in 2026.
What CAGR is forecast for micro inverters through 2031?
The market is expected to grow at an 18.23% CAGR between 2026 and 2031.
Which region is growing fastest for micro inverters?
Asia-Pacific is projected to post the fastest CAGR at 19.27% through 2031.
Why are three-phase micro inverters gaining attention?
Commercial rooftops above 100 kW require balanced three-phase loading, driving 18.77% annual growth for such units.
How do fire-safety codes influence adoption?
NEC 690.12 rapid-shutdown rules mandate module-level isolation, prompting installers to favor micro inverters that comply by design.
Which company leads the competitive landscape?
Enphase Energy held roughly 70–75% global share in 2025, owing to its vertically integrated platform and extensive patent portfolio.
Page last updated on:


