Microgrid Market Size and Share
Market Overview
| Study Period | 2021 - 2031 |
|---|---|
| Market Size (2026) | USD 24.44 Billion |
| Market Size (2031) | USD 54.99 Billion |
| Growth Rate (2026 - 2031) | 17.61% CAGR |
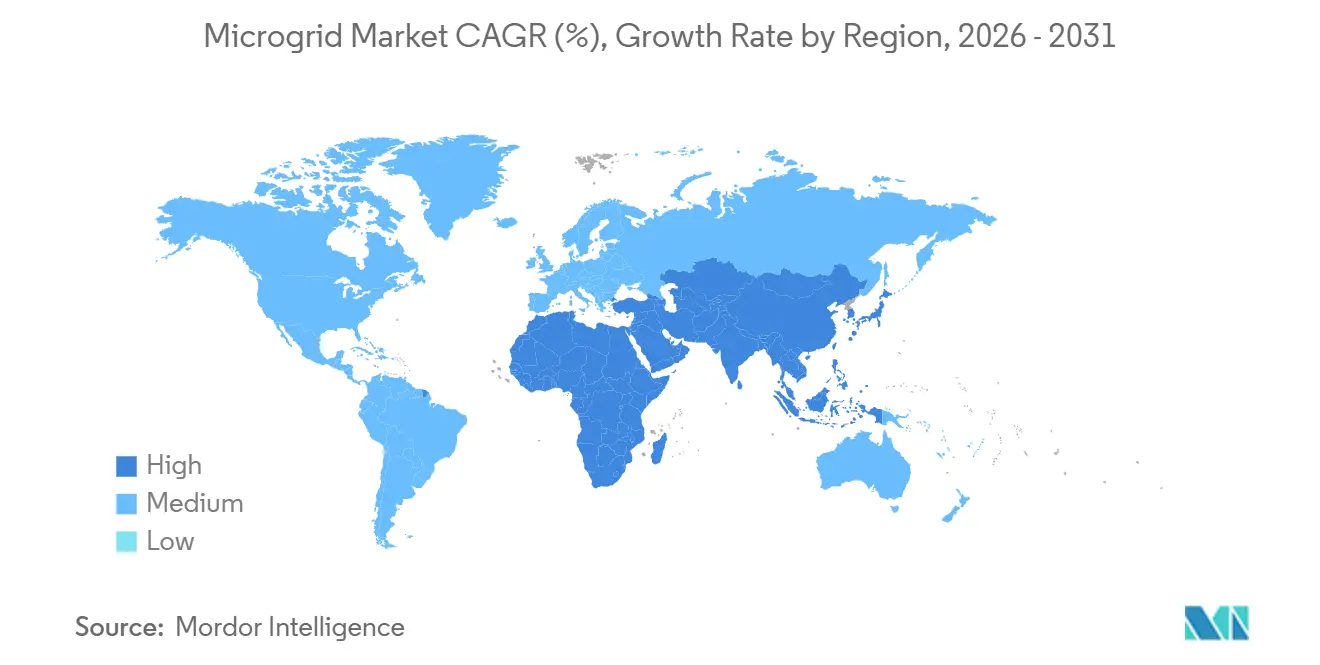
| Fastest Growing Market | Asia Pacific |
| Largest Market | North America |
| Market Concentration | Medium |
Major Players
*Disclaimer: Major Players sorted in no particular order Image © Mordor Intelligence. Reuse requires attribution under CC BY 4.0. |
|
Microgrid Market Analysis by Mordor Intelligence
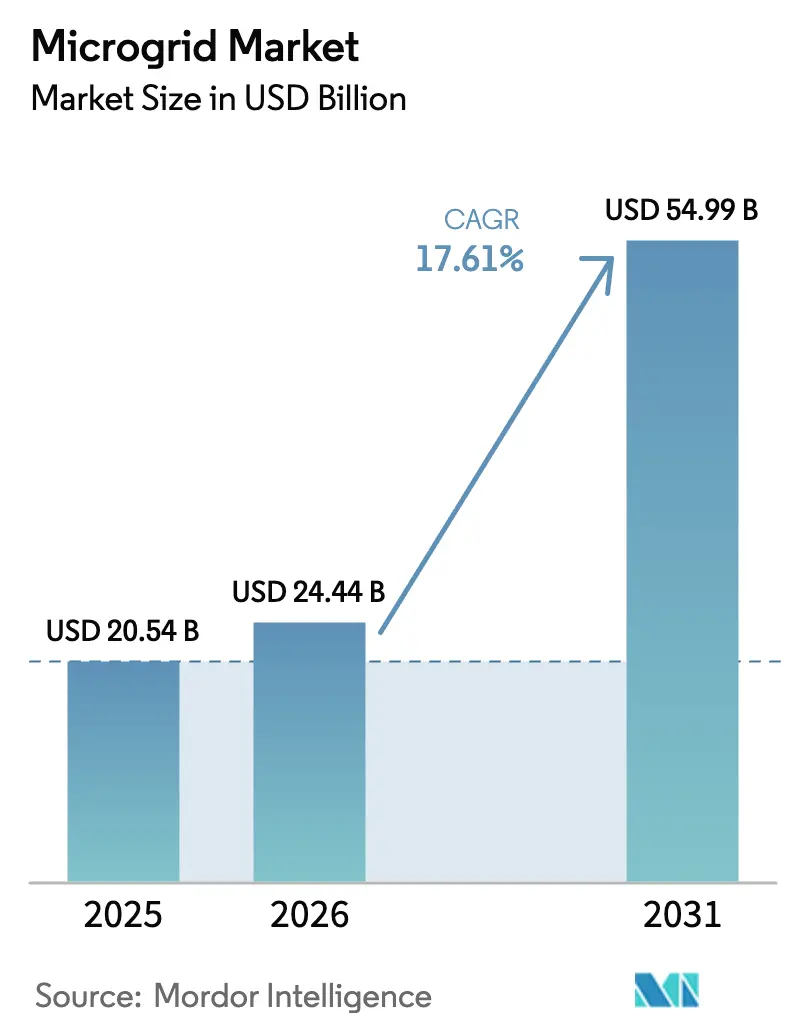
The Microgrid Market size is expected to grow from USD 20.54 billion in 2025 to USD 24.44 billion in 2026 and is forecast to reach USD 54.99 billion by 2031 at 17.61% CAGR over 2026-2031.
Behind that growth are falling inverter and battery costs, grid-forming technology that lets renewable penetration exceed 90%, and policy mandates that now tie resilience directly to regulated returns. Utility pilots are scaling into full feeder-level projects, military bases are racing toward net-zero targets, and software has become the margin engine even as hardware commoditizes. Growing wildfire liabilities in the western United States, diesel logistics in island nations, and the need for black-start capability at data centers all reinforce the business case for distributed, self-sufficient power systems. Together, these forces continue to shift project finance away from grant-driven pilots toward structured, performance-based contracts.
Key Report Takeaways
- By connectivity, grid-connected systems held 62.3% of the microgrid market share in 2025, while off-grid deployments are projected to grow at an 18.9% CAGR through 2031.
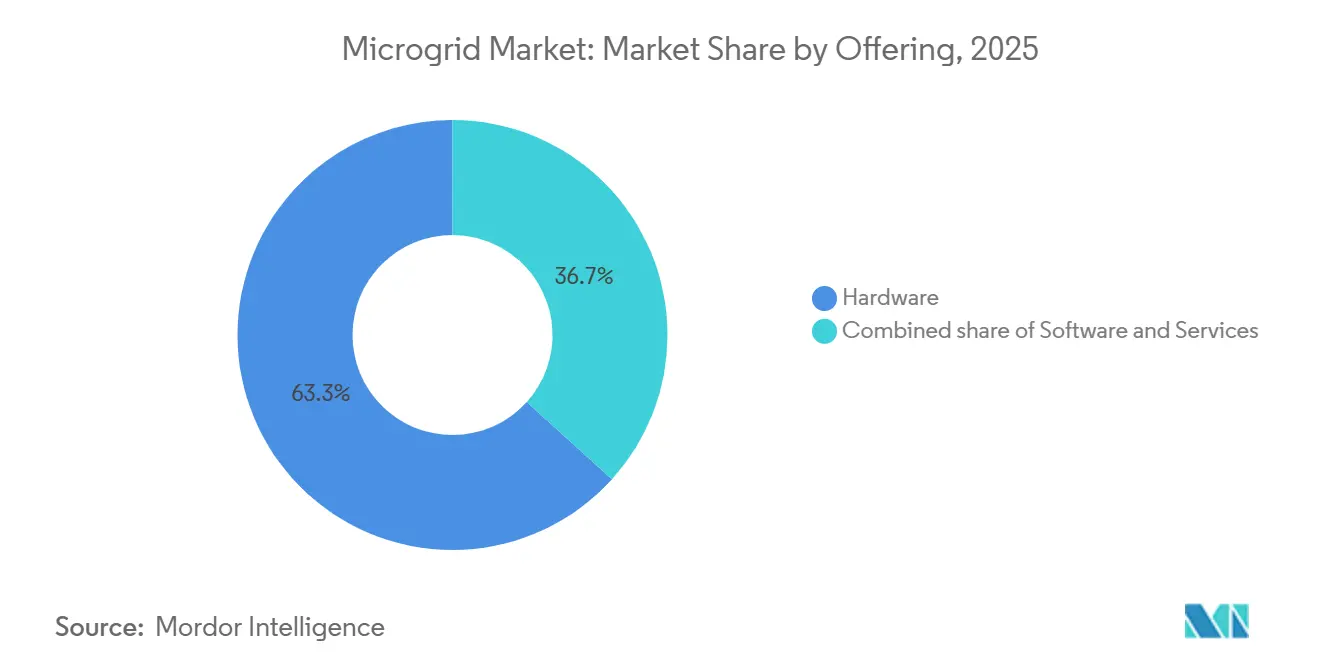
- By offering, hardware commanded 63.3% of revenue in 2025 in the microgrid market; software platforms are expected to expand at a 22.3% CAGR to 2031.
- By power source, solar photovoltaic arrays accounted for 37.9% of the microgrid market size in 2025 and are forecast to grow at an 18.5% CAGR to 2031.
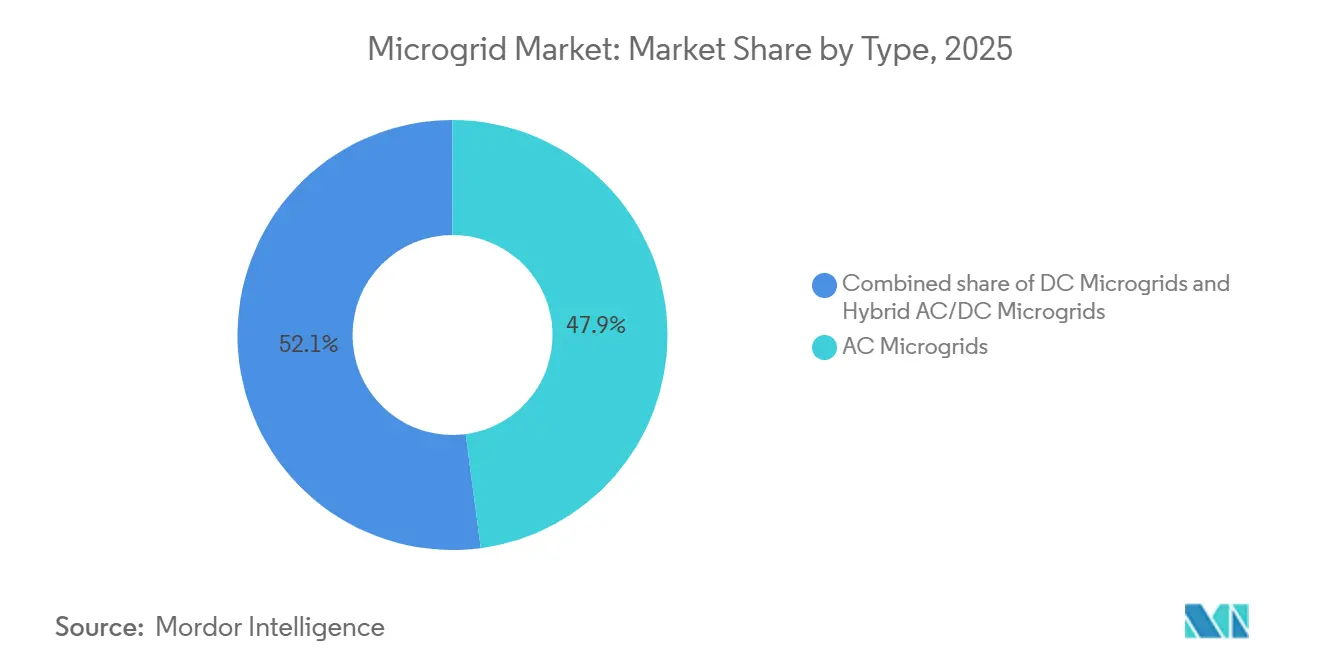
- By type, AC microgrids represented 47.9% of installations in 2025 in the microgrid market, while hybrid AC/DC microgrids are set to increase at a 19.2% CAGR through 2031.
- By power rating, the 1–5 MW band captured 42.7% of 2025 deployments , while the 5–10 MW tier is anticipated to rise at a 20.1% CAGR by 2031, within the microgrid market landscape.
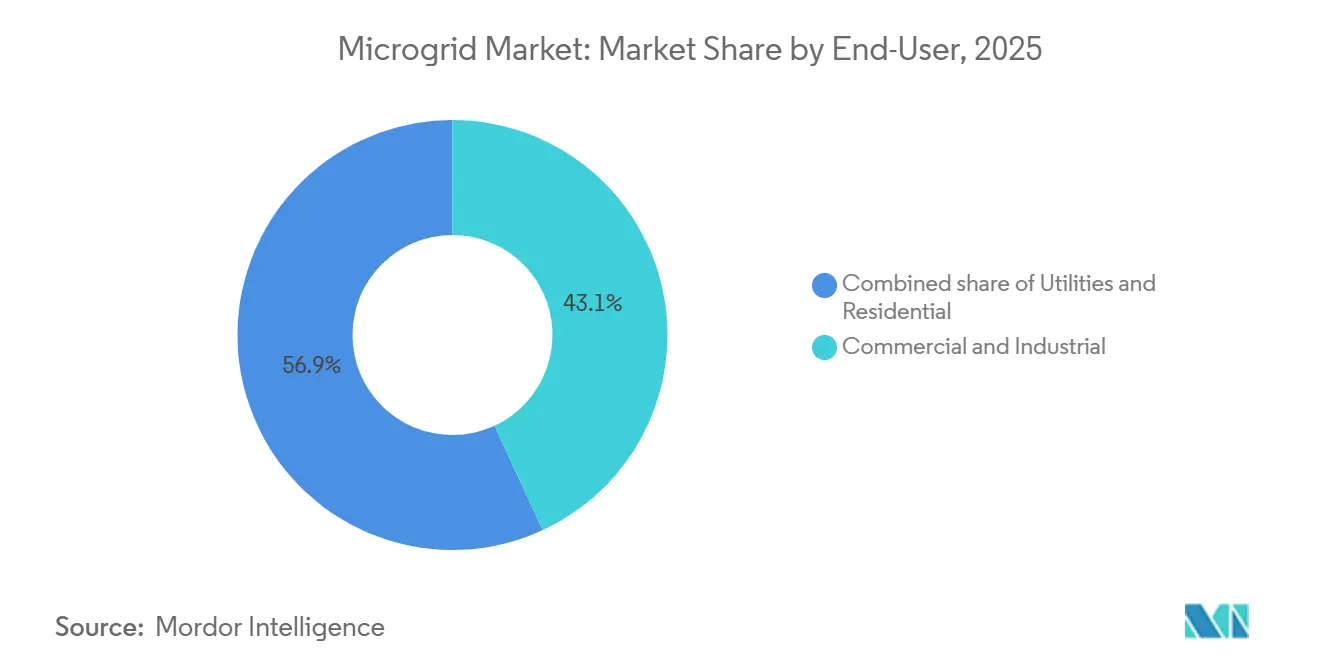
- By end-user, commercial and industrial customers led with 43.1% of demand in 2025; utility deployments in the microgrid market are projected to climb at a 21.0% CAGR to 2031.
- By geography, North America retained 38.6% revenue share in 2025; Asia-Pacific in the microgrid market is poised for a 23.7% CAGR, the highest worldwide.
Note: Market size and forecast figures in this report are generated using Mordor Intelligence’s proprietary estimation framework, updated with the latest available data and insights as of January 2026.
Global Microgrid Market Trends and Insights
Drivers Impact Analysis*
| Driver | (~) % Impact on CAGR Forecast | Geographic Relevance | Impact Timeline |
|---|---|---|---|
| Accelerated Rural Electrification in Africa & South Asia | 3.2% | Sub-Saharan Africa, India, Bangladesh, ASEAN spill-over | Medium term (2-4 years) |
| IT/OT Convergence Spurs Advanced Microgrid Controllers in North America | 2.8% | North America & EU, early adoption in Australia | Short term (≤ 2 years) |
| Modular "Box" Microgrids for Disaster-Recovery in Caribbean Islands | 1.4% | Caribbean, Pacific Islands, coastal Latin America | Short term (≤ 2 years) |
| Utility-led Community Resilience Programs in U.S. & Australia | 3.5% | United States (California, Texas, Florida), Australia (NSW, Victoria) | Medium term (2-4 years) |
| Grid-Forming Inverters Enabling 90%+ Renewables in Nordic Markets | 2.9% | Nordic Countries, Germany, United Kingdom, spill-over to APAC | Long term (≥ 4 years) |
| Defense-Funded Net-Zero Bases Driving Hybrid Microgrids (NATO & INDOPACOM) | 2.1% | United States, NATO Europe, Japan, South Korea, Guam | Medium term (2-4 years) |
| Source: Mordor Intelligence | |||
Accelerated Rural Electrification in Africa & South Asia
World Bank data show 8,700 mini-grids serving 4.1 million people were installed in 34 African nations between 2020 and 2024, yet 600 million residents still lack reliable electricity; this unmet demand represents a USD 42 billion investment gap through 2030 in the microgrid market.[1] The International Finance Corporation mobilized USD 500 million of blended finance between 2024 and 2025, cutting developer capital costs in Nigeria and Kenya by six percentage points. India’s Ministry of New and Renewable Energy budgeted INR 34.4 billion (USD 413 million) for 2024-2025 to solarize 200,000 agricultural pumps, displacing 1.2 billion liters of diesel annually. Bangladesh’s Infrastructure Development Company Limited funded 1,850 additional solar mini-grids in 2024, while the Asian Development Bank committed USD 1.1 billion in 2025 to hybrid systems across South and Southeast Asia. Together, these initiatives narrow the cost of capital and shorten build cycles for off-grid microgrids that substitute costly diesel fuel.
IT/OT Convergence Spurs Advanced Microgrid Controllers in North America
The National Electrical Manufacturers Association published the US 80056-2024 standard, creating a common data model for bidirectional exchange between operational technology devices and enterprise IT systems supporting the microgrid market.[2]National Electrical Manufacturers Association, “US 80056-2024 Standard,” nema.org As a result, microgrid controllers now integrate weather forecasts, wholesale price signals, and building-management inputs to optimize dispatch every 15 minutes. Schneider Electric’s EcoStruxure Microgrid Advisor cut peak-demand charges by 23% across 47 U.S. sites by mid-2025, while ABB’s Ability Energy Manager links directly with enterprise resource-planning suites to automate demand-response bids in PJM’s capacity market. Cybersecurity, however, remains uneven: a 2024 National Institute of Standards and Technology audit found unified authentication missing in 62% of surveyed projects. Standardization accelerates controller roll-outs yet raises the bar for compliance.
Modular “Box” Microgrids for Disaster-Recovery in Caribbean Islands
Containerized solar-plus-storage systems that can be air-lifted and commissioned within 72 hours have become the default resilience play in hurricane-prone regions in the microgrid market. BoxPower installed 14 such units across Puerto Rico during 2024-2025, each rated at 50 kW with 200 kWh of storage, achieving 98% uptime during Tropical Storm Ernesto. Oak Ridge National Laboratory networked 12 rooftop arrays and three battery banks into a 1.2 MW community microgrid that remained online through the same event. The U.S. Federal Emergency Management Agency directed USD 428 million of Hazard Mitigation Grant funds toward islanded energy projects in 2024, recognizing that delivered diesel costs USD 1.20–1.80 per liter and often arrives days late during crises.
Utility-led Community Resilience Programs in U.S. & Australia
California’s Self-Generation Incentive Program disbursed USD 1.8 billion from 2021 to 2025, with 43% earmarked for disadvantaged communities; average project size rose from 3.2 MW to 6.7 MW in that interval within the microgrid market. Pacific Gas & Electric’s Microgrid Incentive Program offers USD 200 per kW for systems serving critical facilities, targeting 500 MW of new capacity by 2027. Australia mirrors the trend: New South Wales funded 11 community battery projects totaling 47 MWh in 2024-2025, while Victoria allocated AUD 88.5 million for 100 neighborhood batteries in fire-prone zones. These programs position utilities as resilience providers and open new regulated-return pathways.
Restraints Impact Analysis*
| Restraint | (~) % Impact on CAGR Forecast | Geographic Relevance | Impact Timeline |
|---|---|---|---|
| Fragmented Codes Stalling Interconnection Approvals in U.S. States | -1.8% | United States (state-level variation), early signs in Canada | Short term (≤ 2 years) |
| Subsidy Claw-Back Risk in India's PM-KUSUM Programme | -1.2% | India (national), spill-over to South Asia | Medium term (2-4 years) |
| Lithium-ion Price Volatility Disrupting CAPEX Planning 2024-25 | -1.5% | Global, acute in North America & EU | Short term (≤ 2 years) |
| Limited Cyber-security Standards for Multi-Vendor Projects | -0.9% | Global, concentrated in North America & EU | Medium term (2-4 years) |
| Source: Mordor Intelligence | |||
Fragmented Codes Stalling Inter-connection Approvals in U.S. States
FERC Order 2023 streamlined generator queues, yet state-level processes still diverge in the microgrid market: California’s cluster studies cut median approval time to 18 months in 2024, while Texas’s serial study left 142 GW waiting.[3]Federal Energy Regulatory Commission, “Order 2023 Generator Interconnection Reform,” ferc.gov New York now insists that microgrids above 5 MW provide synthetic inertia, delaying 23 projects totaling 87 MW. Florida imposed a one-year moratorium on new applications in August 2024, freezing USD 1.2 billion of planned investment. Until state codes align, developers will hedge by favoring behind-the-meter systems or markets with clearer rules.
Subsidy Claw-Back Risk in India’s PM-KUSUM Programme
The Ministry of New and Renewable Energy recovered INR 2.8 billion from under-performing projects in 2024, enforcing a rule that generation must reach 85% of forecast output within 12 months in the microgrid market.[4]Ministry of New and Renewable Energy, “PM-KUSUM Scheme Guidelines,” mnre.gov.in Delisted inverter brands raised replacement costs, while Rajasthan and Uttar Pradesh stretched subsidy timelines from 90 days to 210 days. Asian Development Bank analysis shows the resulting uncertainty lifted the average cost of capital by 120 basis points in 2025, eroding returns for equity investors.
*Our forecasts treat driver/restraint impacts as directional, not additive. The impact forecasts reflect baseline growth, mix effects, and variable interactions.
Segment Analysis
By Connectivity: Grid Resilience Drives Dual-Mode Adoption
Grid-connected configurations held 62.3% of 2025 deployments, providing utilities with non-wire alternatives to costly transmission upgrades while offering ancillary-service revenue across the microgrid market. Off-grid systems remain the lifeline for 733 million people without reliable electricity, largely in sub-Saharan Africa and South Asia. Off-grid assets deliver higher internal rates of return where diesel costs exceed USD 1.40 per liter and transmission tariffs approach USD 0.04 per kWh. For grid-tied projects, capacity-market participation, for example, PJM’s USD 269.92 per MW-day clearing price, adds an extra income stream that lifts payback.
Hybrid connectivity now sits between the two models in the microgrid market. Puerto Rico mandates automatic transfer switching for microgrids above 5 MW, while California’s updated Rule 21 requires smart inverters that ride through voltage and frequency disturbances. Satellite backhaul, often via Starlink, is lowering maintenance costs by enabling remote diagnostics at hundreds of African sites. Across all geographies, islanding capability is shifting from an optional feature to a project requirement.
By Offering: Software Gains Margin as Hardware Commoditizes
Hardware still represented 63.3% of microgrid market revenue in 2025, yet lithium-ion batteries and PV modules both keep falling in price, compressing integrator margins. Software, by contrast, now earns 25% to 35% gross margins and is projected to expand at a 22.3% CAGR. Machine-learning dispatch can lift revenue by optimizing charge-discharge cycles against 15-minute wholesale prices and demand-charge windows. As-a-service contracts have emerged: Engie retains asset ownership and sells power below the grid tariff, lowering customer capex. Performance-based operations agreements with availability guarantees above 98% are now standard on public-sector procurements.


By Power Source: Solar Outpaces but Hybrid Strategies Prevail
Solar PV held 37.9% of installed capacity in 2025 thanks to module prices below USD 0.18 per watt and enduring tax credits. Combined heat and power remains crucial for sites with thermal loads, while diesel generators offer indispensable black-start and peak-shaving support in off-grid environments. Fuel cells, led by solid-oxide designs, are the fastest-growing niche, particularly for data centers that require five-nines uptime. Most new builds adopt hybrid combinations, solar paired with storage or diesel, balancing capital costs with dispatchability and resilience.
By Type: Hybrid AC/DC Architectures Serve Emerging DC Loads
AC microgrids accounted for 47.9% of 2025 installations, rooted in legacy building wiring and utility practices within the broader microgrid market landscape. Hybrid AC/DC systems, however, are growing 19.2% annually because data centers and EV fast-charging hubs prefer native DC coupling that eliminates inverter losses. IEEE 2030.10 recommends 380 V DC for commercial applications and 48 V DC for residential. Military installations and telecom towers have also migrated to hybrid topologies to integrate solar, batteries, and legacy diesel while maintaining compatibility with existing distribution gear.
By Power Rating: Community-Scale Projects Accelerate
Systems rated 1 MW to 5 MW captured 42.7% of 2025 projects, aligning with the needs of hospitals, campuses, and light-industrial parks. The 5 MW to 10 MW band, however, shows the fastest growth at 20.1% CAGR as utilities aggregate critical loads across multiple facilities. Modular component design allows phased expansion, while lower battery prices have reduced the break-even threshold for utility-scale storage. Above 10 MW, longer interconnection queues remain a barrier, but economies of scale improve capital efficiency for developers willing to navigate transmission-level studies.
By End-User: Utilities Move From Pilot to Portfolio
Commercial and industrial facilities drove 43.1% of 2025 demand in the microgrid market, mainly to secure uptime and avoid demand charges. Utilities now view microgrids as regulated assets that defer costly infrastructure and mitigate wildfire risk, propelling their 21.0% forecast CAGR. Residential uptake stays modest, though virtual power-plant aggregations, such as Tesla’s 4,000-unit California fleet, hint at future scale. Hospitals must now guarantee 96-hour backup under revised Joint Commission rules, accelerating microgrid adoption in healthcare.
Geography Analysis
North America held 38.6% of installations in 2025, supported by a USD 1.8 billion incentive outlay in California and Department of Defense mandates for net-zero bases. Canada financed 18 Indigenous-led microgrids between 2024 and 2025, and Mexico’s reopened distributed-generation market sparked 67 MW of industrial projects. State-level code fragmentation remains the leading bottleneck south of the border.
Asia-Pacific is the fastest-growing region at a 23.7% CAGR through 2031. India’s PM-KUSUM solarizes agricultural pumps at scale, Japan enforces post-Fukushima resilience standards, and China’s 14th Five-Year Plan targets 50 GW of distributed solar in frontier provinces. Southeast Asian islands substitute costly diesel imports with solar-battery systems, while Australia’s neighborhood battery initiatives marry wildfire mitigation with community storage.
Europe, with 22% market share in 2025, pioneers grid-forming technology: Finland’s 90 MW battery provides synthetic inertia, and Sweden has awarded a 200 MW project. Incentives in the United Kingdom and Spain accelerate community batteries on islands and weak grids. Cybersecurity directives under NIS2 raise compliance costs but improve operator readiness.
South America and the Middle East & Africa together account for 18% of installations, yet post near-20% growth. Brazil leverages biomass feedstock, Argentina revives RenovAr, and Colombia maps 340 off-grid communities. In the Gulf, oil companies deploy hybrid systems to cut diesel burn, while South Africa’s utilities approve private microgrids to offset chronic load-shedding.

Competitive Landscape
The top 10 suppliers in the microgrid market control roughly 45% of global revenue, reflecting a moderately fragmented structure. Vertical integrators, ABB, Siemens, Schneider Electric, bundle hardware with proprietary controllers and long-term service contracts. Software specialists such as Heila Technologies differentiate through AI-based dispatch that can shave curtailment by nearly one-fifth. Defense and disaster-recovery tenders favor turnkey providers like Ameresco, which combine EPC execution with 20-year performance guarantees. Emerging plays center on grid-forming inverter upgrades, cyber-security overlays, and per-kWh energy-as-a-service models. Recent M&A saw Siemens acquire EV-charging integrator Heliox, while Eaton took a majority stake in Runstone Technology to deepen its presence in China’s distributed-energy segment. Standards updates, IEEE 1547-2018 and IEC 62443, are shaking out under-capitalized component vendors, consolidating share among firms with in-house power-electronics and cyber-security expertise.
Microgrid Industry Leaders
-
ABB Ltd
-
Siemens AG
-
Schneider Electric SE
-
General Electric Company
-
Eaton Corporation PLC
- *Disclaimer: Major Players sorted in no particular order


Recent Industry Developments
- March 2025: Siemens extended its Microsoft partnership under Siemens Xcelerator to enhance edge-to-cloud data integration for microgrid analytics.
- March 2025: Schneider Electric and Domaine Carneros winery deployed EcoStruxure Microgrid, cutting 375 tCO₂ and saving USD 70,000 annually.
- January 2025: Schneider Electric and The Mobility House launched a fleet EV-charging solution that integrates with on-site microgrids.
- October 2024: DOE GRIP Program allocated over USD 600 million for grid reliability projects in hurricane-hit regions.


Research Methodology Framework and Report Scope
Market Definitions and Key Coverage
Mordor Intelligence defines the microgrid market as the total annual revenue generated from purpose-built, digitally controlled power networks that combine distributed energy resources, storage, loads, and an intelligent controller within a clearly bounded electrical footprint that can disconnect and reconnect to the main utility grid at will. Such systems may serve campuses, communities, industrial sites, or remote locations and are measured in US-dollar terms, from factory gate to commissioning.
Scope exclusion: Temporary diesel or gas generator sets hired for short-term power at construction sites or events are not counted.
Segmentation Overview
-
By Connectivity
- Grid-Connected Microgrids
- Off-Grid/Islanded Microgrids
-
By Offering
- Hardware (Power Generators, Energy-Storage Systems, Power Converters & Inverters, and Controllers)
- Software (Energy Management Platforms, and Microgrid Controllers)
- Services (Engineering, Procurement & Construction (EPC), Operations & Maintenance (O&M), and Consulting & Advisory)
-
By Power Source
- Solar Photovoltaic (PV)
- Combined Heat and Power (Natural Gas)
- Diesel Generators
- Wind
- Fuel Cells
- Others (Biomass, Hydro)
-
By Type
- AC Microgrids
- DC Microgrids
- Hybrid AC/DC Microgrids
-
By Power Rating
- Below 1 MW
- 1 to 5 MW
- 5 to 10 MW
- Above 10 MW
-
By End-User
- Utilities
- Commercial and Industrial
- Residential
-
By Geography
-
North America
- United States
- Canada
- Mexico
-
Europe
- United Kingdom
- Germany
- France
- Spain
- Nordic Countries
- Russia
- Rest of Europe
-
Asia-Pacific
- China
- India
- Japan
- South Korea
- ASEAN Countries
- Rest of Asia-Pacific
-
South America
- Brazil
- Argentina
- Colombia
- Rest of South America
-
Middle East and Africa
- United Arab Emirates
- Saudi Arabia
- South Africa
- Egypt
- Rest of Middle East and Africa
-
North America
Detailed Research Methodology and Data Validation
Primary Research
Mordor teams interview utility planners, EPC contractors, controller vendors, and site owners across North America, Europe, Asia-Pacific, and emerging island grids. These conversations test real installation costs, uptime targets, software licensing models, and regional incentive structures, letting us refine assumptions that desk work alone cannot settle.
Desk Research
Our analysts start with public sources that anchor supply, demand, and policy signals. Statistics from the US Department of Energy, IEA, IRENA, and Eurostat outline installed distributed generation and storage. Grid outage logs from DOE OE-417, project trackers from the World Bank and the Microgrid Resources Coalition, patent trends in Questel, and peer-reviewed papers in IEEE Xplore reveal technology uptake and cost curves. Company 10-Ks, investor decks, and curated news feeds in Dow Jones Factiva, as well as financial snapshots in D&B Hoovers, round out commercial intelligence. The sources cited above illustrate, but do not exhaust, the secondary corpus we review.
A second sweep extracts price benchmarks for key hardware (lithium-ion racks, inverters, switchgear) and deployment counts by capacity band, giving us base ratios for later model steps.
Market-Sizing & Forecasting
We run a blended top-down and bottom-up process. First, national production, import, and funded-project data reconstruct the global spend pool; results are then cross-checked through sampled supplier roll-ups and typical microgrid average selling price multiplied by verified megawatt additions. Key variables include storage $/kWh, solar-plus-storage penetration rates, resilience program budgets, average microgrid size by end user, regulatory grant disbursements, and campus electrification rates, each projected with multivariate regression. Scenario analysis adjusts for currency shifts and incentive sunsets, and any bottom-up gaps are aligned to the top-down ceiling through three-way triangulation.
Data Validation & Update Cycle
Every model run passes anomaly filters, variance checks, and a peer review inside the energy practice before sign-off. Reports refresh yearly, with interim updates triggered by policy shocks, major tender awards, or technology price swings, ensuring clients receive the latest vetted view.
Why Our Microgrid Baseline Earns Trust
Published estimates often diverge because firms slice the market with different capacity thresholds, currency bases, or refresh cadences. Our disciplined scope selection and annual update rhythm minimize those blind spots.
Key gap drivers include whether hardware only or turnkey EPC is counted, the treatment of controller software revenue, and differing ASP trajectories for storage after 2027 price declines. Mordor reports the complete solution spend, while some publishers lift or drop elements, which pushes their totals high or low.
Benchmark comparison
| Market Size | Anonymized source | Primary gap driver |
|---|---|---|
| USD 20.54 B (2025) | Mordor Intelligence | - |
| USD 43.47 B (2025) | Global Consultancy A | Excludes software O&M, applies higher 1-5 MW volume multiplier |
| USD 87.17 B (2024) | Industry Association B | Counts utility-scale hybrid plants lacking islanding controls |
| USD 11.86 B (2024) | Regional Consultancy C | Limits scope to <=50 MW capacity and five core geographies |
The comparison shows that once differing inclusions are stripped out, Mordor's balanced, transparent baseline remains the most reproducible starting point for strategic planning.


Key Questions Answered in the Report
How fast is the microgrid market expected to grow through 2031?
The market is projected to expand at a 17.61% CAGR, rising from USD 24.44 billion in 2026 to USD 54.99 billion by 2031.
Which connectivity configuration dominates current deployments?
Grid-connected systems lead with 62.3% of 2025 installations, although off-grid projects grow quickly in regions without reliable utility service.
Why are hybrid AC/DC microgrids gaining traction?
Data centers and EV charging hubs favor native DC interfaces that cut conversion losses, driving a 19.2% CAGR for hybrid architectures.
What role do utilities play in new microgrid investments?
Utilities are scaling community-scale systems to defer transmission upgrades and mitigate wildfire risk, giving this segment a 21.0% forecast CAGR.
Which region shows the fastest market growth?
Asia-Pacific leads with a 23.7% CAGR through 2031, propelled by rural electrification programs in India and Japan’s distributed-energy mandates.
Page last updated on:


