Laboratory Information System Market Size and Share
Market Overview
| Study Period | 2020 - 2031 |
|---|---|
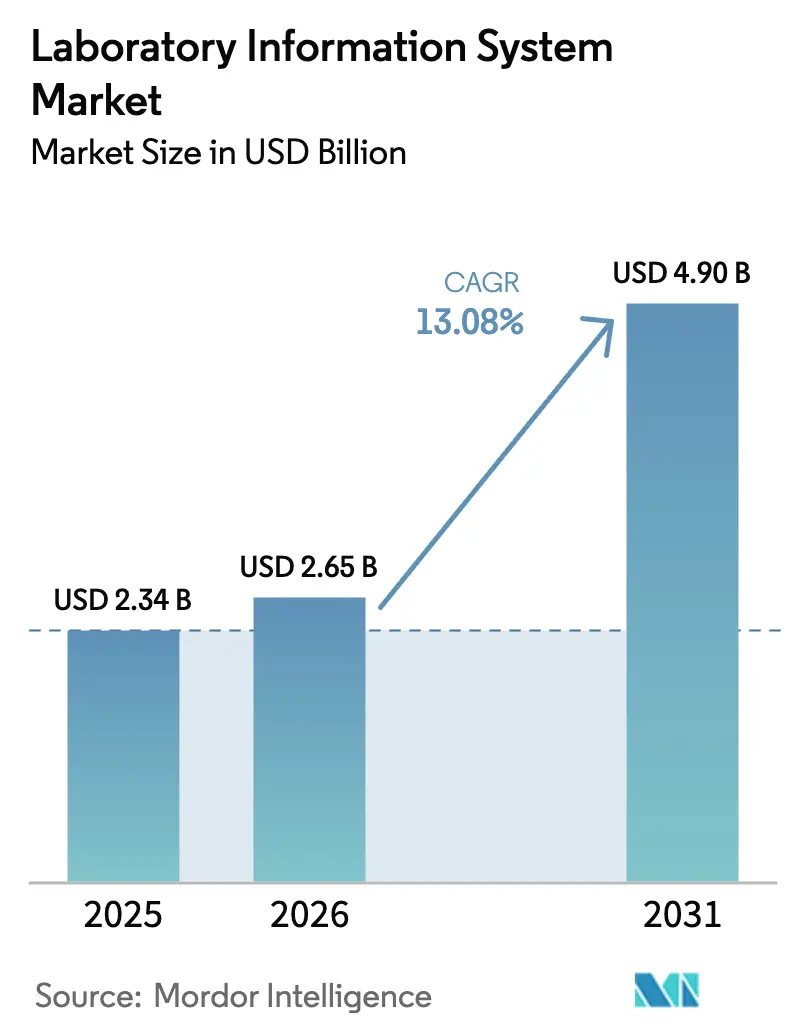
| Market Size (2026) | USD 2.65 Billion |
| Market Size (2031) | USD 4.90 Billion |
| Growth Rate (2026 - 2031) | 13.08% CAGR |
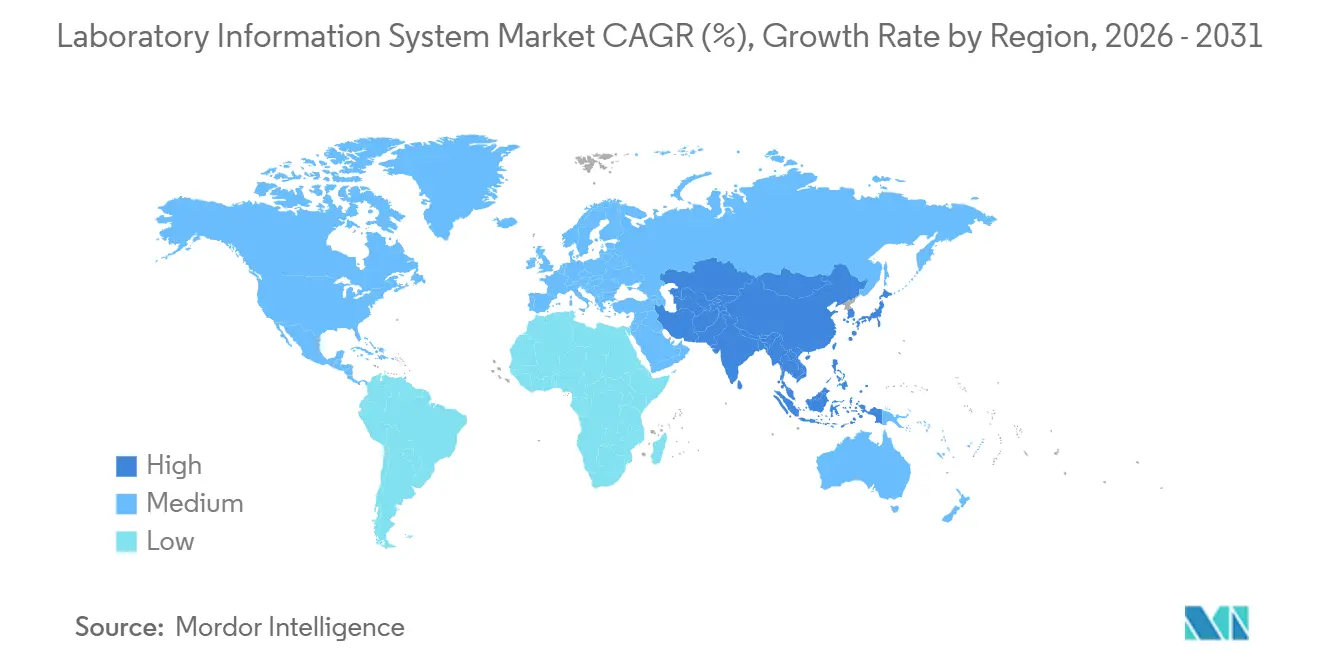
| Fastest Growing Market | Asia Pacific |
| Largest Market | North America |
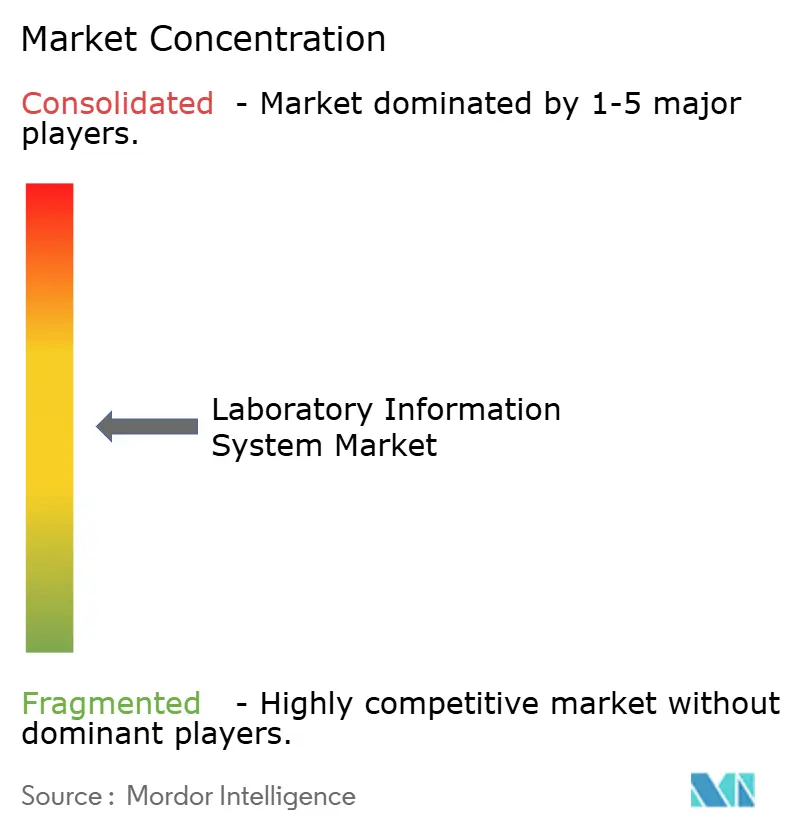
| Market Concentration | Medium |
Major Players *Disclaimer: Major Players sorted in no particular order Image © Mordor Intelligence. Reuse requires attribution under CC BY 4.0. | |
Laboratory Information System Market Analysis by Mordor Intelligence
The Laboratory Information System Market size is projected to expand from USD 2.34 billion in 2025 and USD 2.65 billion in 2026 to USD 4.90 billion by 2031, registering a CAGR of 13.08% between 2026 to 2031.
Demand is accelerating as hospital and reference laboratories retire legacy software, adopt cloud deployments, and prepare for stringent HL7 FHIR interoperability deadlines. Laboratories are also scaling digital pathology and next-generation sequencing programs that generate terabytes of data daily, which favors platforms offering elastic storage and embedded AI analytics. Vendors with HIPAA-eligible and GDPR-compliant cloud regions are pulling ahead, while edge-computing appliances extend LIS connectivity to rural sites with intermittent bandwidth. Cybersecurity outlays and a shortage of LIS-literate informaticians temper adoption but have simultaneously strengthened the services opportunity, as laboratories outsource security patching and regulatory monitoring to vendors.
Key Report Takeaways
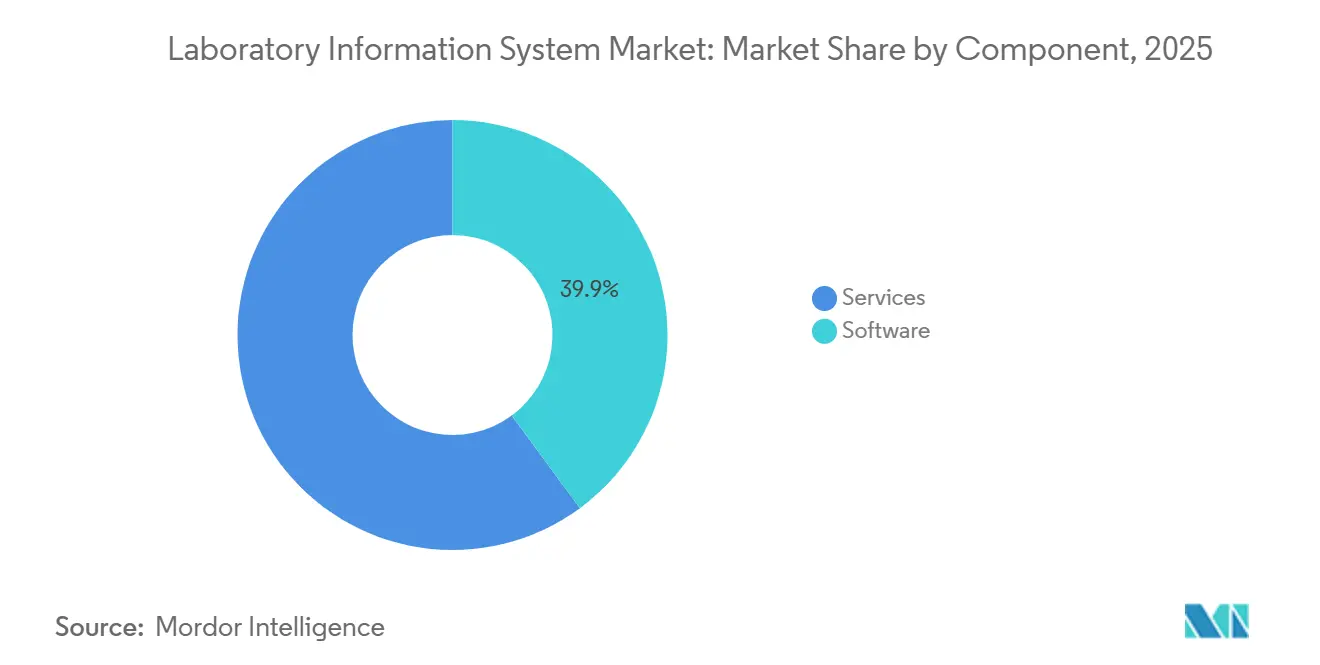
- By component, services captured 60.05% of the laboratory information system market share in 2025 and are projected to expand at a 13.99% CAGR through 2031.
- By mode of delivery, cloud-based deployments held 54.32% of the laboratory information system market size in 2025 and are forecast to grow 14.12% annually to 2031.
- By laboratory type, anatomic pathology commanded a 14.33% CAGR between 2026-2031, the fastest among all segments.
- By end user, standalone laboratories recorded a 13.76% CAGR from 2026-2031, outpacing hospitals and clinics.
- By geography, North America led with a 43.57% market share in the laboratory information system market in 2025; the Asia-Pacific region recorded the fastest 14.42% CAGR through 2031.
Note: Market size and forecast figures in this report are generated using Mordor Intelligence’s proprietary estimation framework, updated with the latest available data and insights as of January 2026.
Global Laboratory Information System Market Trends and Insights
Drivers Impact Analysis*
| Driver | (~) % Impact on CAGR Forecast | Geographic Relevance | Impact Timeline |
|---|---|---|---|
| Rising global diagnostic testing volumes | +2.2% | Global, with APAC and MEA outpacing mature markets | Medium term (2-4 years) |
| Rapid scale-up of biobank networks | +1.2% | North America & EU core, expanding to APAC | Long term (≥4 years) |
| Cloud/SaaS LIS lowering capital outlays | +1.8% | Global, strongest in capital-constrained regions | Short term (≤2 years) |
| AI-powered workflow automation modules | +1.5% | North America & EU early adopters, APAC following | Medium term (2-4 years) |
| Mandatory LIS-EHR interoperability | +2.0% | North America & EU regulatory mandate zones | Short term (≤2 years) |
| Edge-LIS micro-appliances | +0.6% | APAC rural, Sub-Saharan Africa, Latin America | Long term (≥4 years) |
| Source: Mordor Intelligence | |||
Rising Global Diagnostic Testing Volumes
Worldwide specimen volumes are climbing 6-8% annually as aging populations, chronic disease screening, and public-health mandates stretch manual workflows. Europe’s largest chain, SYNLAB, processed more than 600 million tests in 2024 and cut pre-analytical errors by 18% after automating triage through its LIS. Next-generation sequencing runs now generate gigabytes of data per patient, compelling laboratories to deploy bioinformatics-ready LIS modules. In India, Dr. Lal PathLabs manages logistics for 2,500 laboratories and 4,000 collection centers through a centralized cloud LIS that supports 12-15% annual volume growth. Rising throughput is also boosting demand for AI auto-verification that trims routine chemistry turnaround times by up to 30%.
Rapid Scale-Up of Biobank Networks
Precision-medicine initiatives are spawning national biobanks that require long-term specimen tracking, consent management, and multi-omics linkage. The UK Biobank finished whole-genome sequencing for 500,000 participants in 2024, a milestone that depends on federated LIS query capabilities [1]UK Biobank, “Whole-Genome Sequencing Completion,” ukbiobank.ac.uk. Europe’s Genome of Europe project and the U.S. All of Us Program rely on cloud-native LIS layers that meet ISO 20387 standards while supporting GDPR-compliant pseudonymization. SaaS LIS vendors offering pre-validated chain-of-custody modules are therefore seeing strong inbound interest from academic consortia and regional research centers.
Cloud/SaaS LIS Lowering Capital Outlays
Cloud platforms eliminate USD 200,000-500,000 in server purchases and allow laboratories to activate production environments in weeks. AWS HealthLake, launched in 2024, provides HIPAA-eligible FHIR data stores with consumption pricing that lowers five-year TCO by 30-40%. Microsoft Azure Health Data Services starts at USD 0.10 per gigabyte stored, appealing to low-volume specialty labs [2]Microsoft, “Azure Health Data Services,” microsoft.com. Google Cloud’s Healthcare API ships with HL7 v2.x and FHIR connectors that reduce middleware costs.
AI-Powered Workflow Automation Modules
FDA-cleared systems such as PathAI’s AISight and Paige.AI’s FullFocus embed deep-learning algorithms that flag high-risk slides, cutting pathologist review time by 25%. Google Health research published in 2024 showed AI-assisted cytology improved cervical-cancer sensitivity to 94%. These advances push laboratories to upgrade LIS architectures so AI outputs can write directly to patient records and drive predictive maintenance on analyzers.
Restraints Impact Analysis*
| Restraint | (~) % Impact on CAGR Forecast | Geographic Relevance | Impact Timeline |
|---|---|---|---|
| High total cost of ownership | −1.1% | Global, most acute in small-to-mid-size independent labs | Medium term (2-4 years) |
| Escalating cybersecurity liabilities | −1.0% | North America & EU regulatory zones, spreading globally | Short term (≤2 years) |
| Shortage of LIS-literate informaticians | −0.7% | Global, particularly acute in North America & EU | Medium term (2-4 years) |
| Volatile open-API standards | −0.5% | Global, affecting multi-vendor integration projects | Long term (≥4 years) |
| Source: Mordor Intelligence | |||
High Total Cost of Ownership
Mid-size laboratories with 100-500 daily accessions spend USD 150,000-400,000 per year on licenses, interfaces, and IT support. Per-analyzer interface fees of USD 5,000-15,000 erode margins, while cloud subscription costs scale with data retention. Consulting for FHIR mapping or custom reports can exceed USD 200 per hour, and training now represents 20-25% of go-live budgets.
Escalating Cybersecurity & HIPAA/GDPR Liabilities
Ransomware assaults surged to 725 reported breaches in U.S. healthcare facilities during 2023, with the February 2024 Change Healthcare attack alone disrupting claims worth USD 6.3 billion. Laboratories must now budget for intrusion detection, zero-trust network designs, and 24/7 security operations centers. The U.S. HHS framework released in December 2023 proposes mandatory cyber practices, and GDPR fines in Europe climb to 4% of annual revenue for non-compliance. These costs divert funds from functional upgrades and lengthen procurement cycles, particularly for cloud deployments that trigger strict data-sovereignty reviews.
*Our forecasts treat driver/restraint impacts as directional, not additive. The impact forecasts reflect baseline growth, mix effects, and variable interactions.
Segment Analysis
By Component: Services Outpace Software as Integration Complexity Escalates
Services contributed 60.05% of the laboratory information system market in 2025, and their revenue is projected to rise 13.99% annually through 2031. The laboratory information system market size for services is growing because laboratories require FHIR mapping, AI validation, and multi-site cloud orchestration. SaaS platforms are eroding perpetual-license software sales, but longer implementation cycles push consulting and managed-services demand.
Managed support contracts now bundle security patching, disaster recovery, and accreditation reporting, converting previously discretionary spend into recurring fees. Vendors offering pre-validated templates win faster deals, while training engagements aligned with ISO 15189 audits keep consulting pipelines full.


By Mode of Delivery: Cloud-Based Dominance Reflects Capital Efficiency and Regulatory Agility
Cloud models controlled 54.32% of the laboratory information system market share in 2025. Elastic infrastructure lets laboratories scale influenza testing surges without over-provisioning hardware, and built-in FHIR endpoints simplify compliance. The laboratory information system market size tied to on-premise installations is shrinking as server refresh and cybersecurity costs climb.
Hybrid deployments remain relevant where data-localization laws restrict cross-border transfer, allowing sensitive genomic data to stay on-site while administrative modules run in the cloud. Vendors secure a competitive advantage by offering HIPAA Business Associate Agreements and country-specific GDPR hosting zones.
By Laboratory Type: Anatomic Pathology Labs Lead Growth on Digital Pathology Integration
Anatomic pathology is the fastest-growing laboratory cohort, posting a 14.33% CAGR as whole-slide imaging and AI tumor detection gain clinical acceptance. The laboratory information system market size for anatomic pathology benefits from multi-gigabyte image storage and remote consultation workflows, compelling vendors to optimize for DICOM and high-bandwidth streaming.
Clinical pathology retained the largest revenue base with 38.57% share in 2025, but its incremental growth trails digital pathology’s momentum. Molecular diagnostics laboratories also require deep bioinformatics hooks, adding pressure on vendors to ship variant-calling pipelines natively inside the LIS.

By End User: Laboratories Segment Outpaces Hospitals as Consolidation Accelerates
Standalone laboratories are expanding at 13.76% CAGR as diagnostic chains acquire regional players and deploy centralized cloud LIS across thousands of collection points. Hospitals and clinics still hold 54.87% share, yet replacement cycles are lengthening to 7-10 years, slowing unit sales.
Academic and research institutes adopt federated LIS to support multi-center trials, while value-based care contracts push hospitals toward stewardship dashboards that curb redundant testing. The laboratory information system industry’s service providers now bundle analytics that flag inappropriate orders in real time.
Geography Analysis
North America accounted for 43.57% of 2025 revenue, reflecting high installed-base maturity and early regulatory triggers. The United States leads upgrades as laboratories race to meet the January 2027 FHIR mandate, while Canada’s provincial health authorities fund consolidated cloud rollouts to harmonize result sharing. Mexico shows steady gains as private diagnostic firms expand into secondary cities, though currency volatility tempers capital budgets.
Asia-Pacific is projected to post 14.42% CAGR, the fastest regional expansion in the laboratory information system market. India’s ISO 15189 accreditation drive and China’s Healthy China 2030 program are digitizing tertiary hospital labs [3]National Health Commission of China, “Healthy China 2030,” nhc.gov.cn. Diagnostic chains such as Dr. Lal PathLabs leverage cloud LIS to monitor 2,500 labs in real time, promoting standardized SOPs across tier-2 and tier-3 cities. Japan and Australia invest in national health information exchanges that embed LIS result feeds.
Europe enjoys stable uptake as the Health Data Space regulation mandates cross-border laboratory interoperability. Germany, with more than 1,800 hospital labs, leads cloud migration to comply with Medical Device Regulation software clauses. The United Kingdom consolidates pathology services into 29 regional networks that issue unified LIS tenders to cut costs and improve turnaround. France, Italy, and Spain follow similar digitization arcs, synchronized with phased EHDS deadlines through 2031.

Regulatory Landscape
In the United States, LIS deployments are shaped by CLIA requirements administered by CMS and a tightening interoperability roadmap under ONC. ONC has continued to advance certification and data exchange requirements through its HTI rulemaking, and the 2026 Standards Version Advancement Process (SVAP) enables certified health IT to voluntarily adopt newer interoperability standards, including HL7 FHIR US Core 6.1.0 (effective in 2026). These timelines typically drive near-term replacement of HL7 v2-only workflows with FHIR-ready architectures and raise demand for validation and documentation within LIS implementations.
Regulatory pressure also rises around diagnostics oversight and traceability. The FDA final rule on laboratory developed tests introduces phased oversight, including registration and listing requirements taking effect by May 6, 2026, which increases emphasis on audit trails, controlled change management, and test metadata governance within LIS environments. In Europe, IVDR requirements for health institutions producing in-house IVDs have included mandatory public declarations since May 26, 2024, and the planned trigger for mandatory use of Eudamed modules on May 28, 2026 adds another digital compliance touchpoint. This strengthens the case for LIS platforms with structured device and test documentation and harmonized reporting.
Value Chain Analysis
The LIS value chain starts with standards and compliance inputs (HL7, FHIR profiles, LOINC, SNOMED CT, ISO 15189-aligned workflows, and national privacy rules), followed by core platform development by LIS vendors and ecosystem enablement by middleware and interface providers, as well as cloud infrastructure partners. Implementation then concentrates on integration work, including instrument connectivity, LIS-EHR interfaces, FHIR mapping, master patient and specimen identity, and cybersecurity hardening, and it is increasingly delivered through systems integrators and vendor professional services teams. In production operations, laboratories consume managed services for patching, uptime, monitoring, and accreditation reporting, while downstream data consumers include EHRs, public health reporting nodes, digital pathology viewers, genomics pipelines, and analytics layers.
Interoperability requirements and operational continuity function as key bottlenecks, which elevates the role of middleware and partner ecosystems. For example, TECHNIDATA and Ascentry introduced an updated middleware approach integrated with the TDNexLabs LIS in 2026 to improve business continuity and application ecosystem integration, reflecting demand for resilient, modular deployments. On the clinical workflow side, partnerships that connect primary care ordering to laboratory execution and results distribution are gaining weight as labs move toward end-to-end order-to-result digitization rather than standalone LIS functionality.
Competitive Landscape
The laboratory information system market is moderately fragmented; the top five vendors hold a substantial share of revenue. Epic Systems and Oracle Health ride incumbent EHR footprints to bundle LIS modules, yet best-of-breed buyers prefer specialty depth. Clinisys, Soft Computer Consultants, and CompuGroup Medical embed predictive maintenance, AI validation, and turnkey FHIR APIs to shorten go-lives.
Cloud hyperscalers add pressure by launching LIS-as-a-Service blueprints on AWS, Azure, and Google Cloud, allowing mid-size labs to bypass traditional vendors. Equipment makers like Sysmex and Werfen now ship analyzers with native LIS layers, converting hardware channels into software gateways. Meanwhile, open-source projects such as OpenELIS gain traction in donor-funded programs where licensing budgets are tight.
Edge-LIS appliances, federated biobank modules, and AI-enabled digital pathology represent white-space niches. Vendors that secure ISO 15189 or CLIA-compliant certifications capitalize on laboratories’ need to pass audits quickly, and those offering managed compliance monitoring lock in annuity revenue.
Laboratory Information System Industry Leaders
Clinisys, Inc.
CompuGroup Medical SE & Co. KGaA
Epic Systems Corporation
Oracle Corporation
Sysmex Corporation
- *Disclaimer: Major Players sorted in no particular order

Market Opportunities and Future Outlook
Cloud-native modernization remains a primary whitespace for laboratories retiring legacy systems while aligning with interoperability and cybersecurity requirements. The combination of mandatory FHIR-oriented roadmaps (for example, US interoperability programs) and Europe-wide data-sharing frameworks such as the European Health Data Space increases demand for LIS platforms that include pre-validated FHIR endpoints, standardized terminologies, and strong auditability across multi-site lab networks. This opens room for vendors and service providers that can package migration, data normalization, and ongoing compliance monitoring into repeatable offerings, especially for standalone lab chains and regional pathology networks consolidating onto fewer platforms.
AI-enabled workflow automation and digital pathology integration are developing into concrete commercialization paths, supported by recent product activity. Dedalus introduced a next-generation, cloud-native pathology LIMS designed to replace legacy installations and integrate with its DeepUnity digital pathology platform (2026), while LabVantage launched LabVantage CORTEX (March 2026) to automate workflows and compliance monitoring alongside existing laboratory systems. Operational opportunities also include reducing manual intake and interface friction: LigoLab partnered with MarginLogic Health AI (July 2026) to apply OCR to faxed or paper requisitions, targeting a persistent operational pain point. Completed deployments such as the phased WinPath rollout at Stockport NHS Foundation Trust also reinforce demand for upgrade programs delivered in staged modules without disrupting service lines.
Recent Industry Developments
- July 2026: Stockport NHS Foundation Trust completed the final phase of deploying the Clinisys WinPath laboratory system across blood transfusion and blood sciences after a phased rollout that began in 2025. The program highlights continued replacement of legacy laboratory platforms in public health systems and strengthens Clinisys presence in UK pathology modernization cycles.
- July 2025: Clinisys acquired Orchard Software to broaden its laboratory informatics footprint and expand its portfolio reach across lab settings. The deal supports platform consolidation strategies where buyers seek fewer vendors across LIS, outreach, and specialty workflows, while also increasing cross-sell opportunities for services and integration.
- August 2024: Quest Diagnostics agreed to purchase LifeLabs for USD 985 million to strengthen its Canadian diagnostic network. The transaction increases the scale of laboratory operations under a single enterprise umbrella, raising the importance of standardized LIS configurations, centralized analytics, and interoperable result distribution across provinces.


Research Methodology Framework and Report Scope
Market Definition and Coverage
This market covers revenue from laboratory information system (LIS) software platforms and related services used to manage lab workflows, including ordering, sample tracking, result validation, reporting, and data exchange across clinical laboratories.
Scope exclusions: The scope does not include research-only lab systems, electronic lab notebooks, middleware or interface-only products, or laboratory hardware sales.
Segmentation Overview
- By Component
- Software
- Stand-alone LIS
- Integrated LIS / EHR-centric
- SaaS LIS Platforms
- Services
- Implementation & Integration
- Maintenance & Support
- Training & Consulting
- Software
- By Mode of Delivery
- On-Premise
- Cloud-Based
- Hybrid
- By Laboratory Type
- Clinical Pathology Labs
- Anatomic Pathology Labs
- Molecular Diagnostics Labs
- Blood Banks & Biobanks
- Other Specialized Labs
- By End User
- Hospitals & Clinics
- Laboratories
- Academic & Research Institutes
- By Geography
- North America
- United States
- Canada
- Mexico
- Europe
- Germany
- United Kingdom
- France
- Italy
- Spain
- Rest of Europe
- Asia-Pacific
- China
- Japan
- India
- Australia
- South Korea
- Rest of APAC
- Middle East & Africa
- GCC
- South Africa
- Rest of Middle East & Africa
- South America
- Brazil
- Argentina
- Rest of South America
- North America
Data Sources, Market Sizing, and Validation
Desk Research
Desk work starts by mapping where LIS demand comes from and how it is paid for, so the model is tied to realistic lab activity and IT spending. We lean on public sources such as the US CDC (laboratory guidance and surveillance reporting), CMS (billing and reimbursement context), OECD Health Statistics (system level indicators), WHO (health system and diagnostic priorities), and peer reviewed informatics journals that discuss LIS adoption and interoperability.
To convert this context into usable sizing inputs, we also review company filings and investor presentations, regulatory and standards material such as HL7 documentation, and reputable press coverage on hospital IT modernization and cloud migrations. A paid subscription used for company financials and news helps validate revenue ranges and timing for product launches and acquisitions. These sources are not exhaustive, and we used additional public references for cross-checks and clarification during analysis.
Primary Interviews and Surveys
Primary work is used to confirm what is actually counted as LIS spending in hospitals and independent laboratories, and what gets treated as adjacent software. We interview a mix of LIS buyers, lab operations leaders, and implementation and informatics specialists across APAC, EMEA, and the Americas so regional deployment patterns and pricing practices can be tested before finalizing assumptions.
Distribution of primary research fieldwork respondents
| Company type | Respondent position | Region |
|---|---|---|
| Top tier: 37% | CXOs: 12% | APAC: 50% |
| Mid tier: 49% | Functional/Unit leaders: 29% | EMEA: 32% |
| Smaller Players: 14% | Managers: 59% | Americas: 18% |
Market-Sizing & Forecasting
Sizing is built using a top-down approach where lab testing activity and care delivery indicators are used to reconstruct the addressable demand pool for LIS software and services by region, then filtered through adoption and replacement cycles. To keep the totals realistic, we corroborate results with selective bottom-up approximations such as sampled license and subscription price points, services intensity per installation, and a roll-up of publicly visible revenue signals for a set of suppliers.
Key inputs used in the model include the number of diagnostic laboratories and hospital labs in operation, the mix shift toward cloud and hybrid deployments, interoperability and reporting requirements that drive upgrades, average contract duration for software and services, and implementation timelines that influence revenue recognition. When the bottom-up check is incomplete for smaller countries or fragmented buyer groups, we use proxy ratios based on comparable health spend and lab density, and then review them in interviews.
Forecasts are produced using scenario analysis supported by short trend series, where adoption speed, price progression, and upgrade cycles are varied within ranges validated by primary respondents. The final projection is then aligned to the most consistent scenario across regions, so the forecast does not depend on one aggressive assumption.
Data Validation & Update Cycle
Outputs are checked against independent signals such as regional healthcare IT spend direction, lab digitization programs, and the pace of cloud migration in provider settings, and then outliers are investigated before sign-off. If the model shows a jump that cannot be explained by a known policy change, a deployment shift, or a pricing reset, we re-check inputs and, when needed, re-contact participants to confirm what changed.
A multi-step internal review is followed so definitions, currency handling, and year alignment are consistent across countries and segments. The report is refreshed annually, and interim updates are triggered when major deals, regulatory changes, or reimbursement shifts materially affect procurement patterns. Before delivery, a final analyst pass is completed to ensure clients receive the latest updated view.
Mordor Intelligence's Laboratory Information System Lis Market Size Compared With Other Published Estimates
Market values for LIS can vary across publishers because they do not always count the same revenue streams, years, or lab settings, even when the titles look similar. Differences usually come from what gets included around services and deployment, and how adoption and pricing are assumed to move over time.
By tracking contract types and renewal behavior, Mordor Intelligence keeps the LIS total limited to software and related services used inside clinical labs, while some estimates also fold in hardware and interface products or use earlier base years that are not adjusted in the same way for currency timing and inflation.
Benchmark comparison
| Source | Market Size | Gaps in Research Methodology |
|---|---|---|
| Mordor Intelligence | USD 2.65 B (2026) | |
| Industry Publisher A | USD 2.88 B (2024) | Uses a 2024 base and explicitly includes LIS hardware as a component, which can raise the value versus a software and services only boundary. |
| Market Publisher B | USD 2.18 B (2024) | Uses 2024 as the base year with a broader product framing and a longer horizon to 2034, where slower assumed adoption and pricing progression can reduce the near-term market value. |
The comparison shows that scope boundaries and base-year choices can shift the reported total by a meaningful margin. Our estimate stays traceable because it ties revenue to clinical lab workflow use cases, checks service intensity separately from software, and re-tests assumptions with interviews before locking the final numbers.


Key Questions Answered in the Report
How big is the Laboratory Information System Market?
The laboratory information system market size is USD 2.65 billion in 2026 and is projected to climb to USD 4.90 billion by 2031.
Which deployment model is growing fastest?
Cloud-based solutions lead growth at a 14.12% CAGR because they cut capital outlays and simplify HL7 FHIR compliance.
Why are services revenue outpacing software sales?
Laboratories need FHIR mapping, AI validation, and security monitoring, which extend implementation timelines and fuel double-digit services growth.
Which laboratory type offers the highest growth opportunity?
Anatomic pathology labs, propelled by digital slide imaging and AI tumor detection, are expanding at 14.33% annually through 2031.
What is the main regulatory driver in the United States?
CMS requires all Medicare-participating laboratories to expose HL7 FHIR R4 APIs by January 2027, forcing legacy system upgrades.
Page last updated on:


