
Metal Matrix Composites Market Size and Share
Market Overview
| Study Period | 2020 - 2031 |
|---|---|
| Market Size (2026) | USD 517.99 Million |
| Market Size (2031) | USD 706.88 Million |
| Growth Rate (2026 - 2031) | 6.40 % |
| Fastest Growing Market | Asia-Pacific |
| Largest Market | North America |
| Market Concentration | Medium |
Major Players *Disclaimer: Major Players sorted in no particular order Image © Mordor Intelligence. Reuse requires attribution under CC BY 4.0. | |
Metal Matrix Composites Market Analysis by Mordor Intelligence
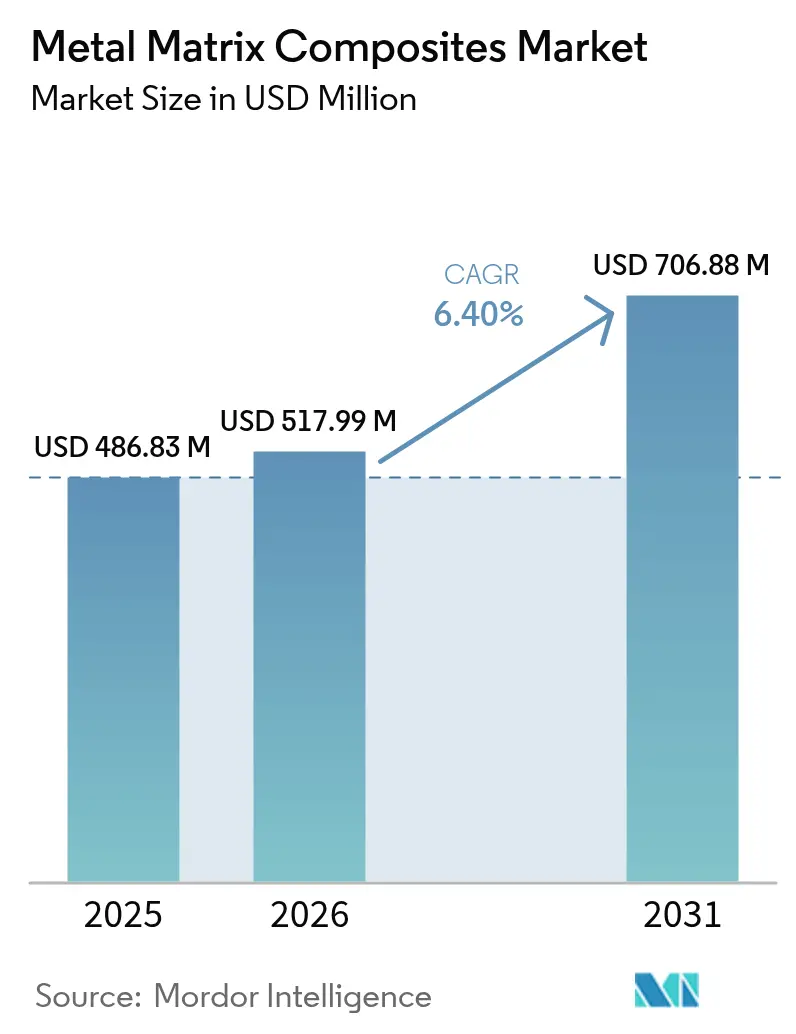
The Metal Matrix Composites market size is expected to grow from USD 486.83 million in 2025 to USD 517.99 million in 2026 and is forecast to reach USD 706.88 million by 2031 at 6.40% CAGR over 2026-2031. Rising aerospace demand for structural weight reduction, the electric-vehicle pivot toward high-heat-flux battery packs, and convergence of additive manufacturing with powder metallurgy together accelerate material adoption. Established aluminum-based systems dominate because they satisfy stringent certification pathways, while refractory variants unlock opportunities in hypersonic vehicles and gas turbines. Automotive brake and power-train applications intensify usage of silicon-carbide-reinforced aluminum discs that cut unsprung mass and improve thermal stability. Simultaneously, 5G infrastructure spurs electronics manufacturers to specify composites that dissipate ≥100 W/cm² heat loads. Although premium pricing persists, laser-based additive manufacturing and friction-stir processing are lowering per-part costs and broadening design freedom, allowing the metal matrix composites market to penetrate volume programs.
Key Report Takeaways
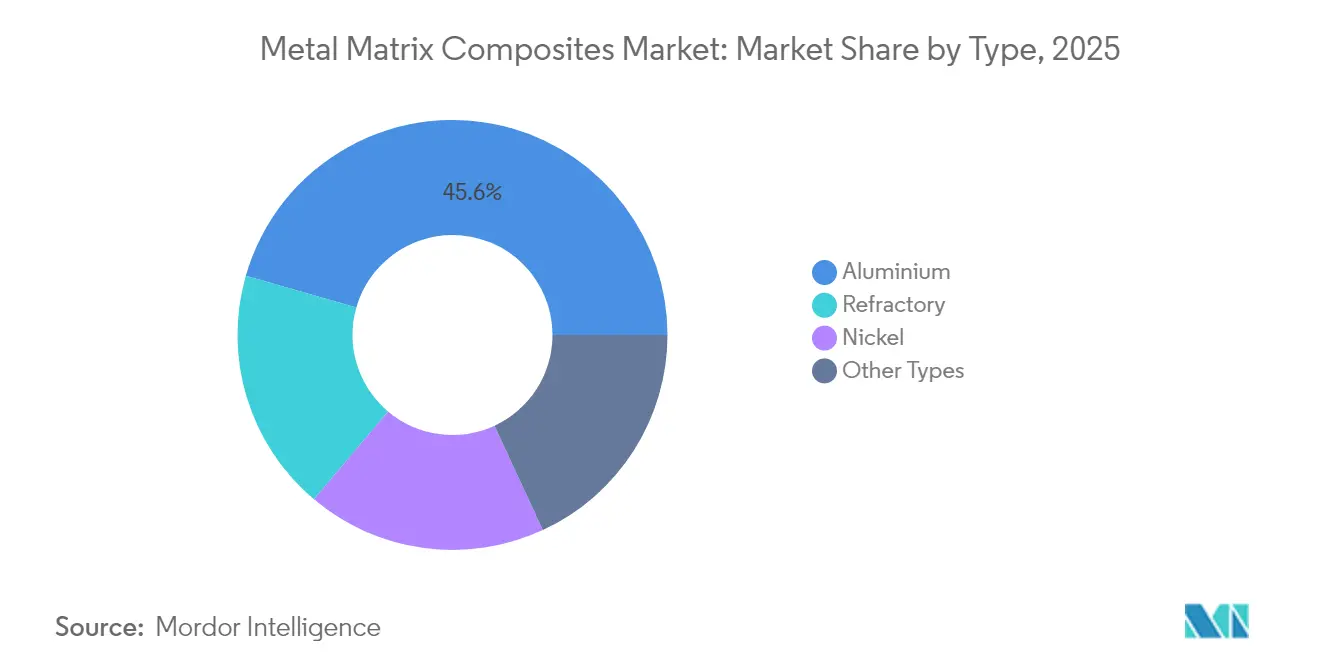
- By type, aluminum led with 45.55% of the metal matrix composites market share in 2025, while refractory is forecast to expand at 7.36% CAGR through 2031.
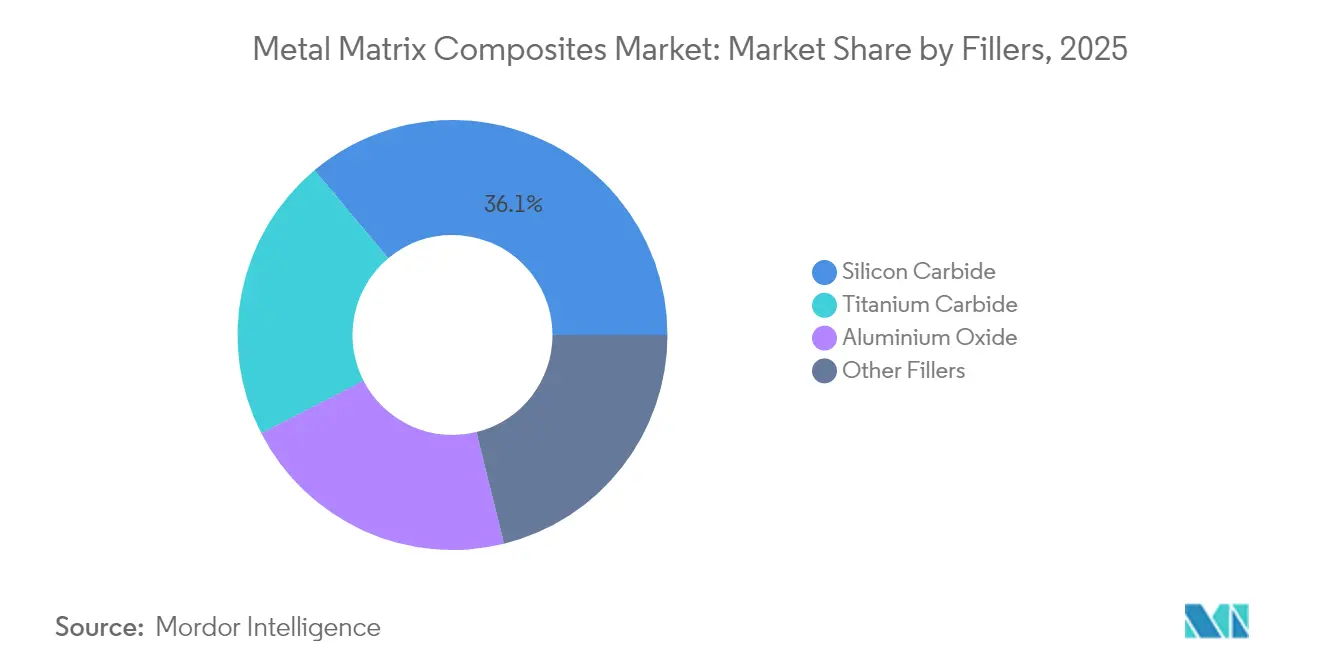
- By fillers, silicon carbide held 36.10% share of the metal matrix composites market size in 2025; titanium carbide is projected to grow at 7.05% CAGR to 2031.
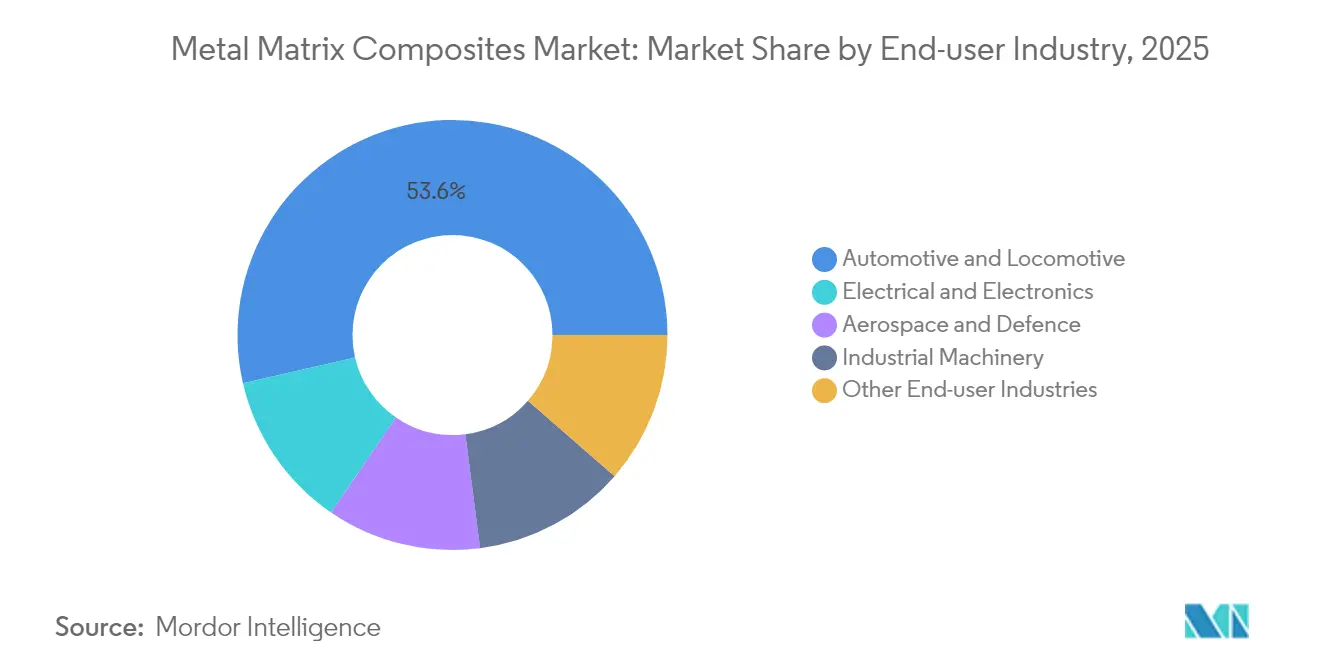
- By end-user industry, automotive and locomotive accounted for 53.60% share of the metal matrix composites market size in 2025, whereas electrical and electronics will advance at 7.56% CAGR through 2031.
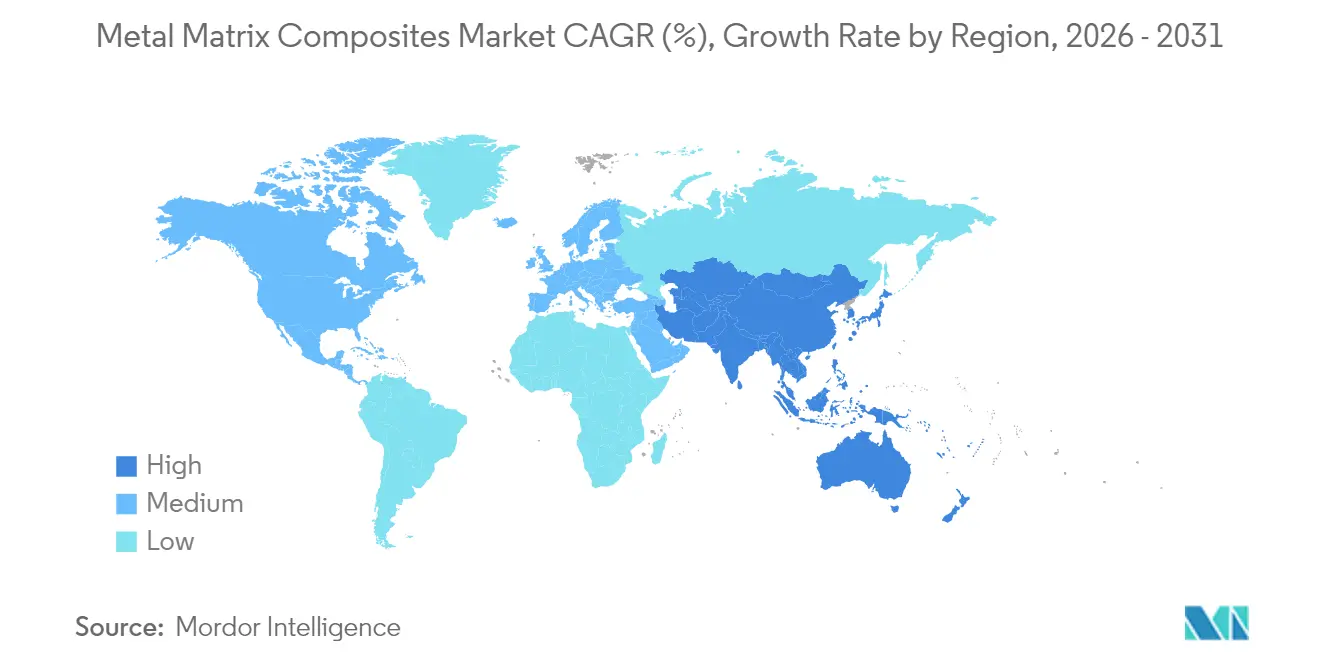
- By geography, North America led with 32.40% revenue share in 2025 and Asia-Pacific is expected to record the highest CAGR at 7.22% between 2026 and 2031.
Note: Market size and forecast figures in this report are generated using Mordor Intelligence’s proprietary estimation framework, updated with the latest available data and insights as of 2026.
Market Trends and Insights
Drivers Impact Analysis of Metal Matrix Composites Market*
| Driver | (~) % Impact on CAGR Forecast | Geographic Relevance | Impact Timeline |
|---|---|---|---|
| Increasing Demand for Lightweight Materials in Aerospace and Defence | +1.8% | Global, with concentration in North America and Europe | Medium term (2-4 years) |
| Rapid EV-Led Need for Advanced Thermal-Management Materials | +1.5% | APAC core, spill-over to North America and Europe | Short term (≤ 2 years) |
| Automotive Shift Toward SiC-Reinforced Al Brake and Power-Train Parts | +1.2% | Global, led by APAC automotive hubs | Medium term (2-4 years) |
| Superior Mechanical and Thermal Properties Vs. Conventional Metals | +1.0% | Global | Long term (≥ 4 years) |
| Additive-Manufacturing Adoption for Complex MMC Heat Sinks | +0.9% | North America and Europe, expanding to APAC | Short term (≤ 2 years) |
| Source: Mordor Intelligence | |||
Increasing Demand for Lightweight Materials in Aerospace and Defense
Aerospace primes reduce structural weight to extend range and payload, prompting aluminum- and titanium-matrix composites in fuselage skins, missile bodies, and satellite panels. Hypersonic programs require skins that survive extreme thermal gradients, pushing refractory matrices into qualification pipelines. Defense contractors now specify metal matrix composites for electronic-warfare enclosures where mass savings deliver mission-relevant power density gains. ECSS and MIL-HDBK-17 standards govern test methods and facilitate certification, enabling faster insertion into flight hardware. Lockheed Martin’s historical investment in SupremEX™ components underscores long-term commitment to composite metals.
Rapid EV-Led Need for Advanced Thermal-Management Materials
Fast-charging electric vehicles generate localized heat fluxes exceeding 100 W/cm² around battery tabs and power modules. Silicon-carbide-reinforced aluminum spreads heat 40–60% better than conventional aluminum while maintaining battery-pack mass budgets. Diamond- and graphene-enhanced copper matrices emerge for inverter baseplates where coefficient-of-thermal-expansion matching mitigates solder fatigue[1]Materials Journal Editorial Board, “Advanced Thermal Interface Materials for EVs,” mdpi.com . Automakers such as Tesla and BYD embed these composites into next-generation thermal interface architectures. Parallel roll-out of 5G macro cells intensifies cross-industry demand for identical heat-spreader solutions, multiplying order volumes for qualified suppliers.
Automotive Shift Toward SiC-Reinforced Al Brake and Power-Train Parts
Premium vehicle platforms replace cast-iron brake discs with SiC-Al alternatives that cut rotor weight by more than 50% and improve fade resistance, directly boosting electric driving range. Regenerative-braking duty cycles impose rapid thermal swings; composites maintain dimensional stability, avoiding judder common in monolithic metals. Mercedes-Benz adopted composite rotors on AMG models, while BMW deploys them on M-series sedans. Beyond brakes, transmission housings produced via squeeze casting integrate reinforcement preforms to elevate thermal conductivity without mechanical compromise. ISO 26262 pushes OEMs toward materials with predictable failure modes and robust statistical data.
Superior Mechanical and Thermal Properties vs. Conventional Metals
Metal matrix composites unite reinforcement hardness with matrix ductility, achieving strength levels more than 900 MPa at densities below steel according to Purdue University research. Composite metal foams absorb impact energy 100-times more effectively than solid aluminum while reducing mass by 70%, opening new armor and crash-energy-management opportunities. Nanolaminated intermetallic layers mitigate interfacial brittleness, extending fatigue life under cyclic thermal load. Such tunability positions the metal matrix composites market as a go-to solution where monolithic metals hit performance ceilings.
Restraints Impact Analysis of Metal Matrix Composites Market*
| Restraint | (~) % Impact on CAGR Forecast | Geographic Relevance | Impact Timeline |
|---|---|---|---|
| Complex and Costly Fabrication Processes | -1.4% | Global, particularly affecting smaller manufacturers | Medium term (2-4 years) |
| High Cost of Ceramic/Graphene Reinforcements | -1.1% | Global, with higher impact in cost-sensitive applications | Short term (≤ 2 years) |
| Supply-Chain Scale and Standards Gaps | -0.8% | Global, with regional variations in standards adoption | Long term (≥ 4 years) |
| Source: Mordor Intelligence | |||
Complex and Costly Fabrication Processes
Laser powder-bed fusion builds can cost 2–120 times more than comparable cast parts, restricting use to high-value applications. Stir-casting lines require precise temperature and atmosphere control, demanding capital-intensive furnaces and operator training. Non-destructive evaluation of porosity and reinforcement distribution adds inspection overhead, while ASTM D3552-24 compliance introduces incremental testing expenses. Smaller fabricators struggle to fund such infrastructure, limiting regional supply diversity and restraining the metal matrix composites market.
High Cost of Ceramic/Graphene Reinforcements
Silicon carbide powder prices span USD 21.85–1,501.50/kg depending on purity, while graphene platelets command even higher premiums. Raw-material volatility complicates long-term supply agreements, challenging OEM cost-down roadmaps. Graphene and carbon-nanotube supply chains remain immature, with capacity dominated by a handful of Asian producers. Titanium-carbide synthesis requires high-temperature reactors that inflate energy bills, making cost-sensitive sectors hesitant to switch away from monolithic alloys.
*Our forecasts treat driver/restraint impacts as directional, not additive. The impact forecasts reflect baseline growth, mix effects, and variable interactions.
Metal Matrix Composites Market Segment Analysis
By Type:
Aluminum Dominance Drives Aerospace IntegrationAluminum captured 45.55% of 2025 revenue, underscoring their synergy with existing aerospace and automotive qualification databases. The metal matrix composites market demonstrates sustained preference for aluminum because it combines lightweight attributes with thermal conductivity that exceeds steel by ≥200%, enabling brake and heat-sink integration without severe tooling changes. Refractory, though smaller, are growing at a 7.36% CAGR; hypersonic vehicle skins must endure more than 1,000 °C boundary-layer temperatures that position molybdenum- or tungsten-based systems as frontrunners.
Additive-manufacturing toolpaths now embed graded reinforcements inside aluminum structures, allowing increased near-surface hardness while retaining ductile cores. ASTM certification protocols for aluminum composites further smooth aerospace approval pathways. Conversely, refractory systems face limited standardization, but novel laser-cladding approaches promise cost decline, hinting at eventual volume penetration that will diversify the metal matrix composites industry.



By Fillers:
Silicon Carbide Leadership Faces Titanium Carbide ChallengeSilicon carbide reinforcement owns a 36.10% revenue position, sustaining the metal matrix composites market through well-documented performance in brake rotors and semiconductor packaging. Its thermal conductivity (~270 W/m-K) improves heat-spreading relative to alumina while avoiding weight penalties of copper alloys. Titanium carbide, although presently smaller, is rising at 7.05% CAGR on the back of hypersonic and turbine vane programs requiring 3,160 °C melting points. Self-propagating high-temperature synthesis (SHS) lowers TiC powder costs, driving OEM qualification.
Graphene-enhanced fillers offer unmatched strength-to-weight but remain niche due to price. Aluminum oxide retains share in wear-driven applications where cost overrides ultimate thermal performance. The shift toward nano-reinforcements unlocks tailored CTE control, though batch-to-batch consistency still challenges high-volume suppliers. Collectively, filler development keeps the metal matrix composites market primed for specialized performance envelopes beyond conventional metals.
By End-user Industry:
Automotive Dominance Meets Electronics AccelerationAutomotive and locomotive industry generated 53.60% of 2025 demand, reflecting fleet electrification and lightweighting mandates that place composite brake systems and motor housings at center stage. Electric-vehicle platforms optimize range through unsprung mass reduction, achieved via SiC-Al rotors that are 60% lighter than cast-iron equivalents. The segment is expected to sustain volume dominance even as price curves descend.
Electronic and electrical industry will post the fastest 7.56% CAGR to 2031, driven by 5G small-cell roll-outs and power-semiconductor upgrades that require heat spreaders capable of slotting within tight thermal budgets. Metal-based composites outperform ceramics by combining high conductivity with machinability, granting foundries tighter tolerances and reduced scrap rates. Aerospace, defense, and industrial machinery sectors maintain steady pull where performance value eclipses cost concerns, creating a balanced end-market portfolio for the metal matrix composites market.
Geography Analysis
Pacific and Midwestern United States Metal Matrix Composites Market
North America controlled 32.40% of 2025 revenue because of its defense spending priorities and aerospace OEM clustering around the U.S. West Coast and Midwest. Domestic content rules in fighter and space programs secure local demand, while CHIPS Act incentives support composite heat-spreaders inside next-generation wafer fabs. Materion and Howmet run vertically integrated operations, mitigating reinforcement supply shocks and ensuring compliance with ITAR regulations.
APAC Metal Matrix Composites Market
Asia-Pacific leads growth with a 7.22% CAGR forecast to 2031 as China’s aluminum value chain and cost-competitive silicon-carbide production shorten lead times for automotive brake suppliers. Japan’s precision-machining sector scales composite housings for vehicle power modules, and South Korea integrates high-thermal-conductivity baseplates into its expanding battery plants. Regional free-trade agreements improve access to Australian bauxite and Vietnamese rare-earth projects, anchoring long-term feedstock security for the metal matrix composites market.
Europe, South America and the Middle East Metal Matrix Composites Market
Europe situates between the two poles, leveraging strict emissions standards to drive composite part integration in premium cars and Airbus platforms. Germany’s Tier-1 suppliers pioneer friction-stir-processed panels that satisfy REACH guidelines. Eastern-European machine shops explore composite metal foams for railcar crash-boxes, hinting at broader adoption. South American and Middle Eastern markets remain nascent yet possess bauxite and titanium reserves that could seed localized composite ecosystems post-2030.

Regulatory Landscape
Metal matrix composites (MMCs) used in aerospace, defense, and space applications face material and process controls anchored in standards and certification guidance rather than a single global regulator. NASA-STD-6016C governs the use of approved materials for NASA aerospace hardware and references SAE CMH-17 (Volume 4) for MMC requirements, reinforcing documentation, traceability, and qualification testing expectations across aluminum-, titanium-, and refractory-matrix systems. In Europe, EASA certification guidance similarly emphasizes substantiation for novel materials and manufacturing routes, which increases the importance of standardized test methods and evidence packages for flight-critical MMC parts.
Policy and standards developments are also tightening around advanced materials sustainability and critical raw materials. The EU Critical Raw Materials Regulation (EU) 2024/1252, together with the European Commission Implementing Regulation (EU) 2026/1116 (May 2026), increases attention on recovery potential across identified products and waste streams, shaping how MMC producers and end users plan material selection, scrap handling, and end-of-life pathways. On standardization, ISO technical work, including committees covering composites and reinforcement fibers and test procedures such as ISO TTA 2, continues to influence common mechanical testing and characterization approaches used in qualification programs and supplier audits.
Value Chain Analysis
The MMC value chain starts with upstream metals and reinforcement inputs (aluminum, titanium, nickel and refractory metals, plus ceramic reinforcements such as silicon carbide, aluminum oxide, and titanium carbide), followed by feedstock preparation (powders, preforms, and dispersions), where particle size distribution control and contamination management are critical. Primary manufacturing spans liquid-state routes (stir casting, squeeze casting, infiltration) and solid-state routes (powder metallurgy, mechanical alloying and related consolidation). Secondary operations include machining, joining, heat treatment, and surface finishing. Across regulated end uses, non-destructive evaluation and qualification testing become a distinct value-add step because variability in porosity and reinforcement distribution can drive rework and scrap.
Downstream, MMCs move through either direct OEM qualification (aerospace/defense, electronics thermal management) or via Tier suppliers and specialized fabricators producing brake components, housings, and heat-spreader substrates. Bottlenecks typically center on reinforcement cost volatility, repeatable process stability at scale, and access to certified capacity for high-reliability parts, which raises the role of application engineering and documented data packages. The tooling ecosystem includes additive manufacturing platform providers (LPBF, EBM, DED) and post-processing and inspection specialists, and technical emphasis is shifting toward integrating deterministic process control and data-driven optimization to improve repeatability and reduce part-level cost.
Competitive Landscape
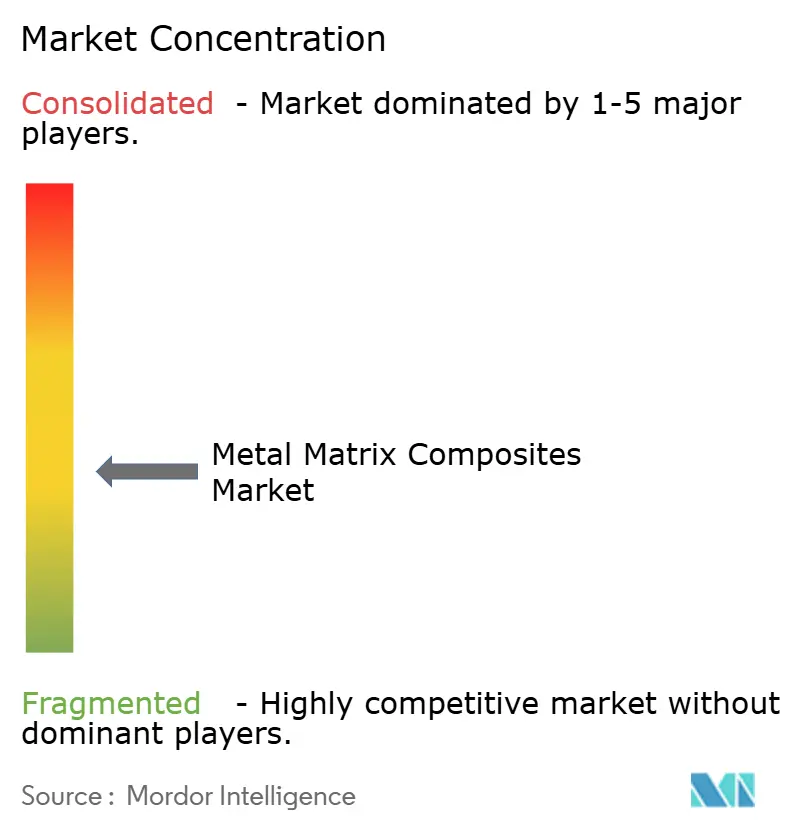
The metal matrix composites market exhibits moderate concentration: top five suppliers collectively generate close to 50% of global revenue, maintaining technological moats through proprietary powder chemistries and vertical integration. Materion dominates aluminum-scandium composites under the SupremEX brand, licensing material for both aircraft skins and EV cooling plates. CPS Technologies focuses on SiC-Al substrate panels for high-power modules, partnering with semiconductor fabs in North America and Taiwan.
3M advances ceramic nanoparticle dispersions that bolster wear resistance in brake rotors, aiding OEM platform integration. Emerging firms exploit additive-manufacturing lattices that cannot be realized via squeeze casting; Desktop Metal’s binder-jet route targets lightweight heatsinks for data centers. Several Chinese startups back-integrate into SiC powder production, lowering costs and courting automakers with aggressive pricing. Standards compliance presents an entry barrier; incumbents expedite ASTM-based qualification data packages for customers, whereas new entrants may require multi-year testing.
Supply security molds competitive strategy. Western players pursue long-term offtake agreements for U.S.-sourced bauxite, Canadian scandium, and Australian TiC feedstock, insulating defense contracts from geopolitics. Meanwhile, Asian competitors lean on domestic SiC capacity to undercut prices in commercial segments. Continuous R&D in composite metal foams and nano-laminated alloys signals incremental performance gains that will likely reshape share allocation during the next bid cycles.
Metal Matrix Composites Industry Leaders
3M
Materion Corporation
CPS Technologies
Sandvik AB
Plansee SE
- *Disclaimer: Major Players sorted in no particular order
Metal Matrix Composites Market Companies Covered in this Report
- 3A Composites
- 3M
- ADMA Products, Inc.
- CPS Technologies
- Cymat Technologies Ltd.
- Denka Company Limited
- DWA Aluminum Composites USA, Inc.
- GKN Powder Metallurgy
- Materion Corporation
- Mitsubishi Materials Corporation
- MTC Powder Solutions AB
- Plansee SE
- Sandvik AB
- Sumitomo Electric Industries, Ltd.
- TISICS Ltd.

Market Opportunities and Future Outlook
A near-term opportunity sits in scaling manufacturing routes that reduce the cost and variability associated with conventional liquid processing while preserving the thermal and mechanical benefits that support adoption in EV thermal management and high-power electronics. Published 2026 research on friction extrusion and other solid-phase or shear-based processing outlines a pathway to address MMC pain points such as reinforcement agglomeration and porosity, aligning with the need for repeatable, high-throughput production of aluminum-matrix parts used as heat spreaders, baseplates, and housings. At the same time, additive manufacturing of high-performance metal powders supports MMC-enabled architectures, including graded reinforcements and complex heat-sink geometries, where conventional machining and casting face design constraints.
Commercial whitespace is clearest where qualification-ready supply is limited relative to end-market pull, including semiconductor and power-module thermal management, aerospace and defense platforms, and specialized industrial components. CPS Technologies securing a USD 15.5 million contract (October 2025) to deliver advanced power-module components to a global semiconductor manufacturer is a direct example of how customers commit to higher-value thermal-management component supply once qualification is achieved. On production footprints, targeted investments and collaborations such as Daikin Industries investing in an aluminum-based MMC producer (November 2024) for compressor-component co-development, and Cymat Technologies pursuing Rio Tinto Alcan technology and customer transfer to establish MMC capability in Ontario, point to expanding application-driven manufacturing capacity beyond legacy aerospace and automotive programs.
Recent Industry Developments in Metal Matrix Composites Market
- June 2026: Sandvik launched Osprey GRCop-42, a copper-chromium-niobium alloy powder for additive manufacturing of demanding space components, produced at its VIGA plant in Sandviken, Sweden. The launch broadens access to high-thermal-performance copper-based feedstocks that support advanced thermal-management and space-grade component architectures, adjacent to MMC-enabled designs and qualification workflows.
- October 2025: CPS Technologies secured a USD 15.5 million contract with a global semiconductor manufacturer to deliver advanced power module components over a 12-month period beginning October 1, 2025. The award signals scaled procurement for high-reliability thermal and power-electronics hardware, reinforcing the importance of qualified composite and composite-adjacent materials supply chains into semiconductor-driven end markets.
- November 2024: Daikin Industries invested in Advanced Composite Corporation, an aluminum-based metal matrix composites manufacturer, through a third-party allocation of shares to support joint development of compressor components for HVAC and refrigeration systems. The move highlights industrial diversification of MMC use cases beyond traditional aerospace and automotive, tying MMC performance attributes to efficiency and durability requirements in rotating equipment.


Metal Matrix Composites Market Report Scope and Research Methodology
Market Definition and Coverage
This market tracks the revenues generated from metal matrix composites, meaning metal-based materials that are reinforced to improve properties such as wear resistance, stiffness, and thermal performance, and that are sold into industrial end uses.
Scope exclusions: The sizing excludes downstream finished parts where the MMC value cannot be separated from machining, assembly, or other fabrication services.
Segments Covered in This Report
- By Type
- Aluminium
- Refractory
- Nickel
- Other Types
- By Fillers
- Silicon Carbide
- Aluminium Oxide
- Titanium Carbide
- Other Fillers
- By End-user Industry
- Automotive and Locomotive
- Aerospace and Defence
- Electrical and Electronics
- Industrial Machinery
- Other End-user Industries
- By Geography
- Asia-Pacific
- China
- India
- Japan
- South Korea
- ASEAN Countries
- Rest of Asia-Pacific
- North America
- United States
- Canada
- Mexico
- Europe
- Germany
- United Kingdom
- France
- Italy
- Russia
- NORDIC Countries
- Rest of Europe
- South America
- Brazil
- Argentina
- Rest of South America
- Middle East and Africa
- Saudi Arabia
- South Africa
- Rest of Middle East and Africa
- Asia-Pacific
Data Sources, Market Sizing, and Validation
Desk Research
Desk work is used to build the first structure of the model, focusing on production context and demand anchors for MMC adoption. We rely on public sources such as USGS for metals context, US Census and UN Comtrade for trade signals where relevant, and the US Bureau of Labor Statistics for cost and inflation series, along with government or regulator publications tied to transport and aerospace manufacturing activity.
On the industry side, we review technical journals and open conference papers to understand typical reinforcement choices and processing routes, then cross-check directional demand commentary through company filings, investor presentations, and reputable press coverage. In addition, paid subscriptions for company financials and intelligence, patent databases, and an import-export shipment-level database are used selectively to confirm company footprints and spot changes in supply availability. These sources are illustrative, and other public references are also used during data collection, validation, and clarification.
Primary Interviews and Surveys
Primary work is used to pressure-test assumptions that desk research cannot fully confirm, such as pricing spreads by matrix and reinforcement, the typical application mix, and how qualification cycles affect near-term demand. We interview and survey stakeholders across the value chain (material suppliers, processors, distributors, and end users) across APAC, EMEA, and the Americas, so the final model reflects regional adoption differences and realistic ramp rates.
Distribution of primary research fieldwork respondents
| Company type | Respondent position | Region |
|---|---|---|
| Top tier: 36% | CXOs: 17% | APAC: 47% |
| Mid tier: 45% | Functional/Unit leaders: 31% | EMEA: 33% |
| Smaller Players: 19% | Managers: 52% | Americas: 20% |
Market-Sizing & Forecasting
The core model uses a top-down approach where end-use demand pools are reconstructed by region, then filtered through MMC penetration rates and realistic substitution boundaries before values are calculated. To keep the outputs grounded, we corroborate totals with selective bottom-up approximations, including rolling up sampled supplier revenues, channel checks, and volume-by-application multiplied by representative ASP ranges.
Key inputs used in the model include aerospace and defense build rates, vehicle lightweighting and electrification indicators that influence thermal management needs, estimated MMC usage intensity by application, reinforcement mix shifts (for example, silicon carbide versus aluminum oxide), and observed pricing movements for metal matrices and reinforcement materials. When company disclosures do not split MMC clearly from adjacent advanced materials, gaps are handled through product-mix discussions in primary calls and by using conservative allocation ranges that are rechecked at the regional level. Forecasts are developed using scenario analysis supported by expert views on qualification timing, capacity additions, and cost-down progress in processing routes, then reconciled into a base case consistent across regions.
Data Validation & Update Cycle
Outputs are validated through multiple checks, starting with consistency tests between regional totals and independent signals such as production activity and end-market shipment trends. If a variance looks unusual, we reopen the assumptions, recheck price and mix, and trigger targeted follow-ups with respondents to confirm whether the change is temporary.
Before sign-off, the model goes through a multi-step internal review so arithmetic, units, and currency treatment remain consistent across years. The report is refreshed annually, with interim updates when material events occur that can move supply, demand, or pricing. Right before delivery, a final analyst pass is completed so clients receive the most current view available at that time.
Mordor Intelligence's Metal Matrix Composites Market Estimate Compared With Other Published Estimates
Published MMC market numbers can differ even when the topic label looks the same, since the boundary of what counts as MMC revenue is not always consistent. Differences also come from the base year chosen, the way prices are normalized across regions, and how aggressively adoption is assumed to expand into autos, aerospace, and electronics.
Evidence like supplier revenue disclosures, end-use production signals, and reinforcement and matrix price movements are the checks that keep Mordor Intelligence tied to MMC material revenues (not fabricated components), which reduces the risk of over-counting when adjacent advanced materials are bundled together. The remaining spread usually comes down to whether studies include finished MMC parts, add broader composite categories, or apply optimistic penetration assumptions without re-validating timing through industry interviews.
Benchmark comparison
| Source | Market Size | Gaps in Research Methodology |
|---|---|---|
| Mordor Intelligence | USD 486.83 M (2025) | |
| Global Consultancy A | USD 460.90 M (2024) | Uses a different base year and may treat currency timing and inflation normalization differently, which can shift the apparent starting point when ASPs are moving. |
| Industry Publisher B | USD 1.85 B (2025) | Likely expands scope beyond MMC material revenue by folding in broader composite or finished-part value, and then applies higher penetration assumptions across end uses. |
Looking across the three figures, the biggest driver of the spread is scope, meaning whether the estimate stays at MMC material sales or extends into part-level value and adjacent composites. When the scope is kept tight and the inputs are anchored to observable end-market activity and realistic adoption timing, the resulting market size is easier to reconcile and repeat year to year.


Key Questions Answered in the Report
What is the projected value of the metal matrix composites market in 2031?
It is forecast to reach USD 706.88 million by 2031.
Which matrix type currently leads in revenue contribution?
Aluminum hold 45.55% share in 2025.
Which end-use industry will grow the fastest through 2031?
Electrical and electronics industry is expected to post a 7.56% CAGR.
Why are metal matrix composites preferred for EV thermal-management parts?
They combine high thermal conductivity with low weight, enabling battery modules to handle ≥100 W/cm² heat fluxes.
Page last updated on:


 Your data is secure and never sold or shared.


