
Medical Waste Management Market Size and Share
Market Overview
| Study Period | 2020 - 2031 |
|---|---|
| Market Size (2026) | USD 20.52 Billion |
| Market Size (2031) | USD 27.60 Billion |
| Growth Rate (2026 - 2031) | 6.11 % |
| Fastest Growing Market | Asia Pacific |
| Largest Market | North America |
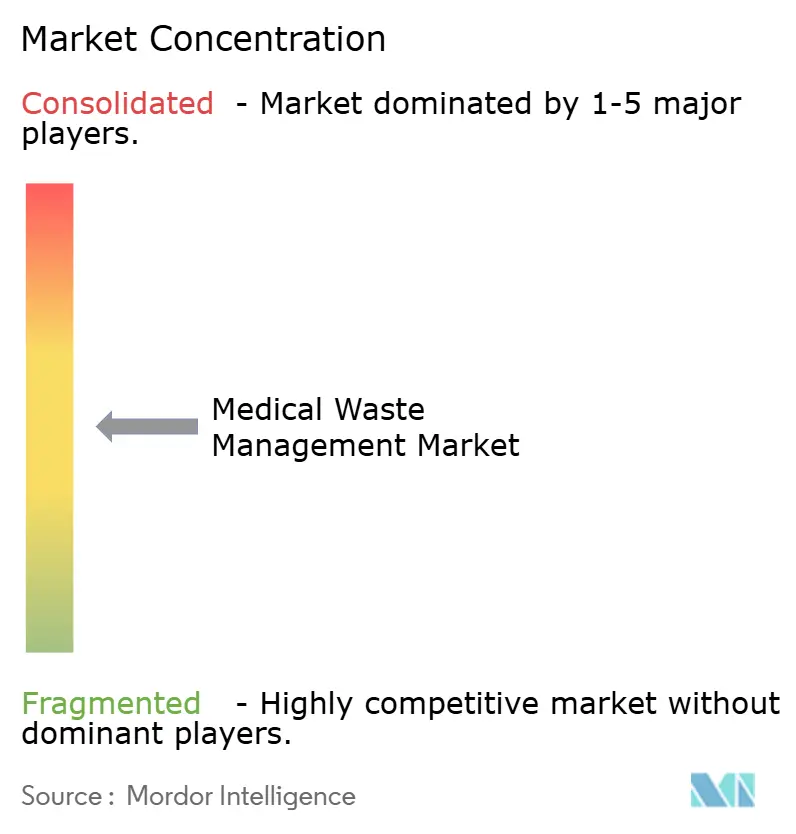
| Market Concentration | Medium |
Major Players *Disclaimer: Major Players sorted in no particular order Image © Mordor Intelligence. Reuse requires attribution under CC BY 4.0. | |
Medical Waste Management Market Analysis by Mordor Intelligence
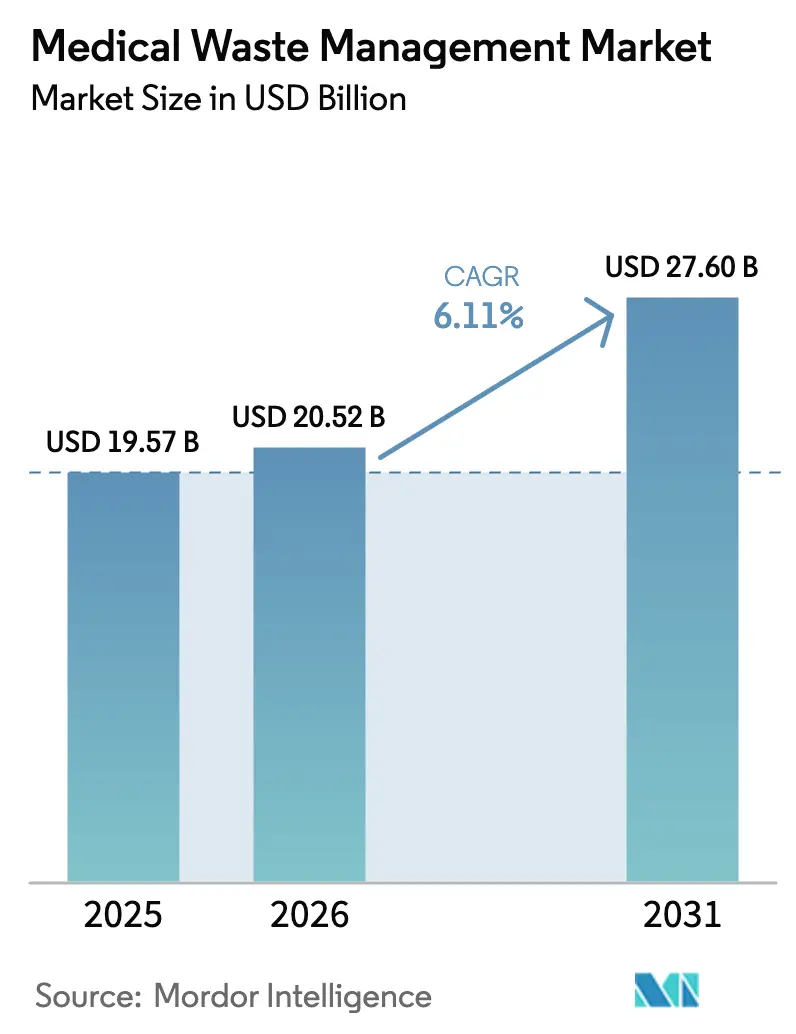
The Medical Waste Management Market size is estimated at USD 20.52 billion in 2026, and is expected to reach USD 27.60 billion by 2031, at a CAGR of 6.11% during the forecast period (2026-2031).
Rising biomedical waste volumes, stricter disposal regulations, and widening outsourcing adoption continue to propel the medical waste management market, while evolving ESG disclosure rules pressure service providers to quantify emissions. Consolidation—highlighted by Waste Management’s USD 7.2 billion purchase of Stericycle—signals a shift toward integrated environmental services, yet margin pressure persists where municipal buyers renegotiate pricing. Europe’s circular-economy mandates and California’s recycled-content laws are pushing recycling penetration, whereas digitized manifests in China and India create demand for IoT-enabled tracking solutions. Competitive differentiation is shifting from sheer route density to data transparency, onsite treatment innovation, and closed-loop recycling programs.
Key Report Takeaways
- By service, collection, transportation & storage led with a 44.26% revenue share in 2025; recycling is projected to expand at an 8.64% CAGR through 2031.
- By type of waste, non-hazardous streams accounted for 81.56% of volume in 2025, while infectious & pathological waste is forecast to grow at a 10.06% CAGR through 2031.
- By treatment site, offsite facilities held 59.27% share in 2025; onsite autoclave & microwave systems are expected to advance at a 9.91% CAGR to 2031.
- By waste generator, hospitals & diagnostic laboratories produced 61.63% of waste in 2025, while pharmaceutical & biotechnology companies are slated for an 8.85% CAGR through 2031.
- By geography, North America captured 31.76% of revenue in 2025, whereas Asia-Pacific is set to accelerate at a 9.12% CAGR through 2031.
Note: Market size and forecast figures in this report are generated using Mordor Intelligence’s proprietary estimation framework, updated with the latest available data and insights as of January 2026.
Global Medical Waste Management Market Trends and Insights
Drivers Impact Analysis*
| Driver | (~) % Impact on CAGR Forecast | Geographic Relevance | Impact Timeline |
|---|---|---|---|
| Rising volume of healthcare and biomedical waste | +1.2% | Global, with acute pressure in APAC and MEA | Medium term (2-4 years) |
| Stringent multi-jurisdictional disposal regulations | +1.0% | North America, EU, China, India | Long term (≥ 4 years) |
| Outsourcing to specialized third-party service providers | +0.9% | North America, Western Europe, urban APAC | Medium term (2-4 years) |
| Decentralized home-care and point-of-care diagnostics waste surge | +0.7% | North America, EU, Japan, Australia | Short term (≤ 2 years) |
| Biotech and cell-therapy manufacturing contamination-risk waste | +0.6% | North America, EU, Singapore, South Korea | Long term (≥ 4 years) |
| IoT-enabled traceability and ESG-reporting demand | +0.5% | Global, led by EU and North America | Medium term (2-4 years) |
| Source: Mordor Intelligence | |||
Rising Volume of Healthcare and Biomedical Waste
Global healthcare facilities generated about 2.6 million metric tons of waste in 2025, and the World Health Organization projects a 15% rise by 2030 as emerging-market bed capacity expands.[1]World Health Organization, “Health-Care Waste Fact Sheet,” WHO, who.intIndia alone added 150,000 beds in 2024, adding 82,000 metric tons of new waste streams annually. Tier-1 Chinese hospitals reported a 12% jump in infectious waste in 2025 due to rising chemotherapy and imaging volumes. These surges strain permitted treatment capacity, where new incinerator licensing often exceeds three years. Resulting spot-market price spikes encourage hospitals to explore onsite sterilization to hedge against haulage shortages.
Stringent Multi-Jurisdictional Disposal Regulations
The U.S. EPA’s 2024 revision of 40 CFR Part 60 cut particulate limits to 0.015 gr/dscf, forcing 18 incinerators to invest up to USD 5 million each in scrubbers by 2025.[2]U.S. Environmental Protection Agency, “Hospital/Medical/Infectious Waste Incinerators,” EPA, epa.gov Europe’s Waste Framework Directive requires 55% recycling by 2030, extending responsibility to non-hazardous medical packaging.[3]European Commission, “Waste Framework Directive (2024/825),” European Union, europa.eu India’s 2024 rule amendments add GPS tracking for every waste-haul vehicle, elevating costs 8%–12% for small operators. These overlapping rules reward integrated players able to amortize compliance investments, while regional haulers grapple with shrinking margins.
Outsourcing to Specialized Third-Party Service Providers
By 2025, 68% of U.S. acute-care hospitals outsourced all waste functions, up from 54% in 2020. Clean Harbors reported 11% year-over-year healthcare revenue growth in 2024 as systems bundled sharps, pharma take-back, and hazardous incineration services. The U.K.’s National Health Service awarded Veolia a GBP 1.2 billion contract covering 42 trusts, targeting 20% cost savings by centralized autoclave hubs. Outsourcing transfers liability but introduces cyber risk; Stericycle’s 2024 breach exposed 3.5 million patient records. Still, divestment of captive operations frees hospital capital for clinical upgrades.
Decentralized Home-Care and Point-of-Care Diagnostics Waste Surge
Medicare’s 2024 home-infusion reimbursement expansion drove a 22% rise in at-home intravenous therapies, each session generating up to 300 grams of contaminated tubing. Becton Dickinson shipped 18 million home sharps collectors in 2024, yet polypropylene shortages created back orders that forced hospitals to source uncertified containers. Point-of-care respiratory cartridges added 45,000 metric tons of single-use plastic in 2025, none yet recyclable. Fragmented residential pickup routes raise per-unit collection costs up to 60% versus centralized hospital loads, challenging profitability in the medical waste management market.
Restraints Impact Analysis*
| Restraint | (~) % Impact on CAGR Forecast | Geographic Relevance | Impact Timeline |
|---|---|---|---|
| High capital and operating expenditure for advanced treatment technologies | -0.8% | Global, acute in developing APAC and Africa | Long term (≥ 4 years) |
| Tightening incinerator-emission norms and public opposition | -0.6% | North America, EU, urban China | Medium term (2-4 years) |
| Consumables supply-chain disruptions | -0.4% | Global, episodic spikes in North America | Short term (≤ 2 years) |
| Informal and unregulated disposal in developing nations | -0.5% | Sub-Saharan Africa, South Asia, parts of Latin America | Long term (≥ 4 years) |
| Source: Mordor Intelligence | |||
High Capital and Operating Expenditure for Advanced Treatment Technologies
A turnkey 10-ton-per-day incinerator with gas scrubbing costs more than USD 8 million, a hurdle for municipal budgets in South Asia and Africa. Natural-gas usage for autoclaves adds USD 18 per ton, while refractory relining hits USD 400,000 every two years. India’s regulator found 38% of common treatment facilities below 60% utilization, driving per-ton costs above informal dumping rates. Microwave systems cut capex but cannot handle chemo vials, narrowing technology applicability.
Tightening Incinerator-Emission Norms and Public Opposition
California’s air district denied permits for three Los Angeles incinerators in 2024, citing particulate breaches in environmental-justice areas. The EU’s Industrial Emissions Directive now requires catalytic NOx reduction by 2028, a EUR 3–6 million outlay per plant. Litigation delayed a Pune, India project by 14 months, sending waste 180 km to the next legal facility. These headwinds favor non-thermal options, but space and labor needs rise.
*Our forecasts treat driver/restraint impacts as directional, not additive. The impact forecasts reflect baseline growth, mix effects, and variable interactions.
Segment Analysis
By Service: Logistics Complexity Anchors Collection Dominance
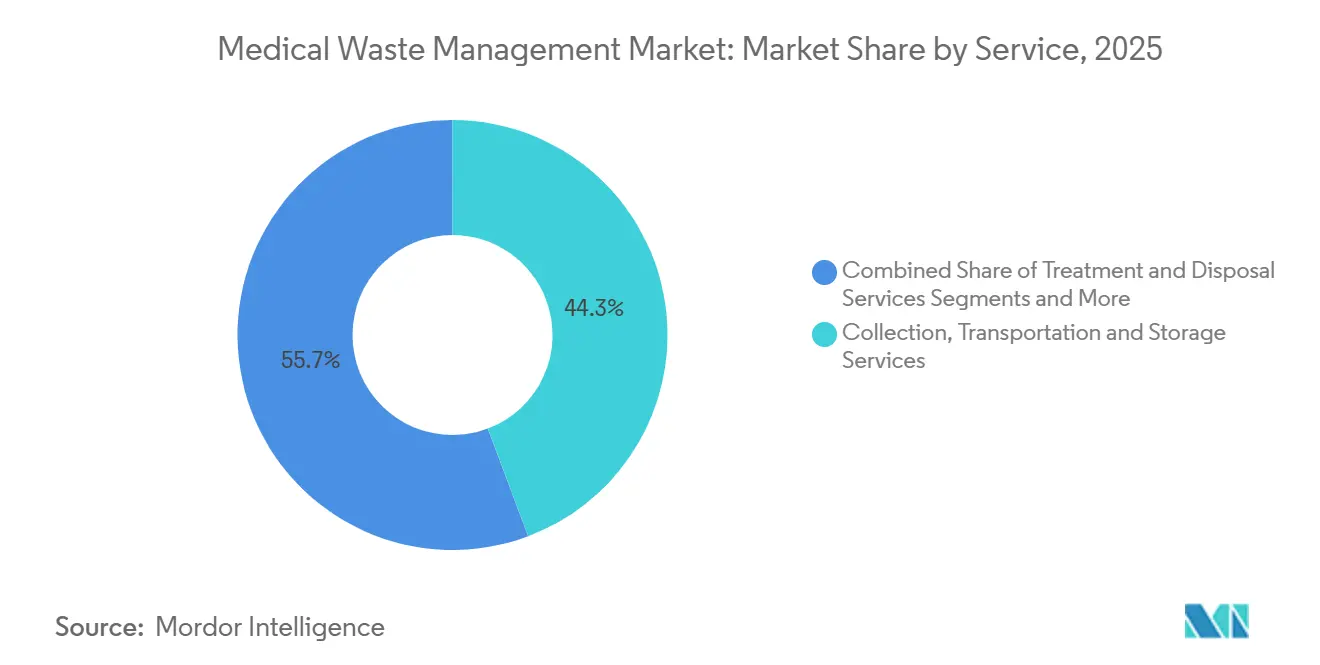
Collection, transportation, and storage generated 44.26% of revenue in 2025, underscoring the logistics intensity that keeps hospitals locked into multi-year contracts. Fuel volatility and driver wage inflation eroded margins, but route density still secures recurring cash flow in the medical waste management market. Treatment and disposal services delivered the remainder, yet commoditization looms as generic autoclave units from Chinese makers reset price floors. The medical waste management market size tied to recycling remains small today, but EU circular-economy directives and California SB 54 are stimulating 8.64% CAGR growth, a bright spot for vendors that can certify contaminant-free resins.
Recycling acceleration will spur service bundling. Republic Services’ 2024 launch of a total-waste package won 140 new ambulatory-surgery clients by integrating biohazard pickup, pharma take-back, and OSHA compliance training. At the same time, Daniels Sharpsmart’s reusable container program shows how innovation can shrink collection frequency by 25%, decoupling revenue from haulage miles while enlarging medical waste management market share among sharps generators. Extended producer responsibility schemes in France create steady funding that should elevate recycling penetration toward 30% by 2030, lifting the segment’s contribution to medical waste management market size.



By Type of Waste: Non-Hazardous Volume Masks Hazardous Margin
Non-hazardous waste held 81.56% of global volume in 2025, yet low disposal fees restrict its value share to below 40%. Infectious and pathological streams, expected to grow 10.06% annually, remain the primary profit pool for the medical waste management market. Pharmaceutical incineration capacity in the United States is limited to 47 sites, creating regional bottlenecks that push pricing premiums. Sharps waste rose to 420,000 metric tons in 2025, fueled by self-administered biologics, while safety devices increased per-needle plastic mass by 35%.
Audits find misclassification rife; 22% of supposedly non-hazardous U.K. hospital waste contained pharmaceuticals or sharps, triggering re-sorting and penalty fees. Closed-system transfer devices mandated by the FDA boost contaminated syringe counts by 18%, highlighting rising hazardous waste volumes. In turn, vendors that prove exacting segregation protocols can capture incremental medical waste management market share and command premium pricing.
By Treatment Site: Onsite Economics Shift as Technology Costs Fall
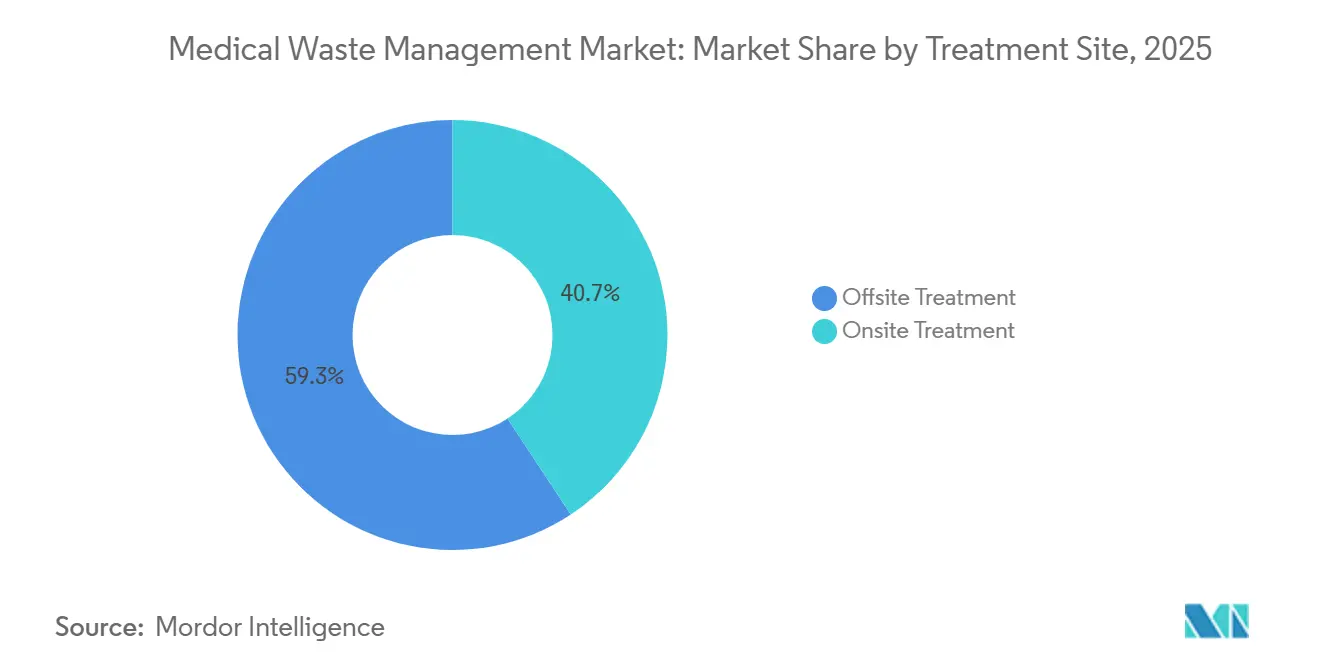
Offsite facilities processed 59.27% of waste in 2025, aided by economies of scale in 10- to 50-ton-per-day incinerators. Yet declining autoclave costs and 2024 transport bottlenecks sparked a 9.91% CAGR outlook for onsite systems. A 500-bed hospital installing a USD 600,000 autoclave achieves payback within five years at current offsite fees, reducing risk from haulage disruptions that plagued the 2024 container shortage.
Mobile treatment blurs the onsite-offsite boundary; truck-mounted autoclaves deployed in rural Texas erased 400-mile round trips for clinics. Regulatory disparities, however, complicate adoption—California allows conditional mobile permits, while New York demands fixed-facility licensing. Asia-Pacific hospitals, 73% of which lack a licensed plant within 50 km, stand to become the largest growth arena for onsite systems, expanding medical waste management market size at the local facility level.
By Waste Generator: Pharma and Biotech Complexity Commands Premium Pricing
Hospitals and diagnostic laboratories produced 61.63% of waste in 2025, yet reimbursement compression pushes administrators to renegotiate waste contracts aggressively. Pharma and biotech generators will grow 8.85% through 2031 as CAR-T and mRNA-based therapies enter commercial scale, each batch producing 300–500 kg of vector-laden waste that demands USD per-kilogram fees three to four times higher than standard streams.
Ambulatory surgery centers, tallying 28 million U.S. procedures in 2024, create intense per-procedure waste loads from disposable drapes and trays. Veterinary clinics and tattoo parlors comprise a fragmented tail with outsized compliance lapses. Biotech players such as Amgen are internalizing disposal with onsite systems that cut offsite volumes by 95%, shrinking third-party addressable medical waste management market size yet opening equipment-sales channels.
Geography Analysis
North America commanded 31.76% of the medical waste management market in 2025, but growth moderates to 4.8% CAGR as saturation and higher compliance costs converge. U.S. incinerators spent up to USD 5 million each on scrubber retrofits in 2025, passing through 8%–12% price hikes. Canada earmarked CAD 120 million (USD 89 million) to upgrade waste facilities in Indigenous territories, while Mexico digitized manifest systems, favoring multinational haulers with IT scale.
In Europe Germany, France, and the U.K. led spending as the Waste Framework Directive’s 55% recycling target for 2030 triggers investments. The U.K. consolidated NHS contracts into a seven-year GBP 1.2 billion deal, spotlighting a procurement trend toward mega-tenders. Germany’s producer-responsibility law compels device makers to fund 70% of take-back costs by 2027, shifting margin pools from haulers to recyclers and increasing medical waste management market size for circular-services providers.
Asia-Pacific is the fastest-growing region at 9.12% CAGR. China’s revised Solid Waste Law imposes CNY 1 million fines for non-digital transfer manifests, accelerating IT adoption. India’s 150,000 new beds exacerbate a capacity gap where only 62% of districts have licensed facilities, creating demand for mobile or onsite treatment. Japan recycles PVC IV bags in a pilot collecting 15,000 tons annually, while South Korea’s Waste Control Act extends producer responsibility to single-use tools. Australia targets 80% resource recovery by 2030 but grapples with dispersed hospital networks, favoring onsite autoclaves.
Middle East and Africa and South America's share, constrained by limited plant availability and informal disposal. Abu Dhabi’s AED 450 million investment in a 25-ton-per-day incinerator shows rising Gulf spending, whereas 41% of hospitals in South Africa’s KwaZulu-Natal still discard sharps as municipal refuse, signaling latent medical waste management market potential.
Mordor Intelligence provides coverage of the medical waste management market across other key regional markets, including Europe and Asia, each with their regulatory frameworks and demand patterns.


Regulatory Landscape
Medical waste regulation stays multi-layered. In the United States, state environmental and public-health programs set requirements for segregation, packaging/labeling, storage time limits, transporter registration, and permitted treatment methods, while federal rules apply for specific waste classes such as RCRA hazardous waste pharmaceuticals. A key federal anchor is the U.S. EPA final rule published December 2024 that made technical corrections to the Hazardous Waste Generator Improvements Rule and the Hazardous Waste Pharmaceuticals Rule, with subsequent effective-date adjustments in early 2025. The updates tightened compliance details, including manifest notation for non-creditable hazardous waste pharmaceuticals.
Outside the United States, World Health Organization guidance continues to inform policy and facility-level practices for infectious and pharmaceutical waste. At the same time, regional frameworks (for example, EU waste directives and national biomedical waste rules in major emerging markets) increasingly emphasize traceability and performance validation for non-incineration technologies. Stricter incineration emission controls and tighter documentation requirements are increasing the compliance premium for operators that can standardize procedures across jurisdictions and maintain audit-ready records.
Value Chain Analysis
The value chain starts with waste generation across hospitals, diagnostic laboratories, clinics, ambulatory surgical centers, and pharmaceutical and biotechnology facilities. It then moves into on-site segregation into regulated streams (infectious/pathological, sharps, pharmaceutical, and non-hazardous), along with packaging/labeling and secure interim storage. Upstream suppliers include sharps containers, liners, reusable container systems, and compliance documentation tools. Service providers then handle collection, transportation, and chain-of-custody management, which is the largest service component by revenue (44.26% in 2025) and is tied to route density and handling complexity.
Midstream and downstream steps cover treatment via autoclaving/microwaving, chemical disinfection and neutralization (notably for cytotoxic and select liquid wastes), and high-temperature incineration for streams that require destruction. Final disposal follows, either via landfill for treated residues or ash handling for combustion routes. Bottlenecks cluster around permitted capacity for specialized hazardous and pharmaceutical incineration, and local rule differences can complicate multi-site healthcare networks. Fragmented data exchange between generators, transporters, and treatment facilities also increases audit risk. To respond, integrated players bundle compliance training, tracking/manifest management, and multiple treatment endpoints, while RFID/IoT tracking and enterprise procurement standardization are used to reduce misclassification, improve traceability, and stabilize service performance across dispersed sites.
Competitive Landscape
The top five companies include Waste Management/Stericycle, Clean Harbors, Veolia, Suez, and Republic Services, along with other players. Waste Management’s 2024 Stericycle acquisition creates the largest U.S. platform but triggered divestiture of 23 routes to satisfy antitrust regulators. Logistical density, IoT-enabled tracking, and recycling integration define competition. Daniels Sharpsmart, with 47 active patents, grew to 18% of the U.S. sharps segment by saving hospitals 22% in disposal costs through reusable containers.
White-space opportunities abound in emerging markets where 58% of facilities lack safe disposal access. Mobile autoclave providers and microwave unit vendors price systems below USD 500,000, targeting hospitals without local licensed plants. Triumvirate Environmental processes 1.2 million lb of expired pharmaceuticals annually, while Cyntox markets onsite chemical neutralizers for cytotoxic waste, illustrating niche strategies.
Technology investments accelerate: GFL Environmental’s AI route optimization cut fuel usage 14% in 2024 and delivered same-day pickups for 92% of calls. Regulatory moats persist—FDA 510(k) clearance for onsite devices requires up to USD 500,000 and two years of testing, slowing new entrants but affirming medical waste management market resilience for incumbents like Sterilis.
Medical Waste Management Industry Leaders
Stericycle Inc.
Veolia Environnement SA
Waste Management Inc.
Clean Harbors Inc.
Suez Environmental Services
- *Disclaimer: Major Players sorted in no particular order

Market Opportunities and Future Outlook
Regulatory tightening and procurement consolidation are creating whitespace for operators that can deliver multi-jurisdiction compliance and end-to-end traceability, particularly where legacy paper workflows and fragmented subcontracting increase audit exposure. In the United States, EPA adjustments to hazardous waste pharmaceutical shipping requirements in the 2024-2025 window reinforce demand for standardized manifesting and documentation services, while state-by-state biomedical waste rules keep compliance-intensive routing and permitted treatment access as differentiators.
A second opportunity set is expanding treatment optionality beyond traditional offsite incineration through on-site and decentralized solutions that reduce transport dependence and support measurable environmental reporting. Ecosteryl acquiring Bertin Medical Waste (February 2026) is one concrete action supporting microwave-based disinfection and on-site capability, and major platform investments through M&A are also broadening specialized hazardous waste treatment options for healthcare generators. In emerging markets where safe disposal access remains uneven, draft rulemaking and standards development, such as South Africa publishing draft health-care risk waste norms and standards for comment (February 2026), provides clearer visibility into compliance gaps that service providers and equipment vendors can address through permitted capacity, validated non-combustion technologies, and training-led segregation programs.
Recent Industry Developments
- June 2026: Veolia completed the acquisition of Clean Earth from Enviri, expanding its US hazardous waste footprint and adding specialized treatment capabilities relevant to healthcare and pharmaceutical waste streams. The deal strengthens Veolia's ability to offer broader service bundles, including regulated medical waste adjacencies that depend on permitted hazardous treatment endpoints and national logistics coverage.
- June 2025: Veolia North America completed acquisitions totaling about USD 350 million, including New England MedWaste, which operates medical waste treatment and storage capacity in Massachusetts. The transaction activity supported footprint expansion in regulated waste handling and improved proximity to dense healthcare corridors where turnaround time and compliance documentation are central to contract wins.
- October 2024: Stericycle opened a 110,000-square-foot hospital, medical and infectious waste incineration facility in McCarran, Nevada, following a USD 110 million investment. The added permitted thermal capacity and modernized infrastructure address constraints tied to tighter emission requirements and regional disposal bottlenecks for infectious and other regulated waste streams.


Research Methodology Framework and Report Scope
Market Definition and Coverage
This market covers paid services used to collect, move, treat, and finally dispose of medical waste generated from healthcare and related facilities, with values captured in USD at service provider revenues.
Scope exclusions: This sizing excludes internal hospital labor costs and general municipal solid waste streams that are not managed under medical waste rules.
Segmentation Overview
- By Service
- Collection, Transportation & Storage Services
- Treatment & Disposal Services
- Recycling Services
- By Type of Waste
- Non-hazardous Waste
- Hazardous Waste
- Infectious & Pathological
- Pharmaceutical
- Sharps
- Other Hazardous Waste
- By Treatment Site
- Offsite Treatment
- Onsite Treatment
- By Waste Generator
- Hospitals & Diagnostic Laboratories
- Clinics & Ambulatory Surgical Centres
- Pharmaceutical & Biotechnology Companies
- Research Laboratories
- Other Generators (Blood Banks, Mortuaries, Veterinary, etc.)
- By Geography
- North America
- United States
- Canada
- Mexico
- Europe
- Germany
- France
- United Kingdom
- Italy
- Spain
- Rest of Europe
- Asia-Pacific
- China
- Japan
- India
- South Korea
- Australia
- Rest of Asia-Pacific
- Middle East & Africa
- GCC
- South Africa
- Rest of Middle East & Africa
- South America
- Brazil
- Argentina
- Rest of South America
- North America
Data Sources, Market Sizing, and Validation
Desk Research
Desk work starts by building the rules of what counts as medical waste and how it is tracked, and then it is used to set realistic ranges before interviews begin. We mainly rely on public sources such as the World Health Organization, US EPA guidance, CDC publications, the European Environment Agency, and national health and environment ministries for definitions, handling norms, and waste risk categories.
To convert those rules into usable inputs, additional references are reviewed, such as hospital and health system sustainability reports, listed company annual reports, investor presentations, reputable press coverage, and association websites covering waste services and healthcare operations. For select checks, we also use paid subscriptions for company financials and intelligence, patent databases, and shipment-level trade data when cross-border treatment equipment or consumables can shift short-term activity. The sources listed above are illustrative, and many other public documents were also reviewed for data collection, cross-checking, and clarification.
Primary Interviews and Surveys
Primary inputs come from interviews and structured surveys with waste service providers, treatment site operators, regulators, and healthcare waste managers who see actual volumes and contracting patterns. We use these conversations to validate service mix splits, typical pricing movement (including fuel and compliance cost pass-through), and the share handled through onsite versus offsite pathways across major regions.
Distribution of primary research fieldwork respondents
| Company type | Respondent position | Region |
|---|---|---|
| Top tier: 28% | CXOs: 18% | APAC: 38% |
| Mid tier: 53% | Functional/Unit leaders: 30% | EMEA: 35% |
| Smaller Players: 19% | Managers: 52% | Americas: 27% |
Market-Sizing & Forecasting
Sizing is built using a top-down reconstruction where healthcare activity and regulated waste generation indicators are translated into managed volumes, which are then valued using service-level pricing for collection, transport and storage, treatment, disposal, and recycling. To keep the totals realistic, we corroborate with selective bottom-up approximations like sampled provider revenue ranges, channel checks on contract structures, and volume times average price benchmarks in a few high-visibility countries.
Key model inputs include hospital beds and admissions, procedure and diagnostic volumes that drive sharps and infectious waste, the onsite versus offsite treatment split, treatment capacity additions and utilization signals, and average pricing by service type (often moving with fuel, labor, and compliance costs). Where direct data is thin for smaller countries, we fill gaps using peer-country proxies tied to healthcare scale and regulatory strictness, and then adjust after expert review.
For forecasting, scenario analysis is used, with base case adoption and pricing paths shaped by expert consensus on regulation enforcement, healthcare expansion, and investment in treatment capacity. The scenarios are stress-tested by varying waste generation intensity and price escalation assumptions, and then the final outlook is selected when it matches the most consistent set of demand and capacity signals.
Data Validation & Update Cycle
Validation is done by triangulating the model outputs against independent signals, such as healthcare infrastructure growth, treatment capacity announcements, and observed service pricing changes in key markets. Outliers are flagged, reviewed by another analyst, and then either corrected through assumption updates or confirmed through a follow-up call when the variance looks structural.
The report is refreshed annually, and interim updates are triggered when material events occur, such as major regulatory changes, sharp shifts in healthcare utilization, or large capacity additions. Before delivery, we do a fresh pass on recent public releases so clients receive an up-to-date view that still follows the same repeatable steps.
Mordor Intelligence's Medical Waste Management Market Size Compared Against Other Published Estimates
Published market sizes for medical waste management can look far apart because each publisher picks its own service boundaries, base year timing, and price logic, and these choices change the final value even when the growth story is similar.
The biggest gap drivers tend to be whether the number counts only regulated medical waste handling services or also folds in adjacent municipal waste services, equipment sales, or broader environmental services, and whether pricing is treated as contract revenue versus broader cost pools. Currency conversion timing, the split of onsite versus offsite treatment, and how recycling revenues are treated can also move totals, especially when the market is aggregated across regions.
Benchmark comparison
| Source | Market Size | Gaps in Research Methodology |
|---|---|---|
| Mordor Intelligence | USD 20.52 B (2026) | |
| Global Consultancy A | USD 37.45 B (2024) | This estimate appears to use an earlier base year and may include a wider set of treatment methods and related waste services, which can inflate the value when compared to a tighter regulated-service revenue view. |
| Industry Publisher B | USD 17.16 B (2024) | This figure is reported on a different start year and may apply more conservative pricing progression or a narrower counted demand pool, which can pull down totals if recycling and full service chains are not fully valued. |
The table shows the spread is driven more by year selection and scope packaging than by a disagreement on demand, and in Mordor Intelligence's model, the value is tied to service revenues across collection, transport and storage, treatment and disposal, and recycling, rather than blending in equipment sales or non-medical waste streams.


Key Questions Answered in the Report
What is the projected value of the medical waste management market by 2031?
The medical waste management market size is forecast to reach USD 27.60 billion by 2031.
Which service segment is growing fastest?
Recycling services are set to expand at an 8.64% CAGR through 2031 due to circular-economy mandates.
Which region will register the highest growth rate?
Asia-Pacific is anticipated to grow at about 9.12% CAGR as China and India tighten waste regulations.
How will onsite treatment adoption change by 2031?
Onsite autoclave and microwave systems are projected to grow at a 9.91% CAGR, eroding offsite dominance.
What impact does biotech manufacturing have on waste streams?
Each commercial cell-therapy batch generates 300–500 kg of high-risk waste, boosting demand for specialized disposal services.
Why are IoT solutions gaining traction in waste management?
Hospitals need granular carbon and compliance data, and RFID-enabled containers cut collection trips by up to 18%.
Page last updated on:





