5G IoT Market Size and Share
Market Overview
| Study Period | 2020 - 2031 |
|---|---|
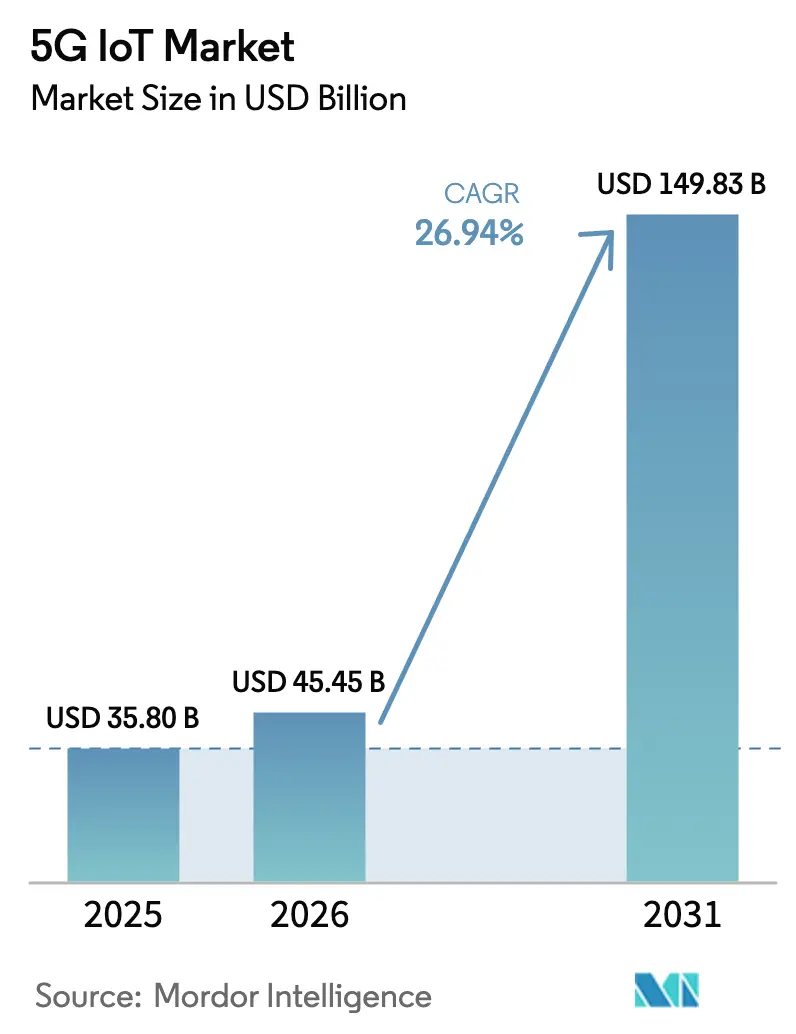
| Market Size (2026) | USD 45.45 Billion |
| Market Size (2031) | USD 149.83 Billion |
| Growth Rate (2026 - 2031) | 26.94% CAGR |
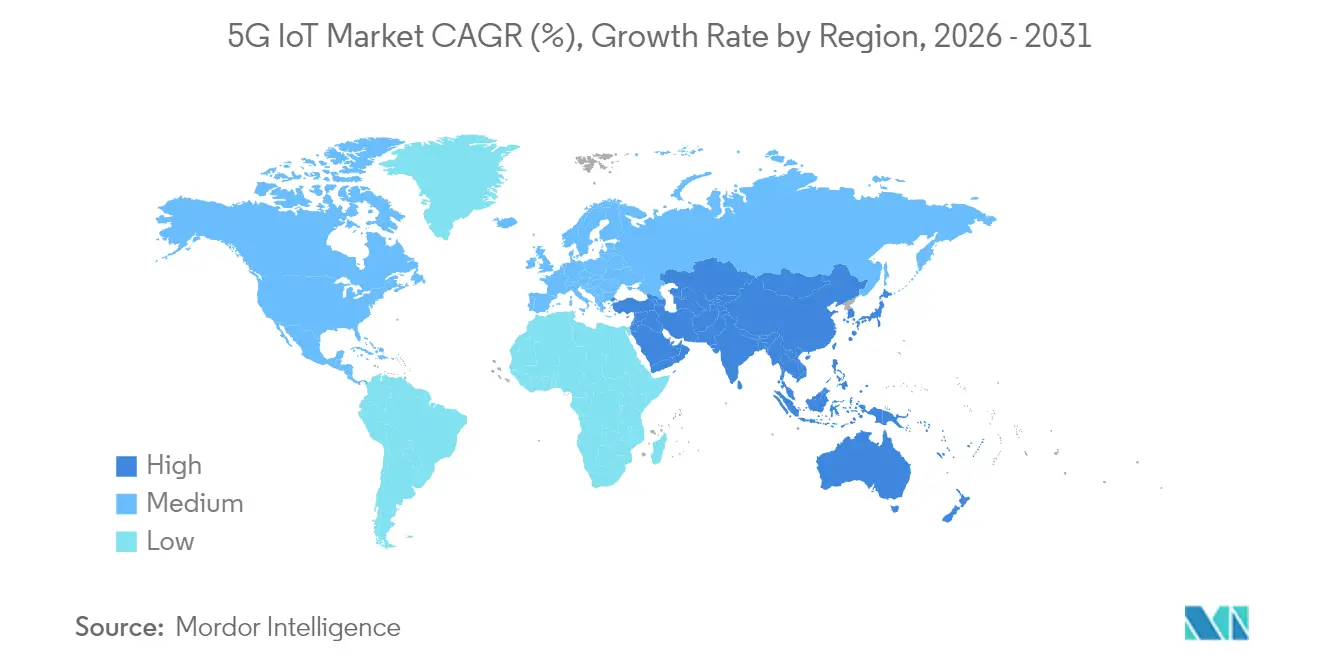
| Fastest Growing Market | Asia |
| Largest Market | Asia |
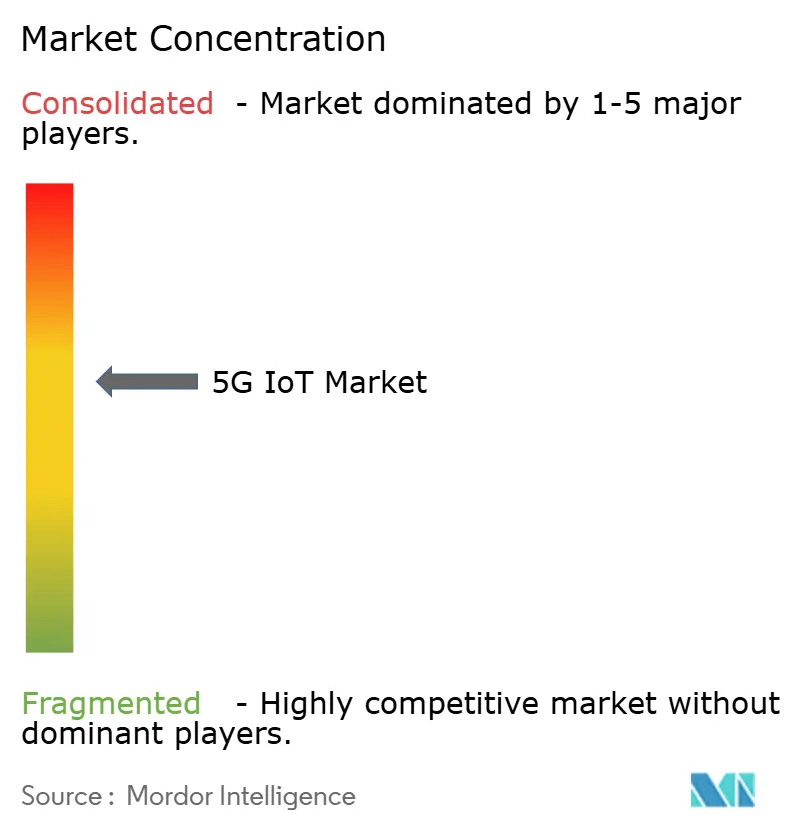
| Market Concentration | Medium |
Major Players *Disclaimer: Major Players sorted in no particular order Image © Mordor Intelligence. Reuse requires attribution under CC BY 4.0. | |
5G IoT Market Analysis by Mordor Intelligence
The 5G IoT Market size was valued at USD 35.80 billion in 2025 and estimated to grow from USD 45.45 billion in 2026 to reach USD 149.83 billion by 2031, at a CAGR of 26.94% during the forecast period (2026-2031).
RedCap technology, rolled out under 3GPP Release 17, lowers device complexity and cost, enabling the transition from consumer-centric use cases to large-scale enterprise deployments. Manufacturing, logistics, and automotive firms now justify premium connectivity fees by quantifying productivity gains from ultra-reliable low-latency communications. Governments reinforce adoption through subsidies under the US CHIPS Act and the EU’s IPCEI program, while network-API strategies help operators unlock service revenues beyond pure connectivity. Regulatory demands for supply-chain transparency and energy efficiency further accelerate the shift toward high-density device deployments that only 5G can support.
Key Report Takeaways
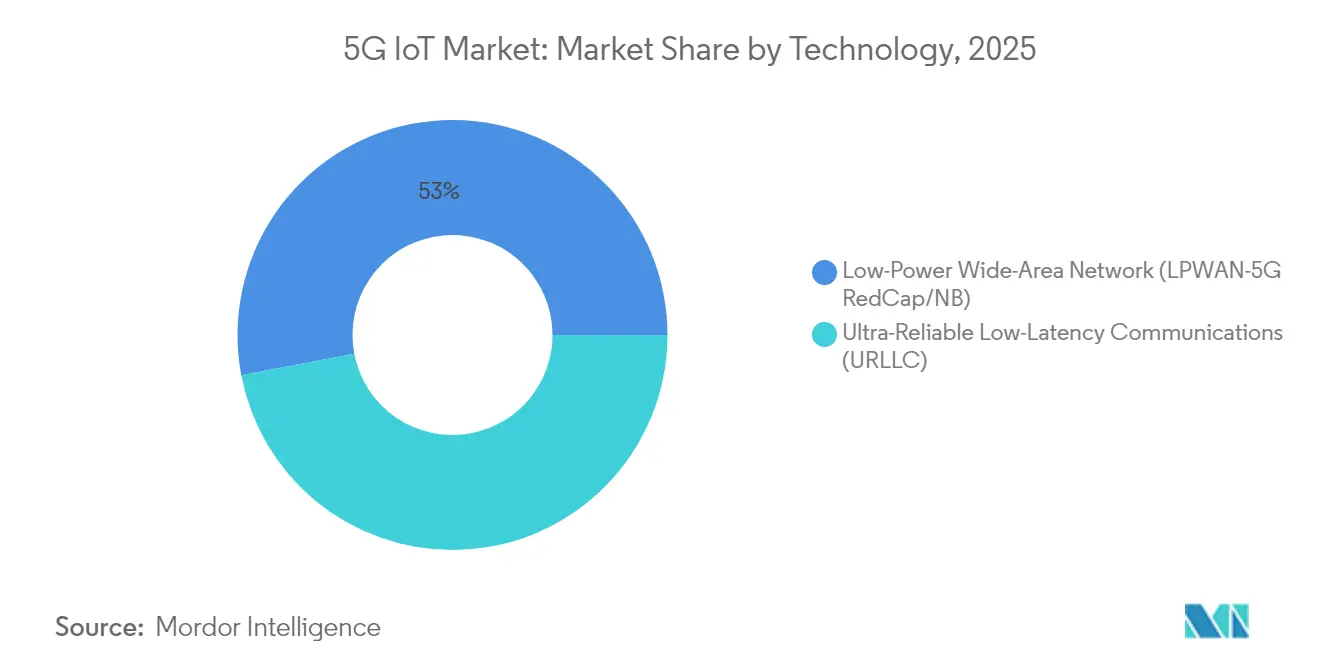
- By technology, LPWAN (5G RedCap) led with 53.00% of the 5G Internet of Things market share in 2025, while URLLC applications are forecast to expand at a 40.63% CAGR through 2031.
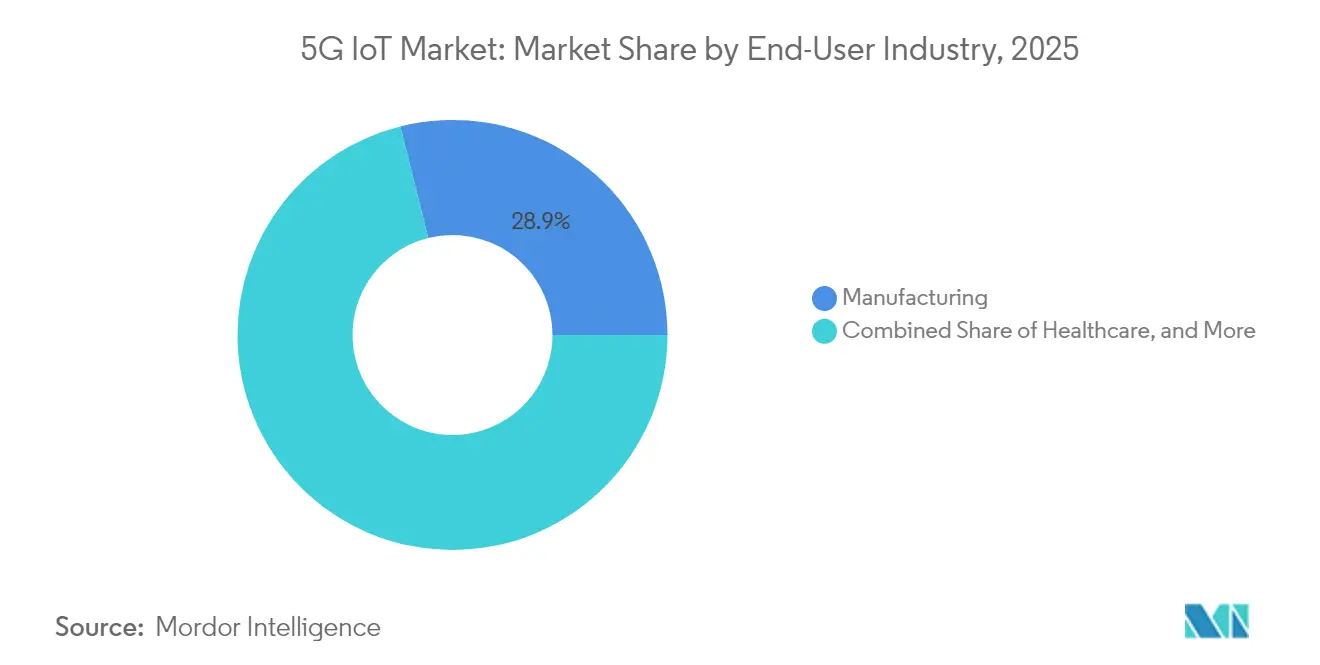
- By end-user industry, manufacturing held 28.90% of the 5G IoT market share in 2025; the automotive segment is projected to grow at 33.12% CAGR between 2026-2031.
- By geography, China accounted for 41.25% revenue share of the market in 2025, whereas India is poised for the fastest growth at 34.95% CAGR to 2031.
- Nokia, Ericsson, and Qualcomm jointly captured an estimated 32% combined share of the market size in 2024.
Note: Market size and forecast figures in this report are generated using Mordor Intelligence’s proprietary estimation framework, updated with the latest available data and insights as of 2026.
Global 5G IoT Market Trends and Insights
Drivers Impact Analysis*
| Driver | ( ~ ) % Impact on CAGR Forecast | Geographic Relevance | Impact Timeline |
|---|---|---|---|
| Massive device-density enablement after RedCap roll-out | +8.20% | Global — highest traction in China and North America | Medium term (2-4 years) |
| Telco cloud & network-API monetization playbooks | +6.10% | North America and EU; expanding to APAC | Long term (≥ 4 years) |
| 3GPP-approved reduced-capability chipsets below USD 5 | +7.40% | Global, especially India and LATAM | Short term (≤ 2 years) |
| Energy-price-linked demand for ultra-low-power modules | +4.30% | EU and North America | Medium term (2-4 years) |
| Source: Mordor Intelligence | |||
Massive device-density enablement after RedCap roll-out
Release 17 RedCap limits peak data rates to 250 Mbps and employs simpler antenna architectures, trimming module costs by 30-40%. Multi-year battery life aligns with industrial automation, smart metering, and city-wide sensing, while backward compatibility maintains nationwide coverage.[1]Rohde & Schwarz, “RedCap simplifies 5G devices,” rohde-schwarz.com
Telco cloud & network-API monetization playbooks
Cloud-native 5G cores let operators expose quality-of-service, location, and slicing functions through APIs. Enterprises pay a premium for deterministic performance, creating service revenue that offsets heavy spectrum and infrastructure investments.
3GPP-approved reduced-capability chipsets below USD 5
Silicon vendors achieve sub-USD 5 cost by stripping legacy smartphone functions, shrinking memory, and optimizing power management. The price point triggers migrations from 2G/3G to 5G in smart meters, wearables, and municipal sensors.[3]Economic Times, “Chipset vendors hit sub-USD 5 price point,” economictimes.indiatimes.com
Energy-price-linked demand for ultra-low-power modules
High electricity prices push enterprises to adopt IoT nodes with advanced sleep modes and energy harvesting. Ten-year battery life reduces truck rolls for oil-field monitoring and smart agriculture, improving total cost of ownership.[2]MDPI, “Low-power 5G module design,” mdpi.com
Restraints Impact Analysis*
| Restraint | ( ~ ) % Impact on CAGR Forecast | Geographic Relevance | Impact Timeline |
|---|---|---|---|
| 4G/LPWAN sufficiency for sub-USD 2 device classes | –4.8% | Global; highest in emerging markets | Long term (≥ 4 years) |
| Security-compliance costs (NIS2, SBOM) squeeze OEM margins | –4.1% | EU core with global ramifications | Medium term (2-4 years) |
| Source: Mordor Intelligence | |||
4G/LPWAN sufficiency for sub-USD 2 device classes
Many low-value sensors only transmit kilobytes per day; LTE Cat-1 and NB-IoT already meet such needs at half the module cost. Rural utilities and agri-tech firms therefore defer 5G upgrades until pricing aligns with value delivered.
Security-compliance costs (NIS2, SBOM) squeeze OEM margins
The NIS2 directive obliges continuous vulnerability disclosure and software bill-of-materials tracking. Compliance absorbs 9% of IT budgets and disproportionately affects small manufacturers, delaying launches of new 5G IoT devices .
*Our forecasts treat driver/restraint impacts as directional, not additive. The impact forecasts reflect baseline growth, mix effects, and variable interactions.
Segment Analysis
By Technology: RedCap Bridges Performance-Cost Gap
LPWAN (5G RedCap) captured 53.00% of the 5G market in 2025, reflecting optimum trade-offs between cost and network capabilities. URLLC, although smaller, is projected to grow at a 40.63% CAGR as factories and autonomous vehicles demand sub-1 ms latency. The 5G Internet of Things market size for LPWAN devices is projected to rise significantly as module prices fall toward USD 4 by 2027. Enterprises migrate asset-tracking and environmental-monitoring workloads from LTE Cat-1 to RedCap to leverage network slicing without incurring full 5G hardware costs. Conversely, domains such as robotic welding and remote surgery justify the premium of URLLC, driving specialized chipset innovation.
URLLC use cases frequently pair with edge-compute nodes inside private 5G networks, replacing deterministic wired Ethernet. Audi’s implementation in press-shops improved cycle times and reduced downtime, validating the business case. Component vendors compete on time-sensitive networking features and FEC schemes that guarantee packet delivery, distinguishing offers beyond bandwidth metrics. In sum, technology choice in the 5G Internet of Things market aligns with distinct latency, power, and cost envelopes instead of a one-size-fits-all roadmap.


By End-User Industry: Manufacturing Drives Enterprise Adoption
Manufacturing held 28.90% of the 5G Internet of Things market in 2025 as factories rushed to digitize supply chains and comply with EU CSRD reporting. URLLC-enabled machine vision removes bottlenecks in quality inspection, and RedCap streamlines asset tracking for pallets and tooling. The market size for manufacturing is projected to expand in step with standalone-network rollouts that support time-sensitive networking profiles.
Automotive applications form the fastest-growing segment, forecast at a 33.12% CAGR. Automakers pilot V2X safety messages, over-the-air software updates, and production-line robotics. The shift to software-defined vehicles aligns with 30-year lifecycles, making scalable connectivity essential. Healthcare and smart-city programs adopt 5G for telehealth and waste-management sensors, but volumes remain secondary to manufacturing scale. Across sectors, enterprises focus on monetizable use cases rather than blanket connectivity, solidifying a value-driven adoption model in the 5G Internet of Things market.
Geography Analysis
Asia-Pacific dominated the 5G Internet of Things market with China accounting for 41.25% of revenue in 2025, backed by operator capex and policy incentives. China Unicom plans 5G-Advanced coverage in 300 cities by end-2025, adding massive machine-type capacity and raising network utilization. Local integrators retrofit production lines in steel, textiles, and electronics, mainstreaming private-network know-how. India posts the fastest regional CAGR at 34.95% through 2031 as RedCap’s sub-USD 5 modules fit the budget of small and medium enterprises. Government programs such as Digital India and Make-in-India relax spectrum-leasing rules, accelerating campus-wide deployments in pharma, auto, and energy verticals.
North America prioritizes private-network pilots in semiconductor fabs and defense hubs, aided by CHIPS Act grants. The automotive corridor from Michigan to Texas deploys roadside V2X units and factory URLLC links, validating return-on-investment for high-bandwidth, low-latency services. Cloud hyperscalers partner with carriers to expose network APIs that let enterprises configure paths with code, shortening service-activation cycles from months to minutes. This platform's dynamic extends the 5G Internet of Things market beyond connectivity into application hosting.

Competitive Landscape
The 5G Internet of Things market remains moderately fragmented. Nokia and Ericsson ship pre-integrated private-network kits paired with edge clouds, reporting double-digit order growth. Qualcomm extends its Snapdragon X family with RedCap variants, taking IoT revenue to USD 1.55 billion in Q1 2025. Samsung, MediaTek, and Unisoc chase mid-tier industrial modems, intensifying price competition. System integrators such as JMA Wireless and Celona specialize in radio-core bundles for warehouses.
Start-ups embrace software-defined connectivity and non-terrestrial networking. Skylo raises USD 37 million to beam NB-IoT traffic via GEO satellites, targeting logistics firms that traverse coverage gaps. 1NCE exploits a one-time fee model for lifetime connectivity, boasting 18 million active SIMs across 170 countries. Patent filings surge around AI-driven link-adaptation and millimeter-wave beam tracking, as vendors vie to deliver 6G-ready hooks. Investors value recurring revenue: Wireless Logic secured a GBP 3.5 billion valuation on a minority capital injection, indicating robust confidence in horizontal IoT platforms.
End-customer preference is tilting toward outcome-based engagements. Aerospace primes order guaranteed-uptime SLAs, and mining giants procure “connectivity-as-ore-ton” contracts. Vendors who bundle hardware, software, and professional services thus defend margins even as unit prices fall. Over the forecast period, competitive advantage will hinge on vertical domain knowledge, security credentials, and ecosystem breadth inside the 5G Internet of Things market.
5G IoT Industry Leaders
Nokia
Ericsson
Huawei
ZTE
ATandT
- *Disclaimer: Major Players sorted in no particular order

Recent Industry Developments
- June 2025: Ericsson and Google Cloud unveiled a SaaS core-network platform that enables on-demand function scaling for operators.
- May 2025: Huawei deployed 100 autonomous 5G-Advanced mining trucks at Yimin Mine, demonstrating real-time route optimization.
- April 2025: 1NCE raised USD 60 million from Deutsche Telekom and SoftBank to widen global IoT software reach.
- March 2024: Honeywell and Verizon Business integrated 5G connectivity into smart meters for energy grid optimization.


Global 5G IoT Market Report Scope
The 5G IoT market involves developing, producing, and implementing 5G-enabled IoT devices, sensors, and modules that communicate seamlessly over 5G networks. These devices can range from smart home appliances and wearable gadgets to industrial sensors, connected vehicles, and infrastructure components.
The 5G IoT Market is segmented by technology (ultra-reliable low-latency communications (URLLC), low-power wide-area network (LPWAN), by end-user industry (manufacturing, supply chain, healthcare, retail, smart cities, automotive), by geography (North America (United States, Canada, Mexico, rest of North America), Europe (Germany, United Kingdom, France, Russia, Spain, rest of Europe), Asia Pacific (India, China, Japan, rest of Asia Pacific), South America (Brazil, Argentina, rest of South America), Middle East and Africa (UAE, Saudi Arabia, Africa).
The market sizes and forecasts are provided in terms of value in USD for all the above segments.
| Ultra-Reliable Low-Latency Communications (URLLC) |
| Low-Power Wide-Area Network (LPWAN 5G RedCap/NB) |
| Manufacturing |
| Supply-Chain and Logistics |
| Healthcare |
| Retail |
| Smart Cities and Infrastructure |
| Automotive and Transportation |
| North America | United States |
| Canada | |
| Mexico | |
| South America | Brazil |
| Argentina | |
| Europe | Germany |
| United Kingdom | |
| France | |
| Spain | |
| Russia | |
| Asia-Pacific | China |
| Japan | |
| India | |
| Australia and New Zealand | |
| Middle East and Africa | Middle East |
| Africa |
| By Technology | Ultra-Reliable Low-Latency Communications (URLLC) | |
| Low-Power Wide-Area Network (LPWAN 5G RedCap/NB) | ||
| By End-User Industry | Manufacturing | |
| Supply-Chain and Logistics | ||
| Healthcare | ||
| Retail | ||
| Smart Cities and Infrastructure | ||
| Automotive and Transportation | ||
| By Geography | North America | United States |
| Canada | ||
| Mexico | ||
| South America | Brazil | |
| Argentina | ||
| Europe | Germany | |
| United Kingdom | ||
| France | ||
| Spain | ||
| Russia | ||
| Asia-Pacific | China | |
| Japan | ||
| India | ||
| Australia and New Zealand | ||
| Middle East and Africa | Middle East | |
| Africa | ||


Key Questions Answered in the Report
What is the current size of the 5G Internet of Things market?
The market stands at USD 45.45 billion in 2026 and is projected to hit USD 149.83 billion by 2031.
Which segment holds the largest 5G Internet of Things market share today?
LPWAN (5G RedCap) technology leads with 53.00% share, thanks to its cost-performance balance.
Which end-user industry is growing fastest?
Automotive applications are forecast to grow at 33.12% CAGR between 2026-2031 as V2X and software-defined vehicles scale.
Why is RedCap considered pivotal for massive IoT deployments?
RedCap pares device costs below USD 5 while preserving 5G compatibility, enabling dense sensor networks across factories and cities.
How do new EU regulations influence 5G IoT adoption?
The CSRD drives demand for real-time supply-chain monitoring, while NIS2 raises compliance costs, rewarding vendors with strong security propositions.
Which region will experience the highest growth through 2031?
India leads with a 34.95% CAGR, buoyed by cost-sensitive RedCap modules and supportive digital-infrastructure policies.
Page last updated on:


