
Bot Services Market Size and Share
Market Overview
| Study Period | 2020 - 2031 |
|---|---|
| Market Size (2026) | USD 5.11 Billion |
| Market Size (2031) | USD 19.82 Billion |
| Growth Rate (2026 - 2031) | 31.20 % |
| Fastest Growing Market | North America |
| Largest Market | Asia-Pacific |
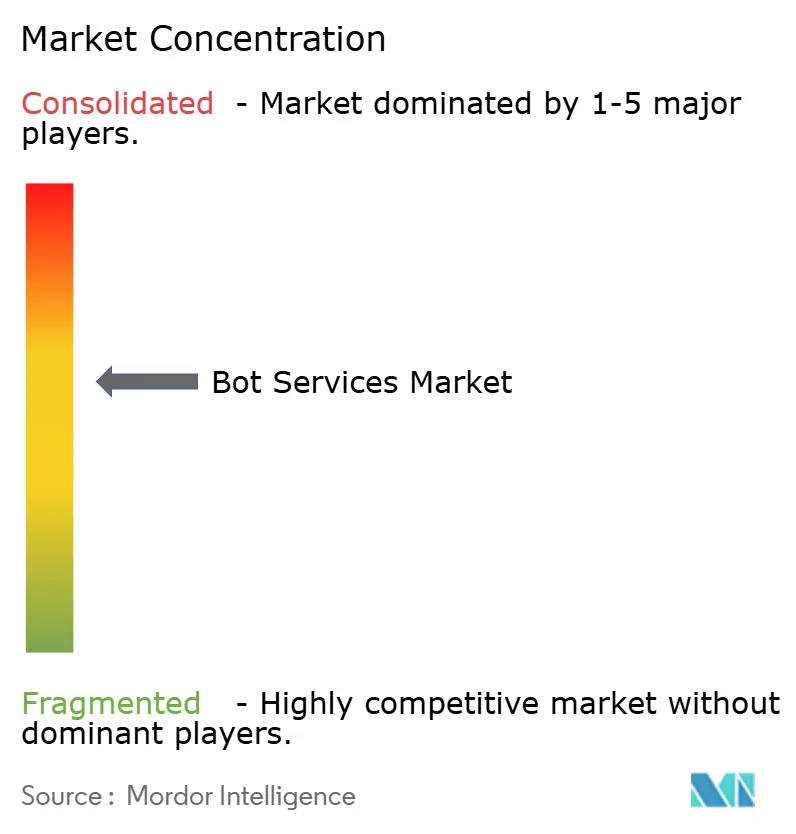
| Market Concentration | Medium |
Major Players *Disclaimer: Major Players sorted in no particular order Image © Mordor Intelligence. Reuse requires attribution under CC BY 4.0. | |
Bot Services Market Analysis by Mordor Intelligence
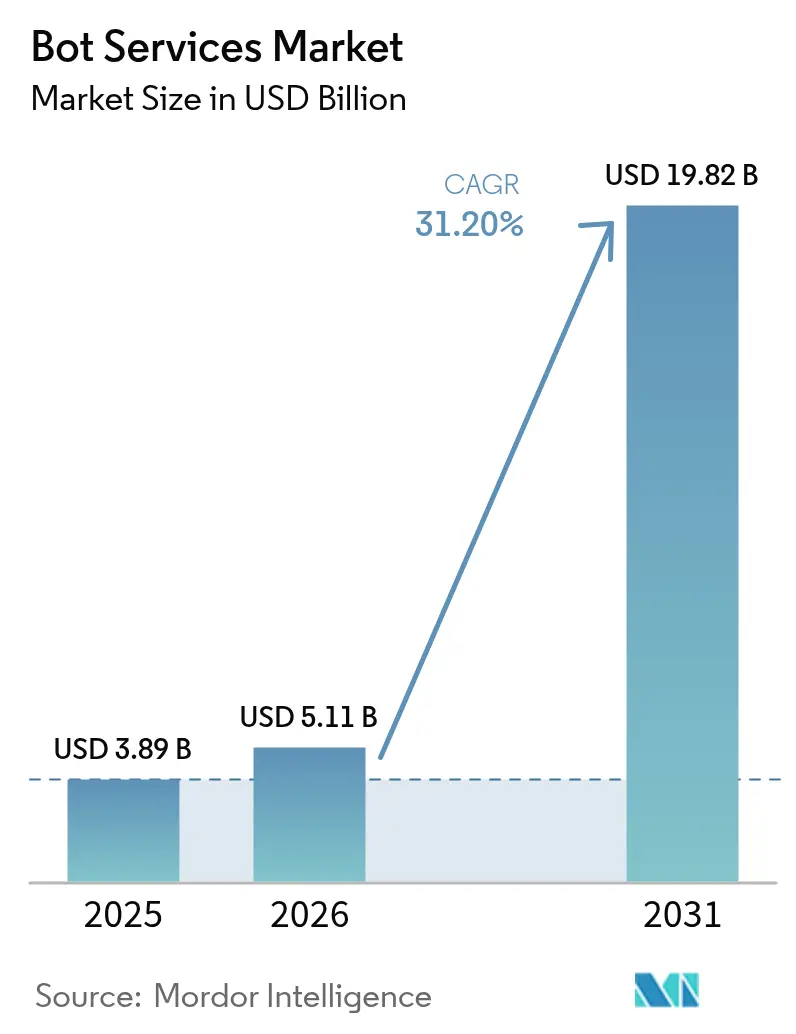
Bot Services Market size market size in 2026 is estimated at USD 5.11 billion, growing from 2025 value of USD 3.89 billion with 2031 projections showing USD 19.82 billion, growing at 31.20% CAGR over 2026-2031.
Strong enterprise demand for conversational automation, accelerating generative-AI maturity, and a steady roll-out of standardized messaging APIs underpin this trajectory. Microsoft’s USD 13 billion equity stake in OpenAI has amplified corporate confidence that scalable large-language-model (LLM) infrastructure is now a strategic capability, prompting budget shifts toward customer-facing bots. North America remains the primary revenue base, but Asia Pacific is recording the steepest adoption curve as governments allocate sizeable AI stimulus funds and as regional enterprises race to localize customer engagement in multiple languages. Across industries, the promise of 24/7, lower-cost support is motivating IT roadmaps to prioritize bot integration, even though legacy-system complexity, compliance workloads, and hallucination risk continue to temper deployment speed.
Key Report Takeaways
- By product type, text-based chatbots held 47.20% of the bot services market share in 2025, while generative-AI agents are projected to expand at a 32.05% CAGR to 2031.
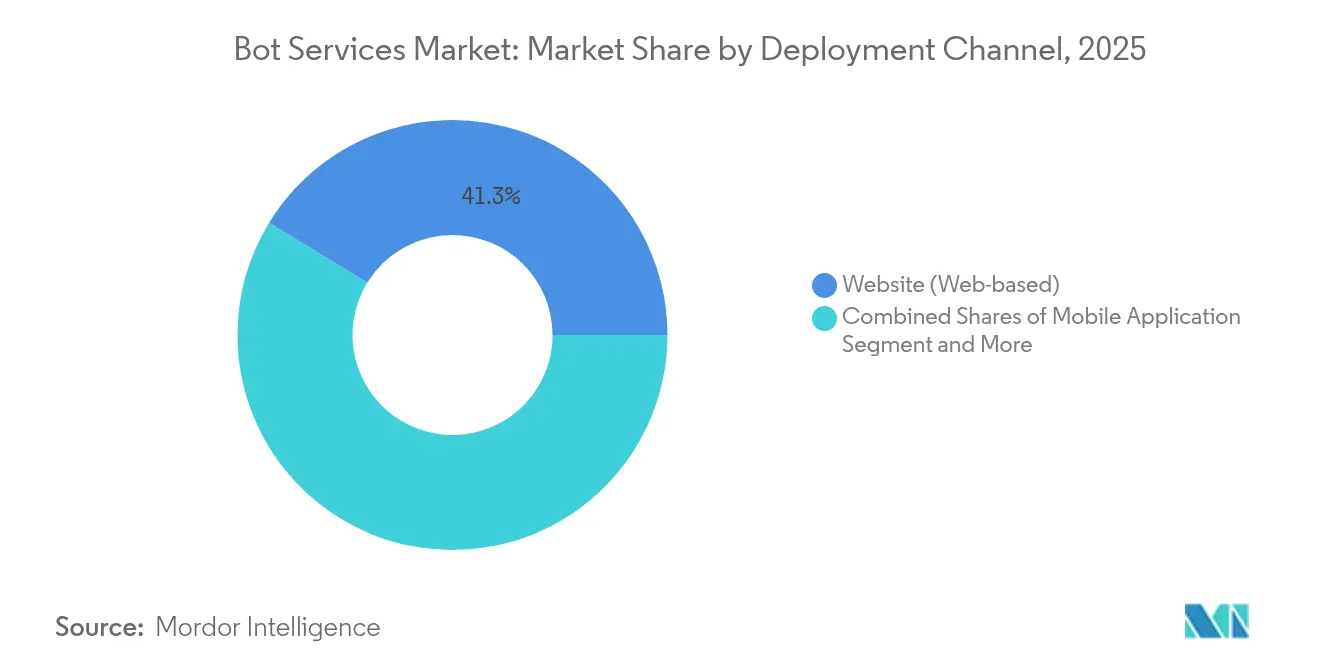
- By deployment channel, websites commanded 41.25% revenue share in 2025 in the bot services market share; mobile applications are forecast to grow 32.43% annually through 2031.
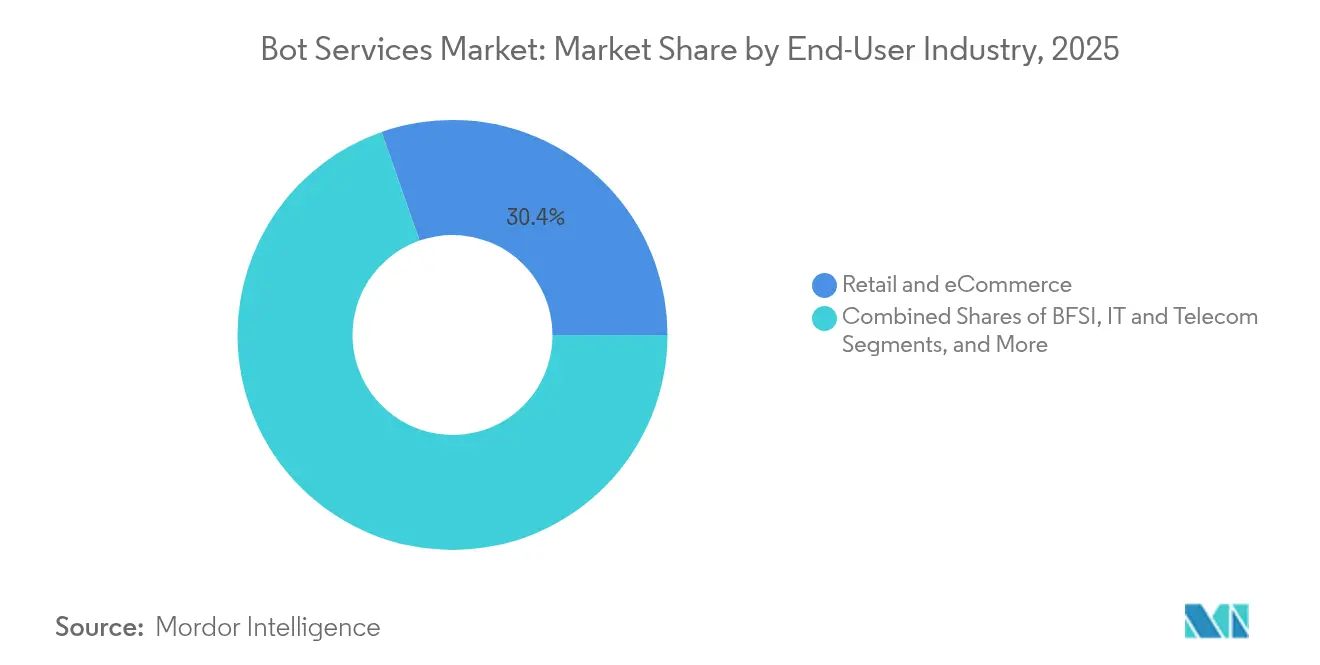
- By end-user industry, retail and eCommerce led with 30.35% revenue share in 2025 in the bot services market share; healthcare and life sciences are expected to post a 31.97% CAGR to 2031.
- By organization size, large enterprises accounted for 51.10% of the bot services market share in 2025, whereas SMEs are set to register a 32.35% CAGR during the outlook period.
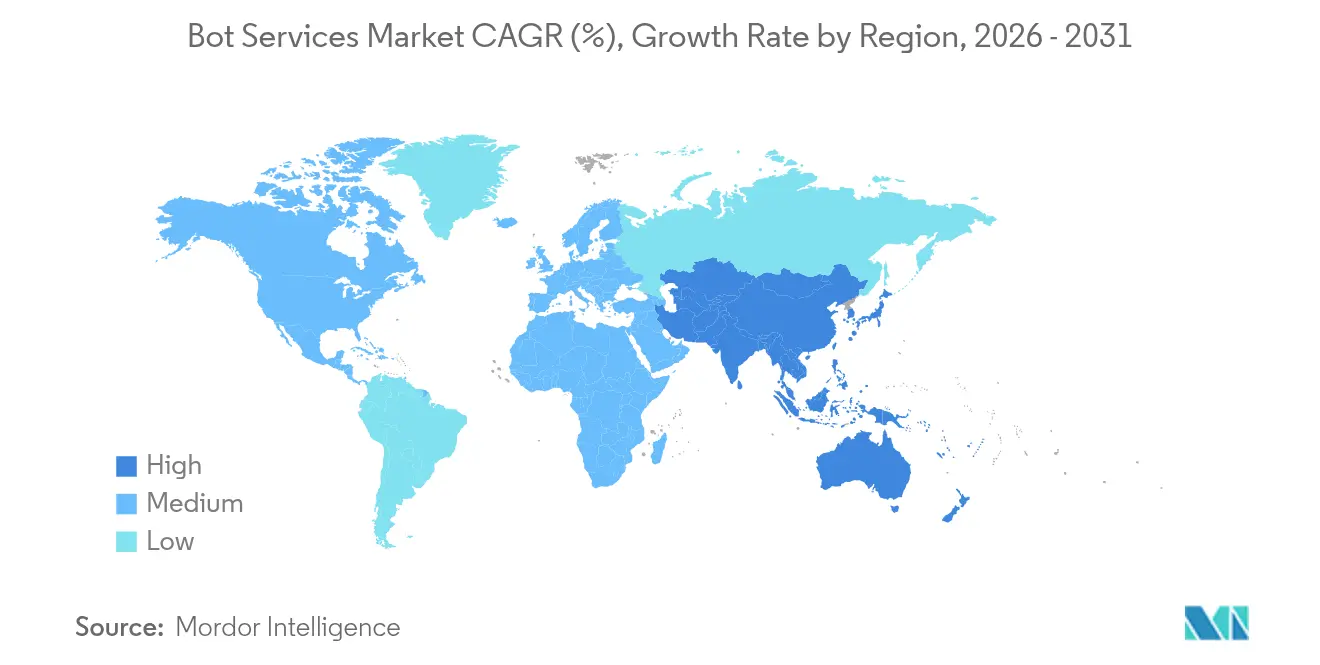
- By geography, North America contributed 30.15% revenue in 2025 in the bot services market share, yet Asia-Pacific is projected to be the fastest-growing region at 32.50% CAGR to 2031.
Note: Market size and forecast figures in this report are generated using Mordor Intelligence’s proprietary estimation framework, updated with the latest available data and insights as of 2026.
Market Trends and Insights
Drivers Impact Analysis of Bot Services Market*
| Driver | (~) % Impact on CAGR Forecast | Geographic Relevance | Impact Timeline |
|---|---|---|---|
| Proliferation of messaging-app APIs | +8.2% | Global, led by APAC and North America | Short term (≤ 2 years) |
| Generative-AI breakthroughs lowering NLP cost | +9.8% | North America and EU, spreading to APAC | Medium term (2–4 years) |
| 24/7 customer-engagement demand | +6.4% | Global | Long term (≥ 4 years) |
| Sector-specific LLM platforms | +4.1% | Primarily North America and EU | Medium term (2–4 years) |
| No-/low-code bot builders in SaaS stacks | +3.7% | Global, early uptake in North America | Short term (≤ 2 years) |
| Conversational-commerce and embedded payments | +5.3% | Core in APAC with spill-over to other regions | Long term (≥ 4 years) |
| Source: Mordor Intelligence | |||
Proliferation of messaging-app APIs
Standardized APIs from WhatsApp, Messenger, and enterprise collaboration suites now let companies embed bots directly into the channels customers already use. Microsoft tallied a 130% quarter-over-quarter jump in custom agents built via Copilot Studio, illustrating how low-friction integration accelerates adoption.[1]Microsoft Corporation, “Introducing Copilot Studio,” microsoft.com As API economies of scale grow, cost barriers for smaller firms subside, which explains why SMEs are the fastest-growing user group.
Generative-AI breakthroughs lowering cost of NLP
Pre-trained transformer models eliminate the need for custom NLP pipelines. Azure AI revenue climbed at a 175% year-over-year pace and contributed 16 percentage points to overall Azure growth in 2025. Similar momentum at Google Cloud underscores that enterprises prefer to rent advanced language capabilities rather than build them from scratch, compressing time-to-value for new bot deployments.
24/7 customer-engagement demand across industries
Healthcare networks, banks, and retailers now view always-on digital agents as an operational necessity. Patient triage, fraud alerts, and order tracking are frequent early-stage use cases, each of which reduces labor overhead and accelerates response times. This baseline expectation of immediacy is steadily migrating from consumer segments to B2B workflows.
Sector-specific LLM platforms (health, legal, etc.)
Verticalized models satisfy strict compliance and domain-specific knowledge requirements. HIPAA-aligned medical bots or regulatory-aware legal assistants command premium fees and strengthen vendor lock-in. Microsoft’s recent patent filings covering personalized assistant dialogues highlight the technical nuance involved in tailoring responses to sensitive content.
Restraints Impact Analysis of Bot Services Market*
| Restraint | (~) % Impact on CAGR Forecast | Geographic Relevance | Impact Timeline |
|---|---|---|---|
| Legacy-system integration complexity | −4.6% | Global, higher in North America and EU | Medium term (2–4 years) |
| Data-privacy and compliance hurdles | −3.8% | EU and North America | Long term (≥ 4 years) |
| Free generative bots shrinking willingness-to-pay | −2.9% | Global | Short term (≤ 2 years) |
| Hallucination and brand-risk from biased algorithms | −3.2% | Global, regulatory focus in EU | Medium term (2–4 years) |
| Source: Mordor Intelligence | |||
Legacy-system integration complexity
Mainframe-centric banks and health providers face steep interface development and security-testing cycles when grafting modern conversational layers onto decades-old cores. Microsoft’s 2024 Midnight Blizzard incident showed how compromised credentials in one system can expose data flowing into bot pipelines, reaffirming the need for rigorous hardening.
Data-privacy and compliance hurdles
The EU AI Act, effective August 2024, obliges providers to publish model documentation and perform risk assessments before go-live, stretching development timelines.[2]European Commission, “EU AI Act – Official Journal,” europa.eu Similar guardrails are emerging in ASEAN, obliging multinationals to manage a patchwork of privacy audits and localization requirements.
*Our forecasts treat driver/restraint impacts as directional, not additive. The impact forecasts reflect baseline growth, mix effects, and variable interactions.
Bot Services Market Segment Analysis
By Deployment Channel:
Mobile Applications Propel Omnichannel AdoptionWebsite bots held the largest 41.25% revenue slice in 2025, underscoring enduring desktop traffic. Yet mobile applications are on track for a 32.43% CAGR as smartphone-first behavior dominates customer support touchpoints. Enterprises now orchestrate threads that begin inside an app, hop to SMS, and finish with an emailed transcript, preserving conversation state across platforms. Context hand-off relies on unified customer-data layers that tag each interaction with a persistent identifier, mitigating fragmentation. Retailers favor in-app bots that surface order statuses or process returns without redirecting users to external pages, while airlines embed voice-to-text agents to handle itinerary changes hands-free. These scenarios showcase how mobile channels lower abandonment rates and boost Net Promoter Scores. Voice and IVR remain staples in call centers but increasingly plug into the same AI backbone, letting companies train a single intent model that serves text and speech alike. The convergence of these endpoints positions mobile as the linchpin in omnichannel design, steering budget allocation toward SDKs and push-notification orchestration.



By Product Type:
Generative-AI Agents Reshape Conversational LogicText-based chatbots, bolstered by years of enterprise proof-points, generated 47.20% of 2025 revenue, yet generative-AI agents are climbing at 32.05% CAGR as firms prize contextual reasoning. Patent activity mirrors the shift: generative-AI filings ballooned from 733 in 2014 to more than 14,000 in 2023. With the bot services market size for generative-AI agents projected to outpace legacy scripted bots, vendors are fast-tracking retrieval-augmented generation (RAG) features to curb hallucinations. Voice assistants and smart-speaker deployments anchor smart-home ecosystems, but corporate uptake remains niche relative to chat-first interfaces. Most enterprises therefore blend modular NLP engines, often licensed via API calls, into in-house user-experience layers. This architecture gives teams flexibility to swap or stack models as accuracy, cost, or data-sovereignty requirements change.
By End-User Industry:
Healthcare Leads Sector-Specific InnovationRetail and eCommerce captured 30.35% revenue in 2025 by automating pre-purchase support and post-purchase logistics updates. Conversely, healthcare is forecast to post the swiftest 31.97% CAGR as providers deploy triage assistants, chronic-care check-ins, and administrative schedulers. HIPAA enforcement compels rigorous audit logging, so vendors have begun bundling encryption-at-rest and role-based access controls into turnkey templates. Financial institutions sit close behind, layering account-security questions and real-time fraud alerts atop conversational channels. Government agencies, notably in South and Southeast Asia, roll out citizen-services bots that bridge multiple dialects, underscoring the localization capacity of modern LLMs. Manufacturing and logistics firms harness plant-floor agents for equipment troubleshooting and parts inventory queries, signaling that bot utility now extends well beyond customer-service desks. While use-case diversity multiplies, lessons learned in regulated verticals often spread horizontally, raising baseline security expectations everywhere.
By Organization Size:
No-Code Tools Democratize AdoptionLarge enterprises still generate more than half of total revenue, yet SMEs exhibit the highest 32.35% CAGR as no-/low-code design studios shrink entry barriers. A typical small online merchant can now embed a checkout bot using template flows and start transacting within hours, sidestepping multi-month integration cycles that historically favored big IT budgets. Subscription-based pricing further aligns cost with transaction volume, cushioning downside risk for smaller firms. Meanwhile, corporate adopters demand multi-tenant governance, advanced analytics, and enterprise-grade service-level agreements that most start-ups lack, sustaining demand for hyperscale providers. The bifurcated needs of these two cohorts incentivize platform vendors to tier their offerings, with self-serve portals for SMEs and bespoke professional-services bundles for Fortune 500 clients.
Geography Analysis
North America Bot Services Market
North America accounted for 30.15% of 2025 revenue, buoyed by mature cloud footprints and robust capital expenditure on AI infrastructure. Microsoft reported USD 245 billion in FY 2024 sales, with cloud revenue topping USD 135 billion on 23% growth, reflecting boardroom urgency to monetize AI workloads. The United States, in particular, benefits from clear intellectual-property frameworks; the USPTO’s 2024 guidelines on AI patent eligibility have streamlined filings, encouraging proprietary bot innovations.
APAC Bot Services Market
Asia Pacific is registering the fastest 32.50% CAGR, powered by sizable government grants and a burgeoning developer ecosystem. China’s conversational-AI spend is projected to rise from USD 1.05 billion in 2023 to USD 5.19 billion by 2030, while Singapore’s SGD 1 billion AI stimulus and South Korea’s KRW 710.2 billion innovation fund are mobilizing public-private partnerships. India’s nationwide IndiaAI Mission targets USD 500 billion digital-economy value by 2025, embedding ethical-AI guidelines within every pilot to accelerate trust-based rollout.
EMEA Bot Services Market
Europe’s outlook remains regulatory-led. The EU AI Act, live since August 2024, obliges high-risk bot applications to submit conformity assessments before go-live, nudging enterprises toward providers that can furnish audit-ready documentation. Although compliance costs can curb short-term spending, they ultimately raise the switching barrier, cementing vendor-customer ties. Elsewhere, early-stage adoption is emerging in the Gulf Cooperation Council as governments deploy Arabic-language citizen portals, but infrastructure gaps continue to prolong deployment cycles across large parts of Africa.

Regulatory Landscape
Bot service providers face fast-evolving AI transparency and safety obligations, particularly where systems interact directly with consumers. In the European Union, the EU AI Act (Regulation (EU) 2024/1689), in force since August 2024, formalizes horizontal requirements such as documentation and risk management for higher-risk uses, while also setting explicit transparency duties for systems that interact with natural persons, including disclosures that users are interacting with AI (with relevant transparency provisions taking effect from August 2026). In the United States, the Federal Trade Commission has emphasized that AI-enabled customer interaction tools remain subject to Section 5 of the FTC Act, reinforcing enforcement against deceptive claims and unsafe practices alongside emerging AI-specific policy activity at the federal level.
At the subnational level, several US states are introducing chatbot-specific guardrails that translate into product requirements for bot services, such as age-related protections and self-harm/suicide escalation protocols. Examples include Colorado HB26-1263 and Washington State ESHB 2225, both effective January 1, 2027, which push vendors and deployers of conversational or companion-style AI toward stronger identity disclosure, safety monitoring, and intervention workflows. This expanding patchwork raises the value of auditable logs, configurable disclosure UX, and region-aware policy controls for global deployments.
Value Chain Analysis
The bot services value chain begins with foundational compute and model infrastructure, led by hyperscale cloud and AI platforms (Microsoft, Google, Amazon Web Services, IBM) that provide GPU capacity, foundation models, and managed AI services. On top of this layer, bot development and orchestration platforms supply builder tools, connectors, and runtime environments for multichannel deployment across web, mobile apps, social or messaging platforms, voice/IVR, and in-product widgets. System integrators and managed service providers then tailor deployments to enterprise workflows, integrating bots with identity, contact-center stacks, CRM/ERP, and data platforms, while end-user industries (notably retail and eCommerce, BFSI, and healthcare) operationalize use cases such as support automation, triage, fraud alerts, and order tracking.
Compliance and safety requirements are increasingly embedded across the chain rather than handled only at deployment. The EU AI Act regime (in force since August 2024) and the growing number of US state chatbot laws add requirements for disclosure, risk assessments, and safety protocols, which in turn drives demand for governance tooling, monitoring, and content controls within platforms as well as specialized integration services. Distribution is shaped by enterprise procurement through cloud marketplaces and SaaS subscriptions, while recurring bottlenecks center on legacy-system integration, data access permissions, and the operational overhead of documenting and testing bot behavior across jurisdictions.
Competitive Landscape
The bot services market sits in a moderate-concentration band. Microsoft secures an outsized competitive edge via its USD 13 billion OpenAI equity and exclusive GPT access, seamlessly bundled into Azure subscription tiers. Google responds with Gemini and a broadened patent portfolio that spans multimodal text-to-image capabilities, signaling a race to fuse conversational AI with immersive interfaces. Amazon leverages custom AI accelerators to reduce inference latency and cost, critical metrics for high-volume customer-service workloads, while Meta focuses on WhatsApp Business API monetization to unlock conversational commerce at scale.
Traditional enterprise software vendors differentiate through vertical templates and compliance-ready toolkits. IBM, Tencent, and Ping An collectively hold a leading share of generative-AI patent families, equipping them to license domain-specific components to third parties. Start-ups cluster around low-code orchestration, model monitoring, or bias-mitigation niches, often partnering with hyperscalers rather than attempting full-stack competition. Patent-driven moat building remains intense: the USPTO logged more than 14,000 generative-AI-related applications in 2023, up twenty-fold versus a decade earlier.
Strategic moves underscore the battle for enterprise mindshare. Microsoft’s 2025 disclosure reclassifying OpenAI funding from expense to equity investment signaled long-run integration ambitions. Google’s trademark dispute over the GEMINI name highlighted the branding stakes in an increasingly crowded market, while the USPTO’s refusal to grant a generic “GPT” mark to OpenAI set precedent for naming conventions. Collectively, these actions illustrate a landscape in which control of data, algorithms, and legal protections directly influences go-to-market strategies.
Bot Services Industry Leaders
IBM Corporation
Amazon Web Services Inc.
Microsoft Corporation
Google (Alphabet Inc.)
Oracle
- *Disclaimer: Major Players sorted in no particular order
Bot Services Market Companies Covered in this Report
- Amazon Web Services
- Microsoft
- IBM
- Oracle
- Meta (Facebook)
- Nuance Communications
- SAP
- Salesforce
- Twilio
- Zendesk
- LivePerson
- Kore.ai
- Yellow.ai
- Intercom
- Drift
- Ada Support
- ServiceNow
- Haptik
- Chatfuel
- Baidu (DuerOS)

Market Opportunities and Future Outlook
Enterprise scaling of agentic workflows is creating whitespace for bot service providers that can deliver governance, observability, and security across large fleets of agents, rather than focusing on one-off chat experiences. Microsoft reaching general availability for Agent 365 in May 2026, positioned as a centralized control plane to govern and secure AI agents, signals a shift toward standardized operating models for managing bots and agents at scale. Large rollouts reinforce this direction, including KPMG deploying Microsoft 365 Copilot to more than 276,000 professionals across 138 countries (June 2026) and Atos expanding collaboration with Microsoft to scale Microsoft 365 E7 across 56,000 employees while managing 19,000 AI agents via Agent 365 (June 2026), which raises demand for platform-grade controls, auditability, and policy-based deployment.
Regulation-driven productization is also opening opportunities for vendors that can provide configurable disclosure, safety escalation, and jurisdiction-specific controls as reusable modules. In the United States, eleven states have enacted laws regulating AI systems designed to interact with consumers, and policy trackers point to a broader pipeline of chatbot bills across additional jurisdictions, increasing demand for compliance-by-design patterns that reduce customization overhead. Public-sector and regulated-vertical deployments also highlight the need for workflow automation beyond Q&A, including the March 2026 Veterans Health Administration deployment of a Salesforce-powered agentic operating system in Slack across more than 150 VA medical and outpatient centers to automate incident response and streamline operations, supporting differentiation around secure action-taking, integration depth, and governance in high-assurance environments.
Recent Industry Developments in Bot Services Market
- July 2026: Oracle introduced an AI-native builder experience for Oracle AI Agent Studio for Fusion Applications, enabling creation and operation of Fusion Agentic Applications that execute work natively inside Oracle Fusion Cloud Applications. The release tightens the link between conversational or agent experiences and core enterprise workflows, raising the bar for bot providers on embedded integration, governance, and enterprise-grade lifecycle management.
- June 2026: IBM and Google Cloud announced a strategic partnership to scale AI with human expertise and AI-powered delivery, including a Google Cloud Practice and alignment between IBM Consulting Advantage and Google Cloud capabilities for building and governing enterprise AI agents. This expands multi-cloud routes to market for agentic solutions and increases competitive pressure on standalone bot platforms that lack deep cloud and consulting delivery ecosystems.
- May 2024: IBM expanded the watsonx portfolio on AWS and added watsonx.governance capabilities to help clients scale responsible AI. By packaging governance alongside model and platform access in a major hyperscaler environment, the move reinforced governance as a core buying criterion for enterprise bot services, not an optional add-on.


Bot Services Market Report Scope and Research Methodology
Market Definition and Coverage
This market is defined as the revenue generated from providing bot services that let users interact through text or voice across digital channels, where routine questions and tasks are handled with minimal human involvement.
Scope exclusions: Hardware-led smart speaker device sales and general-purpose contact center labor are excluded, and only the bot service layer is counted.
Segments Covered in This Report
- By Deployment Channel
- Website (Web-based)
- Mobile Application (In-app)
- Social / Messaging Platforms
- Voice / IVR Customer-Care
- Email and In-Product Widgets
- By Product Type
- Text-based Chatbots
- Voice Assistants
- Smart Speakers / IoT Hubs
- NLP Engine Licensing
- Generative-AI Agents
- By End-User Industry
- Retail and eCommerce
- BFSI
- Healthcare and Life-Sciences
- IT and Telecom
- Travel and Hospitality
- Government and Public Sector
- Manufacturing and Logistics
- By Organisation Size
- Small and Mid-sized Enterprises (SMEs)
- Large Enterprises
- By Geography
- North America
- United States
- Canada
- Mexico
- South America
- Brazil
- Argentina
- Rest of South America
- Europe
- Germany
- France
- United Kingdom
- Italy
- Rest of Europe
- Asia-Pacific
- China
- India
- Japan
- Rest of Asia-Pacific
- Middle East
- Saudi Arabia
- United Arab Emirates
- Turkey
- Rest of Middle East
- Africa
- South Africa
- Nigeria
- Rest of Africa
- North America
Data Sources, Market Sizing, and Validation
Desk Research
Desk research was used to build the base structure of the model and to keep assumptions anchored to public signals that can be checked again later. We referenced sources such as the US Census Bureau and Bureau of Labor Statistics for digital services and labor context, International Telecommunication Union indicators for connectivity, World Bank macro series for spend capacity, and OECD datasets for technology adoption proxies.
To convert these signals into a market view, public sources were paired with company filings, earnings call transcripts, product documentation, investor presentations, and credible press coverage around bot deployments and usage patterns. Patent databases were also reviewed to understand which bot capabilities are moving from experimentation to commercial rollouts. In addition, paid subscriptions focused on company financials and news were used selectively to reconcile revenue disclosures and timing. The sources listed here are illustrative, since many other references were used for collection, validation, and clarification.
Primary Interviews and Surveys
Primary work was used to pressure-test the desk assumptions on what is actually sold as a bot service, how pricing is structured, and how adoption differs by channel and end user. We spoke with a mix of service providers, platform teams, integrators, and enterprise buyers across Americas, EMEA, and APAC, so regional rollout pace, deal sizes, and replacement cycles could be compared on a like-for-like basis.
Distribution of primary research fieldwork respondents
| Company type | Respondent position | Region |
|---|---|---|
| Top tier: 38% | CXOs: 12% | APAC: 38% |
| Mid tier: 41% | Functional/Unit leaders: 34% | EMEA: 35% |
| Smaller Players: 21% | Managers: 54% | Americas: 27% |
Market-Sizing & Forecasting
Sizing starts with a top-down build where a demand pool is reconstructed by linking enterprise digital customer-interaction volumes and automation penetration, which is then translated into service spend using observed pricing constructs. Once that spine is formed, results are corroborated with selective bottom-up approximations like sampled vendor revenue disclosures, channel checks with integrators, and ASP times volume sanity checks for common bot deployments.
Key inputs used in the model include the mix of deployment channels (web, mobile app, social, and customer care), the split between chatbots and voice assistants, typical implementation and run-rate pricing, renewal and expansion patterns, and adoption intensity by end user industries such as BFSI, retail, healthcare, and IT and telecom. Where bottom-up data is patchy, gaps are handled by using conservative ranges validated in interviews, and then applied to the closest comparable cohort by region and industry.
For forecasting, scenario analysis is used around adoption pace and pricing progression, and then it is tightened using multivariate regression on drivers like digital customer engagement growth, cloud migration intensity, and industry automation priorities. After these inputs are reviewed and aligned, the final forecast curve is produced for each region and rolled up to the global total.
Data Validation & Update Cycle
Validation happens in layers so numbers are not accepted just because they fit a growth story. We compare model outputs against independent signals such as enterprise software spend direction, disclosed AI and automation budgets, and visible deployment activity across industries, and then variances are investigated until the drivers are understood.
Anomaly checks are run across regions, channels, and end users, so sudden jumps are traced back to a real assumption shift like higher automation penetration or pricing changes. This is followed by internal analyst review before sign-off. Reports are refreshed annually, and interim updates are triggered when material events occur that can move demand, pricing, or delivery capacity. Before delivery, a final pass is completed so the latest public releases and interview learnings are reflected.
Mordor Intelligence's Bot Services Market Size Versus Other Published Estimates
Published market values for bot services can look far apart because the term is used differently, and because base years and forecast windows do not line up across studies. The differences usually come from what is counted as a service, how channel and industry adoption is modeled, and how pricing is carried forward year to year.
Smart speaker device revenues sit outside Mordor Intelligence's scope, and that single exclusion can change totals in studies that blend hardware, embedded assistants, and service spend into one number. Gaps also appear when one estimate relies on a single base-year snapshot and then applies an aggressive CAGR, versus models that check adoption by channel (web, mobile, social, and customer care) and then validate spend levels with buyer and provider inputs, including currency timing and refresh cadence.
Benchmark comparison
| Source | Market Size | Gaps in Research Methodology |
|---|---|---|
| Mordor Intelligence | USD 5.11 B (2026) | |
| Global Research Publisher A | USD 4.24 B (2025) | Uses an earlier base year and a different forecast window, and the service scope is presented more broadly around chatbots and virtual assistants, which can shift what is treated as bot services versus adjacent software spend. |
| Industry Research Publisher B | USD 5.87 B (2026) | Anchors on a different base-year framing and longer horizon growth narrative, and limited public detail is provided on how channel-level adoption, pricing progression, and regional weighting were validated. |
The table shows that most of the spread is explained by scope and timing rather than a simple math error. When channel adoption and service pricing are traced back to clear inputs and checked with interviews, the final number becomes easier to repeat and to reconcile across years, which is what we aim to deliver in this study.


Key Questions Answered in the Report
How fast is the bot services market expected to grow?
The bot services market is forecast to advance at a 31.20% CAGR, scaling from USD 5.11 billion in 2026 to USD 19.82 billion by 2031.
Which region will post the highest growth rate?
Asia Pacific is projected to grow at a 32.50% CAGR through 2031, propelled by strong government AI investments and rising multilingual customer-engagement needs.
What is the largest product segment today?
Text-based chatbots currently generate 47.20% of revenue, though generative-AI agents are the fastest-growing category.
Why are SMEs adopting bots so quickly?
No-code design studios and API-based deployment cut technical barriers, pushing SME adoption to a 32.35% CAGR and letting smaller firms pursue omnichannel engagement.
How does the EU AI Act affect vendors?
The Act enforces transparency reports and conformity assessments, favoring providers that can supply auditable documentation and slowing launches that lack compliance tooling.
What are the primary obstacles to bot deployment?
Legacy-system integration and data-privacy compliance remain chief hurdles, with security incidents underscoring the need for robust governance at every interface.
Page last updated on:





