Manganese Market Size and Share
Market Overview
| Study Period | 2020 - 2031 |
|---|---|
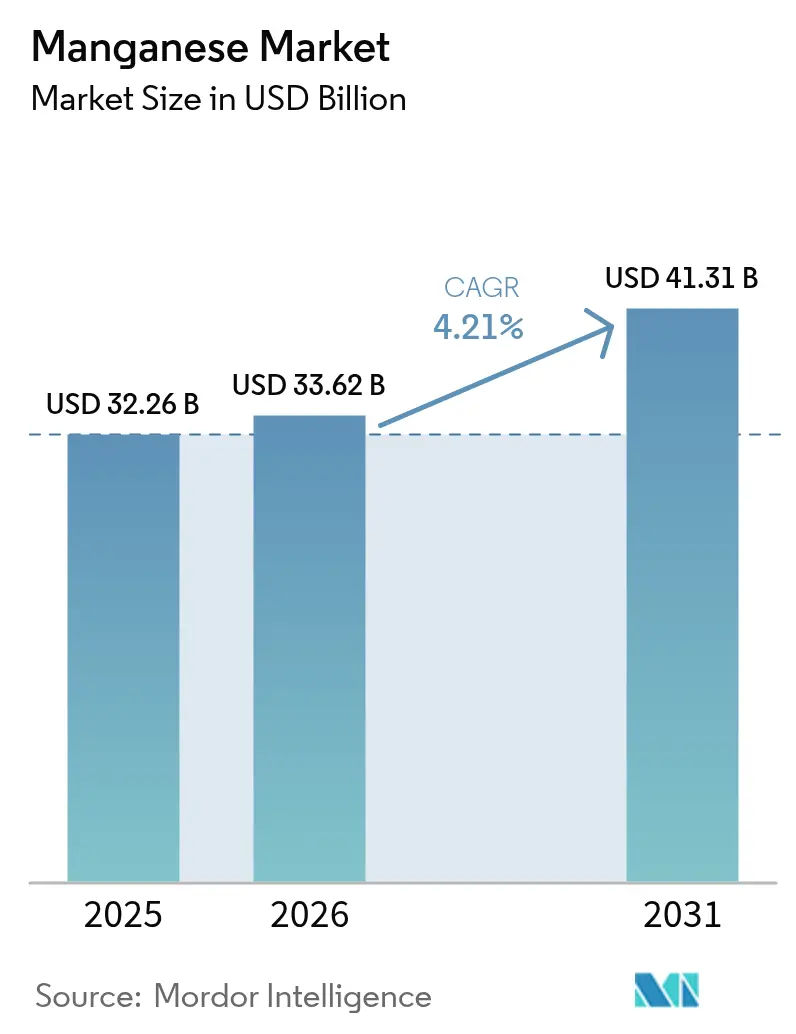
| Market Size (2026) | USD 33.62 Billion |
| Market Size (2031) | USD 41.31 Billion |
| Growth Rate (2026 - 2031) | 4.21% CAGR |
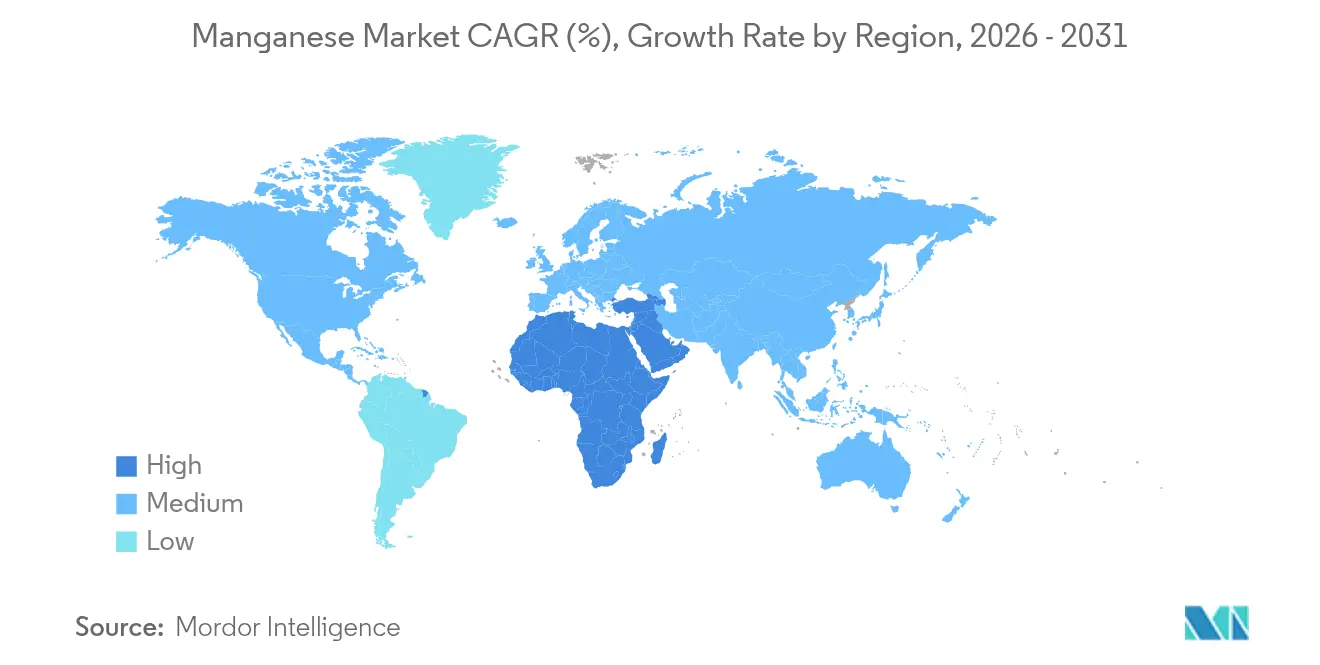
| Fastest Growing Market | Middle East and Africa |
| Largest Market | Asia Pacific |
| Market Concentration | Medium |
Major Players *Disclaimer: Major Players sorted in no particular order Image © Mordor Intelligence. Reuse requires attribution under CC BY 4.0. | |
Manganese Market Analysis by Mordor Intelligence
The Manganese market size is expected to grow from USD 32.26 billion in 2025 to USD 33.62 billion in 2026 and is forecast to reach USD 41.31 billion by 2031 at 4.21% CAGR over 2026-2031. Traditional steel-grade alloys still dominate; however, rapid growth in battery-grade and high-purity specialties is reshaping trade routes and prompting new refinery investments outside China. Cyclone damage at South32’s GEMCO mine and labor unrest in Gabon have tightened ore supply, elevating spot prices and prompting Western buyers to secure long-term contracts. Hydrogen-based direct reduced iron (DRI) projects in Europe and India are raising ferromanganese intensity per tonne of crude steel, while lithium-manganese-iron-phosphate (LMFP) cathodes for heavy-duty electric vehicles are expanding high-purity manganese demand. Governments in the United States and Saudi Arabia are subsidizing domestic ferroalloy and sulfate capacity to reduce dependence on Chinese refining, a policy trend likely to reinforce above-GDP expansion in the Manganese market.
Key Report Takeaways
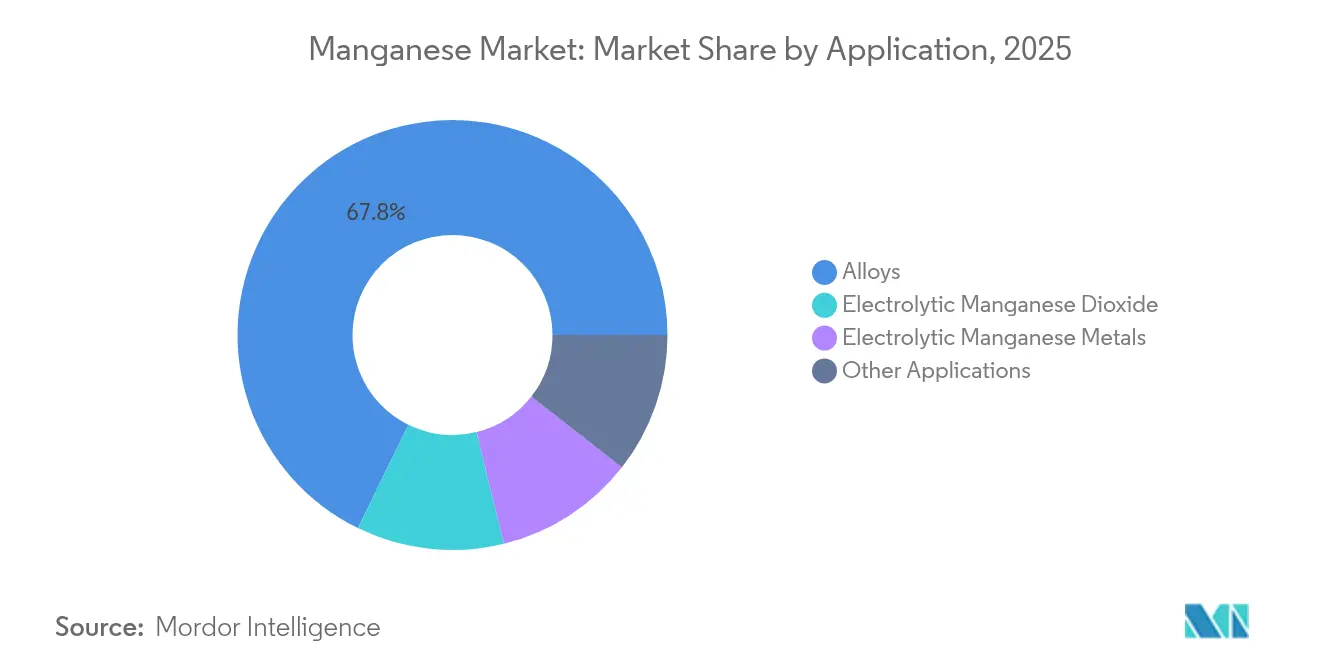
- By application, alloys led with 67.75% of the Manganese market share in 2025, while electrolytic manganese dioxide is advancing at a 6.17% CAGR through 2031.
- By end-use sector, industrial applications accounted for 46.00% of the Manganese market in 2025, and power storage and electricity are forecast to expand at a 6.34% CAGR through 2031.
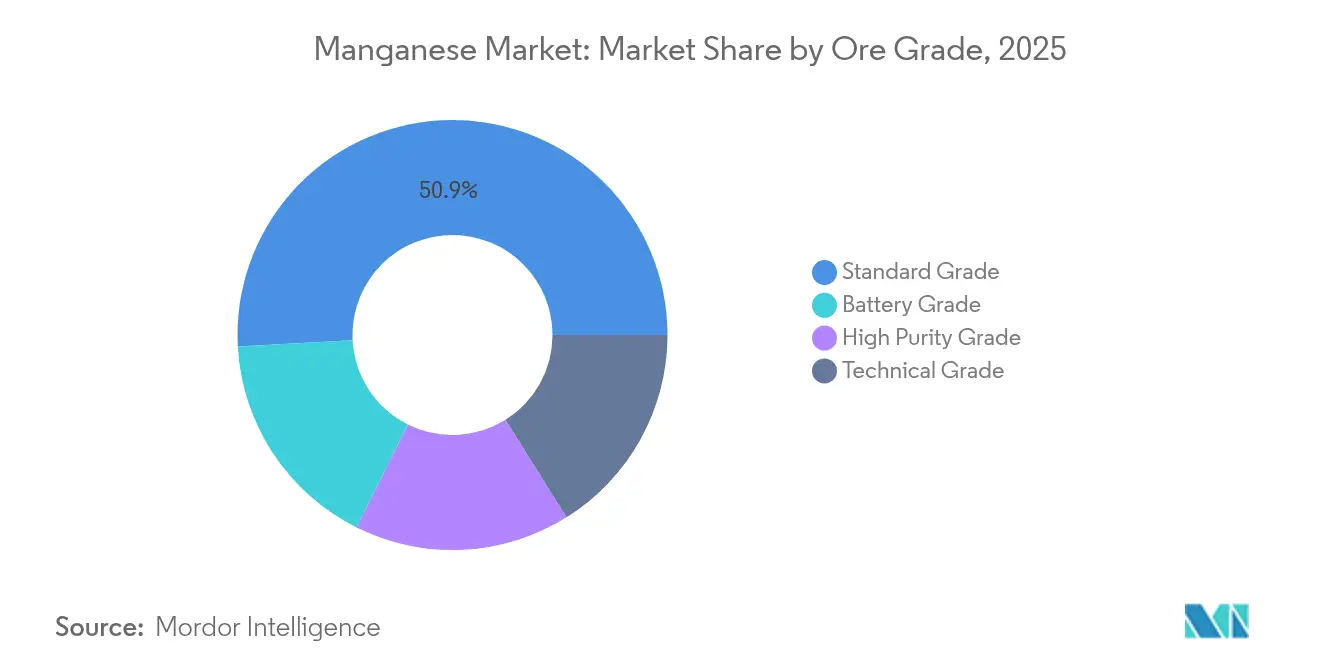
- By ore grade, standard-grade ore accounted for a 50.85% share of the Manganese market size in 2025; battery-grade ore is set to grow at a 6.44% CAGR.
- By geography, the Asia-Pacific region captured 54.20% of global demand in 2025, whereas the Middle East and Africa region is projected to post a 5.86% CAGR through 2031.
Note: Market size and forecast figures in this report are generated using Mordor Intelligence’s proprietary estimation framework, updated with the latest available data and insights as of 2026.
Global Manganese Market Trends and Insights
Drivers Impact Analysis*
| Drivers | (~) % Impact on CAGR Forecast | Geographic Relevance | Impact Timeline |
|---|---|---|---|
| Electrification of heavy-duty vehicles accelerates HP-Mn demand | +0.8% | North America, Europe, China | Medium term (2-4 years) |
| Steelmakers' switch to hydrogen-DRI raises HC FeMn intensity | +1.2% | Europe, India, Middle East | Long term (≥ 4 years) |
| Western OEM off-take deals for HPMSM diversify supply | +0.5% | North America, Europe | Medium term (2-4 years) |
| Infrastructure-grade silico-manganese demand in India and ASEAN | +0.9% | India, ASEAN core | Short term (≤ 2 years) |
| Geo-political ore disruptions (Gabon, Australia) lift prices | +0.6% | Global, with acute impact in Asia-Pacific | Short term (≤ 2 years) |
| Source: Mordor Intelligence | |||
Electrification of Heavy-Duty Vehicles Accelerates HP-Mn Demand
Heavy-duty electric trucks and buses are increasingly turning to LMFP cathodes, which have a higher manganese content than traditional LFP chemistries, effectively increasing the manganese usage per kilowatt-hour[1]International Council on Clean Transportation, “Global LDV Battery Chemistry,” ICCT, theicct.org. Element 25’s Louisiana refinery, backed by a U.S. DOE grant, will produce and supply high-purity manganese sulfate, circumventing Chinese intermediaries. In a notable shift, automakers are now willing to pay a premium for feedstock that is both traceable and low-carbon, leading to the establishment of a two-tier pricing structure in the manganese market. As a result of these developments, Western policy incentives are driving up demand for battery-grade supplies, ensuring continued growth even amid fluctuations in steel cycles. This evolving landscape is prompting traditional ore miners to either move downstream or collaborate with refiners, all in an effort to maintain their market foothold.
Steelmakers’ Switch to Hydrogen-DRI Raises HC FeMn Intensity
Hydrogen-based DRI-EAF pathways necessitate more manganese additions compared to blast-furnace routes, primarily because DRI pellets have a lower residual manganese content[2]International Energy Agency, “Iron and Steel Technology Roadmap,” IEA, iea.org. Pilot plants in Sweden and Germany validated these increased alloy additions during their 2024 commissioning. India's National Green Hydrogen Mission, which aims to boost green hydrogen production by 2030, could increase the country's demand for ferromanganese. Suppliers of ferromanganese harnessing low-carbon power are set to gain significantly, especially as EU carbon border taxes impose penalties on coal-intensive grade imports. This surge in alloy consumption not only strengthens the current market but also paves the way for the long-term growth of the Manganese market.
Western OEM Off-Take Deals for HPMSM Diversify Supply
Automakers in North America and Europe have locked in multi-year HPMSM volumes, transferring price risk to producers and underwriting new refineries in Botswana and Australia. These contracts often index prices to lithium or cobalt benchmarks, supporting bankability despite commodity volatility. The resulting supply diversification dilutes China’s significant share of refining capacity, catalyzing capital inflows to Western projects. Long-term contracts also embed ESG performance clauses, prompting miners to certify traceability and low-carbon footprints. The arrangement fosters a structurally tighter, premium-oriented battery-grade segment within the broader Manganese market.
Infrastructure-Grade Silico-Manganese Demand in India and ASEAN
India's ambitious National Infrastructure Pipeline is not just a blueprint for development; it's actively boosting steel production and driving robust growth in silico-manganese demand. Domestic furnaces have recently increased their capacity. Yet, miners continue to rely on high-grade ore imports from South Africa, a choice that notably reduces their smelting energy expenses. Similarly, projects in Indonesia and Vietnam, part of the ASEAN bloc, are echoing this trend, resulting in a collective increase in regional rebar consumption. South African suppliers, once focused on European markets, are now shifting their gaze towards Asia. This pivot is largely driven by the allure of freight premiums and the tightening grip of EU emissions regulations. Such dynamics not only underscore Asia's burgeoning dominance in the manganese market but also signal a significant realignment in global commodity flows.
Restraints Impact Analysis*
| Restraints | (~) % Impact on CAGR Forecast | Geographic Relevance | Impact Timeline |
|---|---|---|---|
| Rapid LFP adoption curbs cathode-grade Mn growth | -0.9% | Global, concentrated in China and Europe | Short term (≤ 2 years) |
| Ore-port bottlenecks in South Africa cap export volumes | -0.5% | South Africa, with spillover to Asia-Pacific importers | Medium term (2-4 years) |
| High-carbon ferroalloy CO₂-footprint faces carbon-border taxes | -0.7% | Europe, with secondary impact on exporters to EU | Medium term (2-4 years) |
| Source: Mordor Intelligence | |||
Rapid LFP Adoption Curbs Cathode-Grade Mn Growth
In 2024, passenger EV manufacturers increased the share of LFP cathodes, displacing manganese-based chemistries and casting a shadow on the immediate demand for cathode-grade materials. A rise in LFP translates to a reduction in manganese sulfate demand. Should LFP's market share continue to increase by 2028, the battery-grade manganese sector may fall short of previous projections. While producers are adapting by crafting refineries that can switch to electrolytic metals for steel additives, this added flexibility comes with a hike in capital expenses. As a result, the Manganese market's growth is being restrained, even as LMFP sees parallel advancements.
Ore-Port Bottlenecks in South Africa Cap Export Volumes
In 2024, disruptions to Transnet's rail services reduced the throughput of the Sishen-Saldanha corridor. As a result, miners resorted to trucking ore, incurring higher logistics costs. This situation weakened profit margins and diminished incentives for expansion, preventing the world's largest reserve holder from fully tapping into the prevailing demand. Meanwhile, smelters in China and Europe faced heightened freight rates and extended lead times, further tightening the supply. Although a rehabilitation initiative is in progress, significant capacity improvements aren't anticipated before the latter part of the decade. Consequently, ongoing logistical challenges are hampering the growth of ore availability and, in turn, constraining the Manganese market.
*Our forecasts treat driver/restraint impacts as directional, not additive. The impact forecasts reflect baseline growth, mix effects, and variable interactions.
Segment Analysis
By Application: Alloys Anchor Demand, EMD Gains Battery Traction
Alloys accounted for 67.75% of the manganese market demand in 2025, primarily driven by the addition of ferromanganese and silicomanganese to finished steel. With rising hydrogen-DRI capacities in Europe and India, alloy intensity has increased, supporting steady volume growth. Electrolytic manganese dioxide is poised for 6.17% growth, driven by demand from portable electronics and emerging grid-storage initiatives. Other end-uses, including feed, water treatment, and ceramics, are growing in tandem with GDP, providing volume stability to the manganese market. The resurgence of EMD is largely attributed to zinc-manganese batteries, which have caught the attention of utility-scale pilots in California's DOE. Additionally, steelmakers grappling with EU carbon tariffs are increasingly seeking certified low-carbon alloys, creating a premium niche in the broader commodity market.


By End-Use Sector: Industrial Leads, Power Storage Surges
In 2025, industrial buyers commanded 46.00%, driven by steel mills, foundries, and chemical plants, and dominated the Manganese market. While rebar consumption is buoyed by construction projects in India and the ASEAN region, growth is expected to temper after 2028, coinciding with a stabilization in China's property sector. The power storage and electricity segment emerges as the fastest-growing category, with a 6.34% growth rate. This surge is largely attributed to the adoption of LMFP cathodes and zinc-manganese stationary storage solutions. Element 25's Louisiana plant is set to bolster this segment, supplying HPMSM, thereby reinforcing the premium tier of the Manganese market. Meanwhile, the combined demand from electronics, agriculture, and ceramics is growing at rates that closely align with or slightly surpass GDP figures. As the momentum towards electrified mobility and long-duration storage accelerates, a discernible shift in demand quality is evident. This evolution not only increases the share of high-purity products but also raises the average realized prices.
By Ore Grade: Standard Grade Dominates, Battery Grade Accelerates
In 2025, standard-grade ore accounted for 50.85% of total volumes, trading at competitive prices on a CFR basis in China. Battery-grade ore, though a smaller segment, is projected to grow at a 6.44% CAGR, driven by stringent impurity standards. High-purity ore, catering to the stainless steel and electronics sectors, commands a notable market share with steady growth. Technical-grade ore, primarily linked to agriculture, operates in a low-margin niche. The pronounced price differences underscore a growing divide in the Manganese market. Key players in the battery-grade supply chain, such as Butcherbird in Australia and K.Hill in Botswana, are well-positioned to provide high-purity products, targeting Western cathode manufacturers. Meanwhile, standard-grade producers are grappling with EU carbon tariffs, which dampen the demand for coal-smelted alloys. In response, they're pivoting towards renewable-powered smelting and recycled feedstock.
Geography Analysis
The Asia-Pacific region absorbed 54.20% of the global manganese market in 2025, primarily driven by China's demand, which was largely for steel and battery materials. India, buoyed by infrastructure investments and expansions in silico-manganese at Tata Steel and MOIL, also made significant contributions. Japan and South Korea have established themselves as key players in the electrolytic manganese metal industry, exporting high-purity products throughout the region. Despite being resource-rich, Africa processed only a small portion of its manganese ore domestically, with the bulk exported, a consequence of its limited refining capacity. The Middle East and Africa Manganese market is forecast to grow at a 5.86% CAGR to 2031, driven by South Africa's efforts to alleviate rail constraints and Saudi Arabia's push for downstream investments.
North America accounted for a smaller share of global manganese demand in 2025. However, with the commissioning of Element 25’s refinery in Louisiana, the localization of battery-grade supply could bolster this share. Canada is actively pursuing manganese deposits in Quebec, while Mexican steel mills are ramping up capacity to cater to U.S. automotive clients. Europe, holding a moderate share, grapples with challenges from the Carbon Border Adjustment Mechanism (CBAM), nudging buyers towards Norwegian hydro-powered alloys and recycled feedstock. Notably, Eramet’s “eraLow” brand is capitalizing on renewable electricity to secure contracts with EU flat-steel producers.
South America, contributing a smaller portion to global manganese demand, sees Brazil leading in alloy consumption and exports from Vale’s Azul mine. Meanwhile, Argentina's burgeoning lithium sector is indirectly driving up demand for manganese, particularly for cathode precursors. With regional efforts to cultivate battery supply chains, there's potential for increased intra-continental processing, reshaping the Manganese market dynamics. The trajectory of Latin American nations moving up the value chain will hinge on infrastructure enhancements and green energy initiatives.

Competitive Landscape
The manganese market is moderately consolidated. Established majors retrofit plants to produce HPMSM, while Anglo American reviews the divestiture of certain South African manganese assets. Strategic moves focus on decarbonization and traceability. Element 25’s proprietary leach technology cuts energy use by 30%, supporting competitive cost positions despite higher Western labor expenses. White-space opportunities include recycled manganese from spent batteries and EAF dust, as well as renewable-powered smelting clusters in Norway, Brazil, and Quebec. Additionally, digital traceability systems are being developed to meet the ESG audits of automakers. Producers meeting ISO 14001 standards and offering third-party verified emissions data gain a marketing edge as downstream customers intensify Scope 3 reporting.
Manganese Industry Leaders
Eramet
South32
Assore Limited (Assmang Proprietary Limited)
Vale
CITIC LIMITED
- *Disclaimer: Major Players sorted in no particular order


Recent Industry Developments
- February 2025: Eramet launched eraLow, a brand dedicated to low-carbon dioxide (CO2) manganese alloys. With eraLow, Eramet is presenting steelmakers with an immediate opportunity to hasten the decarbonization of their offerings.
- September 2024: Botswana granted Giyani Metals a 15-year mining license for its K.Hill high-purity manganese project, paving the way for Africa’s first battery-grade Mn sulfate output.


Global Manganese Market Report Scope
The manganese market is segmented by application, end-use sector, and geography. By application, the market is segmented into alloys, electrolytic manganese dioxide, electrolytic manganese metals, and other applications. By end-use sector, the market is segmented into industrial, construction, power storage and electricity, and other end-use sectors. The report also covers the market size and forecasts for the manganese market in 16 countries across major regions. For each segment, the market sizing and forecasts have been done based on volume (tons).
| Alloys |
| Electrolytic Manganese Dioxide |
| Electrolytic Manganese Metals |
| Other Applications |
| Industrial |
| Construction |
| Power Storage and Electricity |
| Other End-use Sectors |
| Battery Grade |
| High Purity Grade |
| Standard Grade |
| Technical Grade |
| Asia-Pacific | China |
| India | |
| Japan | |
| South Korea | |
| Rest of Asia-Pacific | |
| North America | United States |
| Canada | |
| Mexico | |
| Europe | Germany |
| United Kingdom | |
| France | |
| Italy | |
| Russia | |
| Rest of Europe | |
| South America | Brazil |
| Argentina | |
| Rest of South America | |
| Middle-East and Africa | Saudi Arabia |
| South Africa | |
| Rest of Middle-East and Africa |
| By Application | Alloys | |
| Electrolytic Manganese Dioxide | ||
| Electrolytic Manganese Metals | ||
| Other Applications | ||
| By End-use Sector | Industrial | |
| Construction | ||
| Power Storage and Electricity | ||
| Other End-use Sectors | ||
| By Ore Grade | Battery Grade | |
| High Purity Grade | ||
| Standard Grade | ||
| Technical Grade | ||
| By Geography | Asia-Pacific | China |
| India | ||
| Japan | ||
| South Korea | ||
| Rest of Asia-Pacific | ||
| North America | United States | |
| Canada | ||
| Mexico | ||
| Europe | Germany | |
| United Kingdom | ||
| France | ||
| Italy | ||
| Russia | ||
| Rest of Europe | ||
| South America | Brazil | |
| Argentina | ||
| Rest of South America | ||
| Middle-East and Africa | Saudi Arabia | |
| South Africa | ||
| Rest of Middle-East and Africa | ||


Key Questions Answered in the Report
What is the current value of the global Manganese market?
The Manganese market size is expected to reach USD 33.62 billion by 2026.
How fast is demand in power-storage applications expanding?
Power storage and electricity consumption are projected to grow at a 6.34% CAGR through 2031, the fastest among end-use categories.
Which region is expected to post the quickest growth?
The Middle East and Africa region is projected to advance at a 5.86% CAGR between 2026 and 2031.
Why are hydrogen-DRI steel plants important for manganese demand?
Hydrogen-DRI processes consume more ferromanganese per ton of steel, thereby increasing long-term alloy requirements.
How will the EU’s CBAM affect manganese alloy trade?
From 2026, high-carbon ferroalloys imported into the EU will incur tariffs, advantaging low-carbon, hydro-powered producers.
Page last updated on:


