Magnetic Particle Testing (MT) Market Size and Share
Market Overview
| Study Period | 2019 - 2030 |
|---|---|
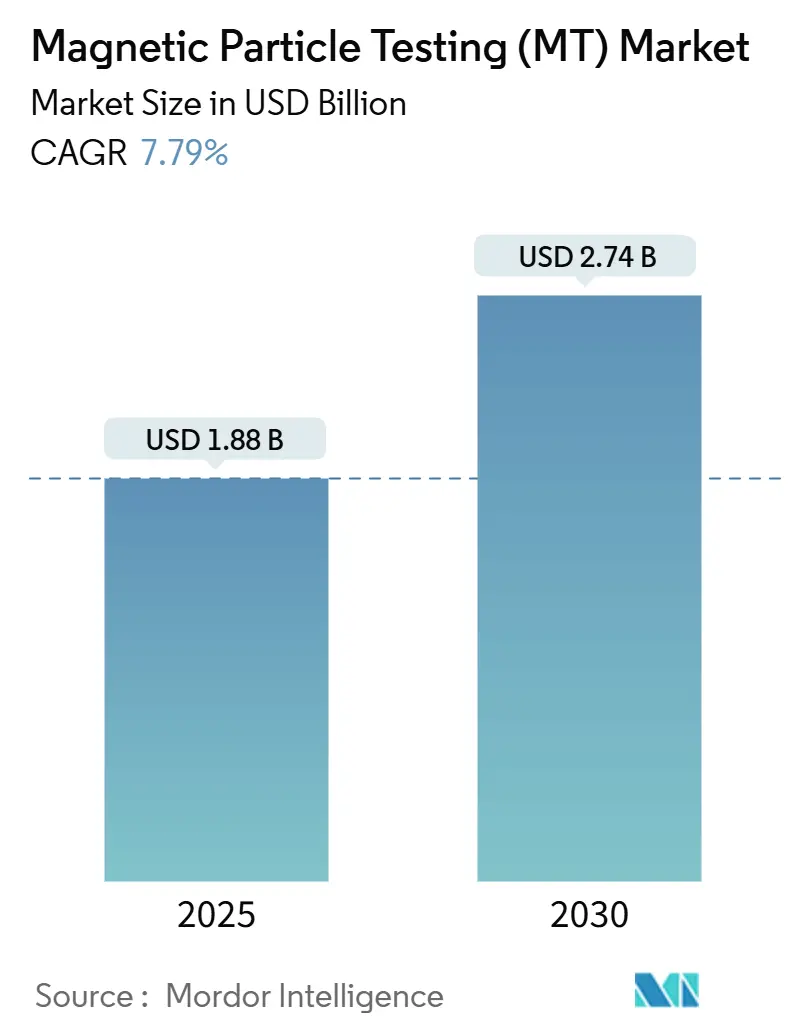
| Market Size (2025) | USD 1.88 Billion |
| Market Size (2030) | USD 2.74 Billion |
| Growth Rate (2025 - 2030) | 7.79% CAGR |
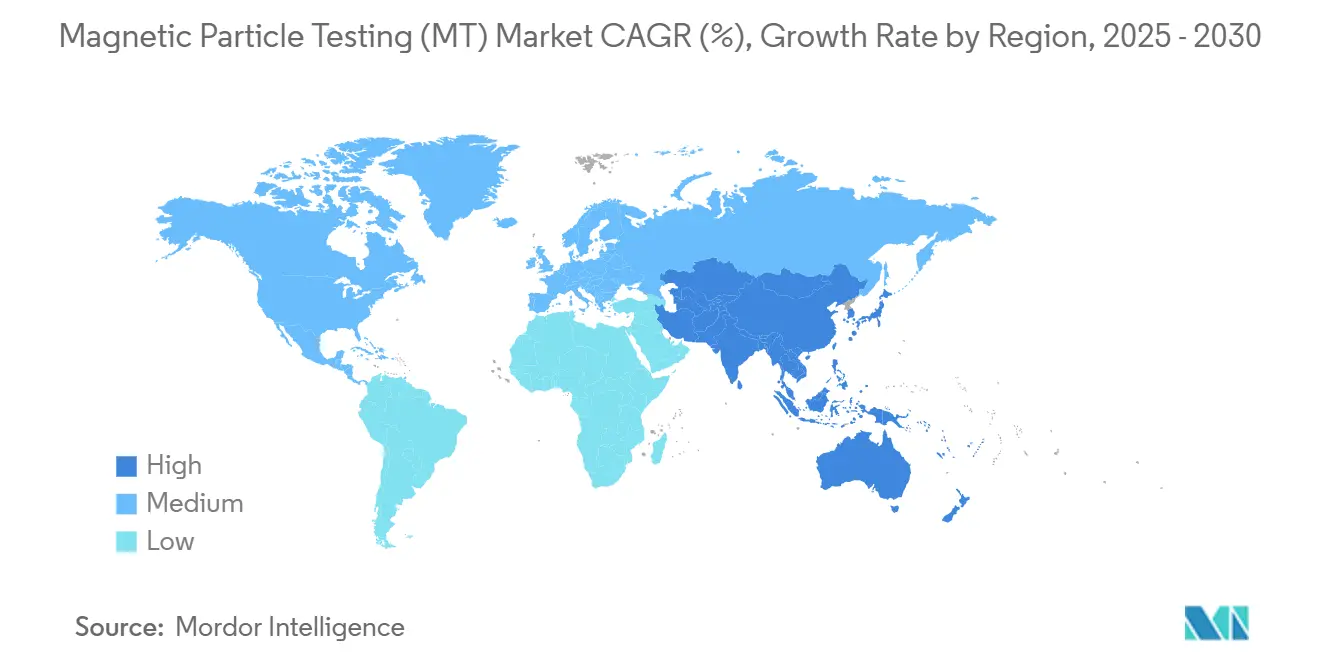
| Fastest Growing Market | Asia Pacific |
| Largest Market | North America |
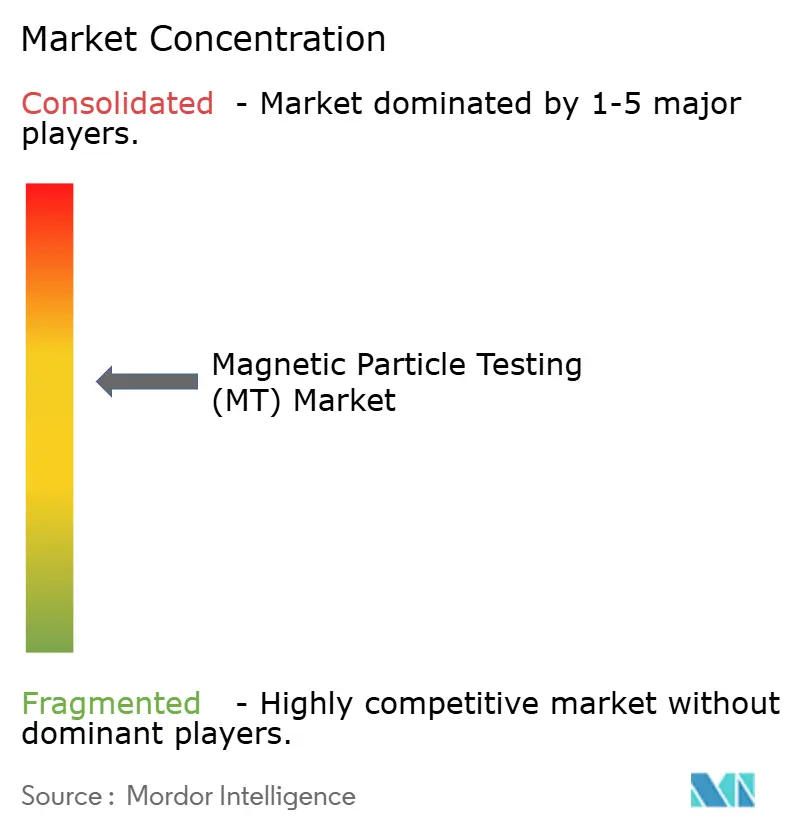
| Market Concentration | Medium |
Major Players *Disclaimer: Major Players sorted in no particular order Image © Mordor Intelligence. Reuse requires attribution under CC BY 4.0. | |
Magnetic Particle Testing (MT) Market Analysis by Mordor Intelligence
The magnetic particle testing market size reached USD 1.88 billion in 2025 and is projected to increase to USD 2.74 billion by 2030, growing at a 7.79% CAGR. Demand is expanding as operators of pipelines, pressure vessels, aircraft, and wind-energy structures strengthen inspection regimes to keep aging assets safe. Heightened weld-quality codes, growing adoption of automated inline inspection, and post-pandemic resurgence of aerospace component output are reinforcing the need for fast and reliable surface-defect detection. The magnetic particle testing market continues to benefit from stricter compliance oversight in North America and Europe. Meanwhile, the Asia-Pacific region is expected to drive the sharpest volume growth, as manufacturers in China, India, and South Korea upgrade their quality control systems. Digitally enabled equipment that feeds inspection data into predictive-maintenance platforms is becoming the competitive baseline.
Key Report Takeaways
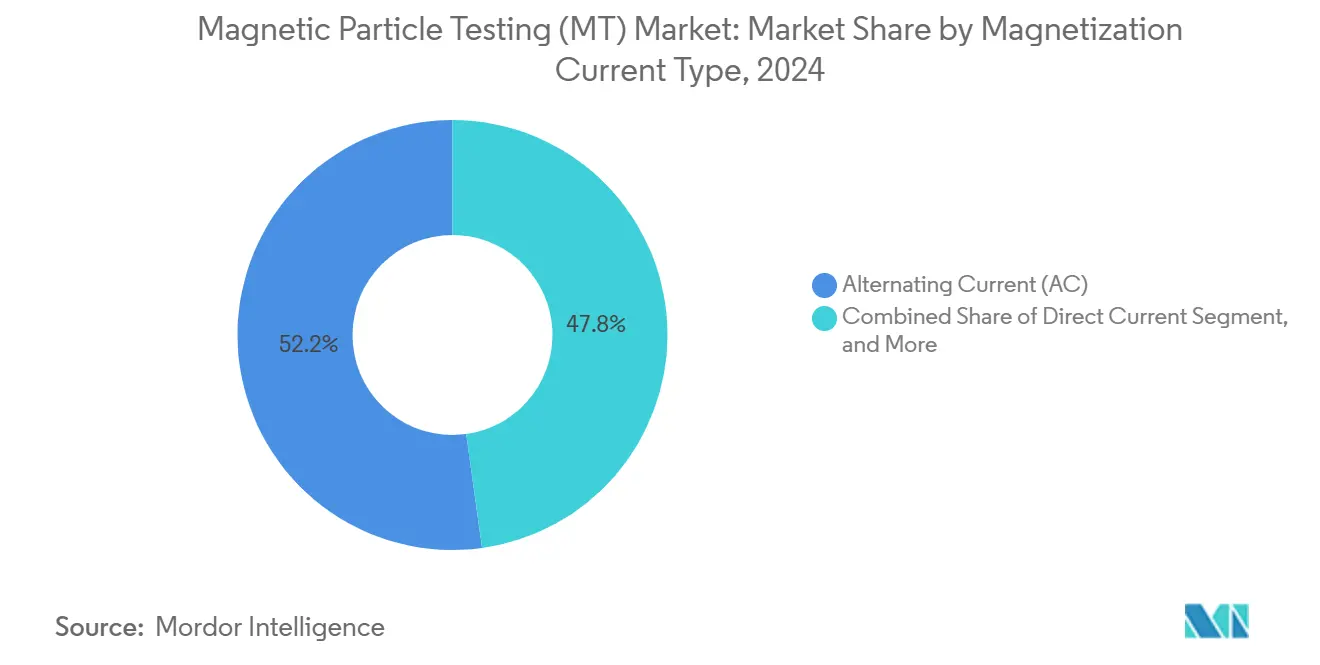
- By magnetization current type, alternating current is expected to hold a 52.2% revenue share in 2024, while half-wave direct current is projected to expand at a 9.9% CAGR through 2030.
- By portability, portable and handheld equipment accounted for 46.2% of the magnetic particle testing market size in 2024; automated and robotic lines are projected to grow at a 12.9% CAGR through 2030.
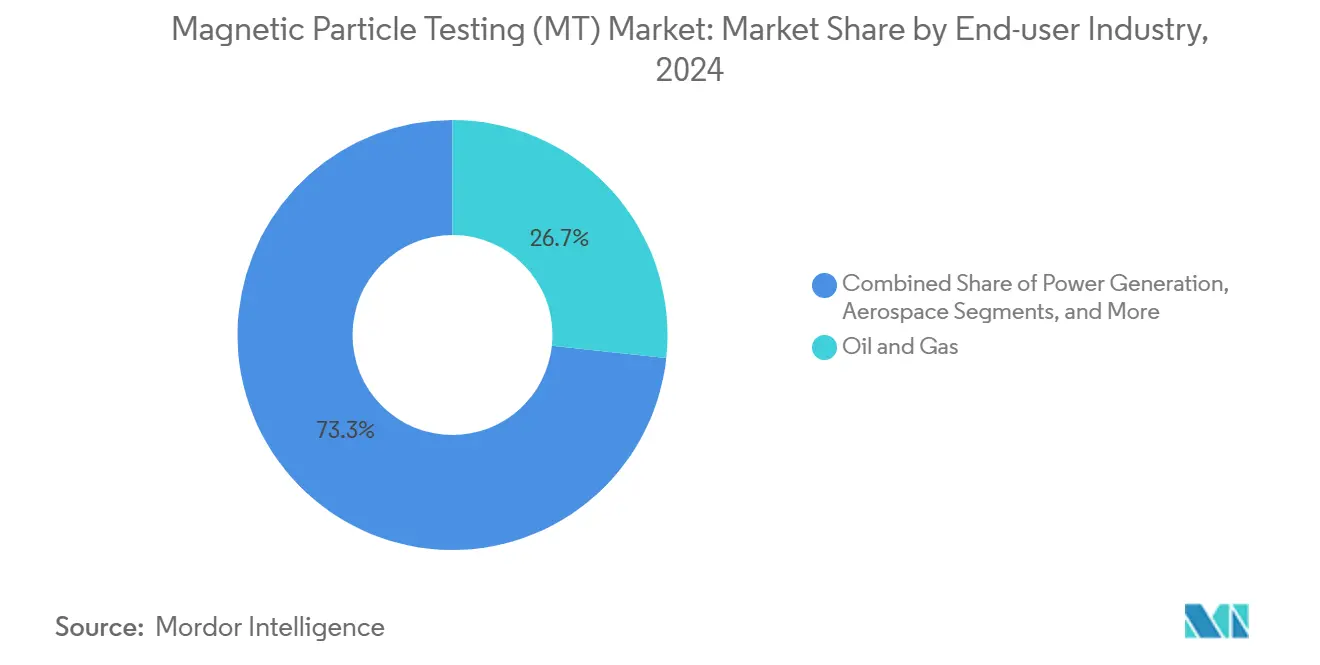
- By end-user industry, the oil and gas sector captured 26.7% of the magnetic particle testing market share in 2024, whereas the automotive and transportation sector is forecast to post the fastest growth at a 12.4% CAGR through 2030.
- By geography, North America led with a 35.1% revenue share in 2024, whereas the Asia-Pacific region is poised for a 9.2% CAGR through 2030.
Global Magnetic Particle Testing (MT) Market Trends and Insights
Drivers Impact Analysis*
| Driver | (~) % Impact on CAGR Forecast | Geographic Relevance | Impact Timeline |
|---|---|---|---|
| Rising asset integrity mandates in aging industrial infrastructure | +1.8% | Global, with a concentration in North America and Europe | Long term (≥ 4 years) |
| Surge in aerospace component production post-pandemic recovery | +1.4% | North America and Europe, expanding to the Asia-Pacific | Medium term (2-4 years) |
| Adoption of automated inline inspection in EV battery lines | +1.2% | Asia-Pacific core, spill-over to North America | Medium term (2-4 years) |
| Stringent weld quality codes in offshore wind projects | +0.9% | Europe and Asia-Pacific, emerging in North America | Long term (≥ 4 years) |
| Shift toward predictive maintenance driven by IIoT data lakes | +0.8% | Global, with early adoption in developed markets | Medium term (2-4 years) |
| Growing defense spending on naval vessel life extension | +0.7% | North America, Europe, and the Asia-Pacific defense sectors | Long term (≥ 4 years) |
| Source: Mordor Intelligence | |||
Rising Asset Integrity Mandates in Aging Industrial Infrastructure
Regulators are sharpening oversight as refineries, chemical plants, and transmission pipelines surpass their original design life. Updates to ASME BPVC Section V in 2024 incorporated stricter magnetic particle test requirements for pressure vessels, while the reaffirmation of ISO 9934 tightened global harmonization.[1]ASME, “Boiler and Pressure Vessel Code Section V Updates 2024,” asme.org Pipeline operators now treat magnetic particle testing as a mandatory screening method for stress-corrosion cracking, as a single mile of replacement pipe can exceed USD 1 million. Asset owners have shifted from reactive to scheduled inspections and now prefer automated benches that deliver digital records for audits. Robotics deployed in power stations reduces confined-space entry and maintains uniform magnetization on heavy sections. These trends underpin durable spending on certified instruments, consumables, and operator training.
Surge in Aerospace Component Production Post Pandemic Recovery
The combined narrow-body output of Boeing and Airbus is expected to increase by more than 40% by mid-2025, reactivating dormant supply chains and triggering new capital outlays for inspection cells. ASTM work item WK95865, which has been underway since July 2025, expands the E1444/E1444M-25 standard by incorporating equipment verification checks, aligning with the sector’s zero-defect mindset. Landing-gear beams, engine pylons, and titanium fasteners require 100% surface-crack screening. Therefore, primes are installing high-throughput, multi-station benches that rotate components through wet fluorescent, black-and-white, and demagnetization zones, eliminating the need for operator handling. Military programs are echoing the spike as navies extend the life of their vessels and missile-maker order books swell. Such synchronized demand for civilian and defense applications secures long-term revenue streams for aerospace-grade equipment builders.
Adoption of Automated Inline Inspection in EV Battery Lines
Gigafactories that weld thousands of aluminum casings per shift now embed magnetic particle heads between laser-weld cells and cleaning stations. Automotive OEMs value the method’s ability to reveal lack-of-fusion defects in deep fillet joints that visual cameras overlook. Robotic crawlers position yokes repeatably, while vision software identifies indications and streams them to manufacturing execution systems. Inline magnetization shrinks idle time from minutes to seconds and supplies timestamped images for ISO/TS 16949 traceability. Chinese battery giants CATL and BYD have standardized this configuration, pushing local suppliers to offer IIoT-ready power packs. North American and European plants are following suit as electric vehicle volumes rise and warranty risk climbs.
Stringent Weld Quality Codes in Offshore Wind Projects
European and Asian utilities are erecting monopiles weighing over 1,000 tons that must survive corrosive seas for decades. DNV and IEC guidelines prescribe magnetic particle scans of root and cap passes, while AWS D1.1 protocols have been folded into many fabricators’ procedures.[2]DNV, “Guidance on Magnetic Particle Inspection of Welds for Renewable Structures,” DNV, dnv.com Because post-installation repair is often impossible, inspection intensity before launch is extremely high. Tower sections now pass through automated rings that magnetize the entire circumference and photograph each indication. Turbine OEMs also test nacelle frames and blade root bushings to prevent fatigue-driven collapse. These practices ensure steady equipment orders for high-amperage power supplies and UV-LED lighting arrays, which are engineered for large-diameter welds.
Restraints Impact Analysis*
| Restraint | (~) % Impact on CAGR Forecast | Geographic Relevance | Impact Timeline |
|---|---|---|---|
| Skilled inspector shortage in developing economies | -1.1% | Asia-Pacific, and Middle East and Africa, and emerging in Latin America | Short term (≤ 2 years) |
| Hazardous waste disposal costs of magnetic powders | -0.8% | Global, with stricter regulations in Europe and North America | Medium term (2-4 years) |
| False-positive rates versus phased-array ultrasound | -0.6% | Global, particularly in high-precision applications | Long term (≥ 4 years) |
| Capital intensity of fully robotic MT cells | -0.5% | Developed markets with high labor costs | Medium term (2-4 years) |
| Source: Mordor Intelligence | |||
Skilled Inspector Shortage in Developing Economies
Roughly 30% of certified non-destructive-testing technicians are approaching retirement age, creating gaps that are most visible in fast-growing regions. Training new Level II personnel takes six to twelve months and requires supervised field hours that many local centers are currently unable to provide. As a result, project owners in Southeast Asia and parts of Africa often import expatriate inspectors at premium rates, lifting overall project costs. Some firms pivot to automated benches with AI-driven defect recognition to reduce reliance on scarce talent, yet initial capital outlays slow adoption. Industry associations are partnering with vocational institutes to accelerate the development of modular courses, but the near-term shortage continues to temper market expansion.
Hazardous Waste Disposal Costs of Magnetic Powders
Used fluorescent particles suspended in petroleum carriers are now classified as hazardous in the European Union under REACH and by U.S. state regulators. Disposal fees of USD 200-500 per drum add up quickly for service companies that execute large refinery turnarounds. Smaller contractors feel the squeeze most because they lack the volume to negotiate favorable rates. Water-based suspensions offer partial relief, yet they face local discharge restrictions that require onsite treatment. Equipment makers are experimenting with low-toxicity carriers and recyclable dry powders, but adoption remains limited by legacy procedures. Growing environmental oversight thus chips away at profit margins and can delay inspection campaigns in tightly scheduled outages.
*Our forecasts treat driver/restraint impacts as directional, not additive. The impact forecasts reflect baseline growth, mix effects, and variable interactions.
Segment Analysis
By Magnetization Current Type – AC Holds the Lead While HWDC Accelerates
Alternating-current benches maintained a 52.2% share of the magnetic particle testing market in 2024, thanks to their ease of use and crisp surface-crack visibility. Users in automotive stamping lines favor AC because it minimizes training requirements and cycles quickly. Half-wave direct-current systems, however, are advancing at a 9.9% CAGR as aerospace and energy operators seek deeper penetration in thick forgings. The magnetic particle testing market size for HWDC is projected to grow steadily through 2030, driven by demand for applications in landing gear and pressure vessels. OEMs now integrate programmable power supplies that toggle between AC and DC, letting inspectors match current to wall thickness without swapping hardware. This flexibility trims setup time, raises throughput, and supports mixed-material production cells.
The adoption of HWDC also aligns with the shift toward robotics. Automated stations equipped with multi-mode power units can run AC for cosmetic weld passes and switch to HWDC for root analysis in a single pass, thereby reducing the number of inspection steps. Standards such as ASTM E709 outline the amperage bands for each orientation, simplifying the qualification of procedures. Suppliers that certify both current modes under UL and CSA listings earn preference from multinational buyers who enforce harmonized safety rules across sites.


By Portability – Robotics Reshape Field and Factory Workflows
Portable yokes and handheld coils still account for 46.2% of revenue, as field crews require flexible tools for bridge gussets, offshore risers, and storage tanks. The magnetic particle testing market size tied to these units remains stable, particularly in maintenance and repair contracts. Yet automated and robotic cells are delivering a 12.9% CAGR as factories embed nondestructive testing directly into conveyors. Crawlers equipped with suction cups traverse vertical pipelines while articulating heads maintain lift over complex weld profiles. When indications appear, onboard cameras document flaws and send alerts to maintenance planners, closing the loop between quality control and asset health management.
Stationary benches continue to serve high-volume shops producing shafts, bearings, and bolt batches. However, customers now specify Industry 4.0 connectivity so that amperage settings, dwell times, and UV-LED exposure logs are fed into enterprise databases. This data helps correlate defect trends with upstream process variables, supporting lean initiatives. Vendors that couple magnetization with image-processing AI lower interpretation variance, a pain point for auditors who demand repeatability. As inspector availability tightens, such automation gains strategic weight in procurement decisions.
By End-user Industry – Oil and Gas Leads but Automotive Surges
Oil and gas operations accounted for 26.7% of the magnetic particle testing market share in 2024, driven by mandatory pipeline surveys and refinery turnaround scopes. Despite that dominance, electric-vehicle manufacturing is propelling automotive and transportation toward a 12.4% CAGR. Battery housings, e-axle shafts, and lightweight steel-aluminum hybrids require surface-defect screening before final assembly, as latent cracks can trigger thermal events. The magnetic particle testing market size allocated to automotive lines will therefore expand faster than legacy hydrocarbon applications.
Aerospace keeps steady orders as engine makers raise production cadence, while defense shipyards rely on magnetic particle testing to extend hull life. Construction players deploy yokes on onshore wind-tower sections, whereas chemical-plant operators scrutinize reactor seams that run at high pressures. Digital documentation is now pivotal across all sectors because regulators and OEM customers expect traceable evidence of inspection coverage. Suppliers offering cloud-based archives and secure data links position themselves for multi-year service contracts.
Geography Analysis
North America retained a 35.1% market share in 2024, sustained by tight federal oversight, extensive installed energy infrastructure, and leadership in aerospace manufacturing. U.S. pipeline owners schedule recurrent magnetic particle scans to satisfy the Pipeline and Hazardous Materials Safety Administration, while the Department of Defense directs ongoing hull surveys for naval vessels. Canada contributes to additional demand through its oil sands and mining assets, which are subject to harsh weather conditions and fatigue. Certified training centers in the United States maintain high inspector competency, ensuring timely project execution.
The Asia-Pacific region is the fastest-growing arena, with a 9.2% CAGR. China and India are expanding automotive, rail, and infrastructure projects that require large quantities of ferromagnetic inspections. Magnetic Analysis Corporation established an Indian subsidiary in 2024 to cater to local buyers who require prompt service and spare parts.[3]Magnetic Analysis Corporation, “Magnetic Analysis Corporation Establishes Indian Subsidiary to Enhance Local Support,” Magnetic Analysis Corporation, mac-usa.com South Korea’s shipyards depend on continuous magnetic particle testing of hull and propeller shafts to protect export reputations. Japan and Taiwan push the innovation frontier, integrating AI analytics into inspection software and supplying components to global OEMs.
Europe remains steady as offshore wind and automotive electrification absorb capital. Germany’s Tier-1 suppliers automate test bays for crankshafts and EV motor cores, while the United Kingdom enforces rigorous tower inspections in North Sea wind farms. REACH regulations steer buyers toward water-based particles, prompting equipment retrofits. Elsewhere, the Middle East and Africa are emerging as hubs for pipelines and petrochemicals; however, progress is hindered by the talent gap in the inspectorate and by budget allocation cycles in government-owned projects.

Competitive Landscape
The magnetic particle testing market features a moderate but widening field of players. Incumbents Magnaflux and Olympus offer broad product ranges, rugged after-sales networks, and brand familiarity. Their portfolios now include UV-LED lamps with longer life, variable frequency power packs, and mobile data-logging apps that push reports to cloud storage. Automation specialists, such as Eddyfi, which was amplified by its USD 445 million Zetec acquisition in December 2024, bundle robot arms, multi-modal NDT sensors, and AI software into turnkey cells.[4]Eddyfi Technologies, “Eddyfi Finalizes Acquisition of Zetec,” eddyfi.com
Regional manufacturers in India and China supply cost-optimized benches for mid-tier workshops, adding competitive tension at the low-to-mid price points. New entrants leverage edge-processing chips and open-source vision libraries to interpret indications without high-end servers, reducing barriers for small repair shops. Strategic alliances between equipment manufacturers and predictive-maintenance software vendors are forming because asset owners want inspection information to flow into their enterprise dashboards. This trend shifts bargaining power toward firms proficient in data architecture, not just magnetization physics.
Customer procurement teams are also evaluating carbon footprints. Suppliers that source rare-earth-free magnets, as Niron Magnetics does in its Minnesota plant, gain credibility with ESG-focused buyers. Overall, the top five vendors account for roughly 38% of global revenue, placing the industry in a mid-fragmented state with ample room for both consolidation and local specialization.
Magnetic Particle Testing (MT) Industry Leaders
Eddyfi Technologies
Olympus Corporation (Evident)
Zetec Inc
Applus+ Laboratories
Waygate Technologies
- *Disclaimer: Major Players sorted in no particular order

Recent Industry Developments
- August 2025: Industrial Inspection and Analysis highlighted Ontario tower crane rules and issued magnetic particle testing compliance guidance.
- July 2025: ASTM International began revising E1444/E1444M-25 to tighten aerospace function-verification guidelines.
- March 2025: Niron Magnetics won the mHUB Innovation of the Year award for iron-nitride technology.
- January 2025: Niron Magnetics secured USD 52 million to scale domestic magnet production.


Global Magnetic Particle Testing (MT) Market Report Scope
| Alternating Current (AC) |
| Direct Current (DC) |
| Half-wave Direct Current (HWDC) |
| Portable or Handheld |
| Stationary or Benchtop |
| Automated or Robotic |
| Oil and Gas |
| Power Generation |
| Aerospace |
| Defense |
| Automotive and Transportation |
| Manufacturing and Heavy Engineering |
| Construction and Infrastructure |
| Chemical and Petrochemical |
| Marine and Ship Building |
| Electronics and Semiconductor |
| Mining |
| Medical Devices |
| Others |
| North America | United States |
| Canada | |
| Mexico | |
| South America | Brazil |
| Argentina | |
| Rest of South America | |
| Europe | Germany |
| United Kingdom | |
| France | |
| Italy | |
| Spain | |
| Rest of Europe | |
| Asia Pacific | China |
| Japan | |
| India | |
| South Korea | |
| South-East Asia | |
| Rest of Asia Pacific | |
| Middle East | Saudi Arabia |
| United Arab Emirates | |
| Turkey | |
| Rest of Middle East | |
| Africa | South Africa |
| Nigeria | |
| Rest of Africa |
| By Magnetization Current Type | Alternating Current (AC) | |
| Direct Current (DC) | ||
| Half-wave Direct Current (HWDC) | ||
| By Portability | Portable or Handheld | |
| Stationary or Benchtop | ||
| Automated or Robotic | ||
| By End-user Industry | Oil and Gas | |
| Power Generation | ||
| Aerospace | ||
| Defense | ||
| Automotive and Transportation | ||
| Manufacturing and Heavy Engineering | ||
| Construction and Infrastructure | ||
| Chemical and Petrochemical | ||
| Marine and Ship Building | ||
| Electronics and Semiconductor | ||
| Mining | ||
| Medical Devices | ||
| Others | ||
| By Geography | North America | United States |
| Canada | ||
| Mexico | ||
| South America | Brazil | |
| Argentina | ||
| Rest of South America | ||
| Europe | Germany | |
| United Kingdom | ||
| France | ||
| Italy | ||
| Spain | ||
| Rest of Europe | ||
| Asia Pacific | China | |
| Japan | ||
| India | ||
| South Korea | ||
| South-East Asia | ||
| Rest of Asia Pacific | ||
| Middle East | Saudi Arabia | |
| United Arab Emirates | ||
| Turkey | ||
| Rest of Middle East | ||
| Africa | South Africa | |
| Nigeria | ||
| Rest of Africa | ||


Key Questions Answered in the Report
How big is the magnetic particle testing market in 2025?
The magnetic particle testing market size is expected to reach USD 1.88 billion by 2025.
What is the expected growth rate through 2030?
The market is projected to grow at a 7.79% CAGR from 2025 to 2030.
Which region grows fastest through the forecast period?
Asia-Pacific is projected to post the highest regional CAGR of 9.2% through 2030.
Which current type gains momentum?
Half-wave direct current systems are advancing at a 9.9% CAGR due to deeper penetration needs.
What end-user segment outpaces others?
The automotive and transportation sectors are expected to lead future growth, with a forecast 12.4% CAGR as electric vehicle production scales.
How will automation influence future demand?
Automated and robotic inspection lines are set to grow at a 12.9% CAGR as manufacturers pursue inline, data-rich quality control.
Page last updated on:


